ATLAS-CONF-2010-074 28July2010
ATLAS NOTE
ATLAS-CONF-2010-074
July 20, 2010
High-p
Tdijet angular distributions in pp interactions at √
s = 7 TeV measured with the ATLAS detector at the LHC
The ATLAS Collaboration
Abstract
Dijet angular distributions from the first proton-proton collisions at center-of-mass en- ergy √
s = 7 TeV have been measured with the ATLAS detector at the LHC. The data set used for this analysis represents an integrated luminosity of 61 ± 7 nb−1, collected from March to July 2010. Dijet angular distributions and occupancy ratio distributions have been measured. Comparisons of these distributions with predictions from QCD show good agree- ment between data and QCD. A search for quark contact interactions has been performed, showing that they are excluded above a distance scale of 2.3× 10⁻⁴ fm with the available data. In addition, the data have been compared to QCD distributions summed with a template for physics beyond the Standard Model, allowing generic limits to be set on non-resonant new physics with isotropic dijet final states. For dijet masses between 520 and 680 GeV a ratio of potential signal over QCD background greater than 8% is excluded at the 95%
confidence limit.
1 Introduction
QCD processes leading to dijets with high transverse momentum (pT ) are dominated byt-channel ex- changes, producing angular distributions that decrease rapidly with scattering angle. By contrast, exotic physics processes are characterized by short-distance interactions that are relatively isotropic, and lead to energetic, widely separated, jets. In this high-pT regime, departures from the Standard Model would be most pronounced at large angles relative to the beamline and for large dijet invariant mass, Mj j. In the present analysis we focus on dijet angular distributions binned in theχvariable and on topological occupancy distributions or ‘ηratios’, both of which are defined and discussed in Section 4.
Previous experiments [1–4] have shown that dijet angular distributions provide a good tool for prob- ing both new physics and QCD. In particular, these angular distributions are less affected by theoretical and experimental uncertainties, such as the jet energy scale uncertainty, than are other distributions; for example, the inclusive jet pTspectrum.
The central thread of this analysis is to look for deviations from the behavior expected from QCD in the first LHC data available in this new energy regime. While the current LHC data set at √
s = 7 TeV is small, the 3.5-fold increase in energy has lifted the LHC experiments into an unexplored kinematic regime. In these early data sets, the ATLAS Collaboration is pursuing the measurement of dijet angular distributions both in their own right, and to commission the machinery that will carry this analysis into the future.
A search for quark compositeness has been performed, using the conventional model of quark four- fermion contact interactions, and a compositeness scale limit for the current data set has been established.
A search has also been performed for quantum black holes (QBH), using them as a generic signal template for non-resonant exotic processes that could potentially appear at the LHC. First, limits are derived for this generic shape, constraining the potential fraction of events produced by these processes at the 95% confidence level. Then, since some QBH theories present the greatest opportunity for early detection, or improved limits, due to their large cross section, this study concludes with the exclusion of potential production thresholds for a specific model.
2 The ATLAS Detector and Calorimeter
The ATLAS detector [5] covers almost the whole solid angle around the collision point with layers of tracking detectors, calorimeters and muon chambers. For the dijet measurements presented in this paper, the calorimeter system is of particular importance.
Liquid-argon (LAr) technology is used in the ATLAS electromagnetic sampling calorimeters, with excellent energy and position resolution, to cover the pseudorapidity range |η| < 3.2. The hadronic calorimetry in the range|η|<1.7 is provided by a sampling calorimeter made of steel and scintillating tiles (TileCal). The TileCal is separated into a large barrel and two smaller extended barrel cylinders, one on either side of the central barrel. In the end-caps (|η|>1.5), LAr technology is also used for the hadronic end-cap calorimeters (HEC), matching the outer |η|limits of the end-cap electromagnetic calorimeters.
To complete the η coverage, the LAr forward calorimeters (FCal) provide both electromagnetic and hadronic energy measurements, and extend the coverage to|η|=4.9.
Since dijet signals due to exotic processes are most likely to appear at the highest pT in the central region, the central calorimeter depth must be sufficient for longitudinal containment of hadronic showers.
For the ATLAS central region, the minimum depth at the back of the calorimeter is 9.75 absorption lengths (λ) atη=0, and the depth at highest|η|is, again, 9.75λat|η|=4.9, with greater depths between these limits. Similarly, dijet angular distributions require good resolution in angle and energy, both of which are improved by fine segmentation. In ATLAS, the calorimeter granularities are 0.1×0.1 for all hadronic calorimeters up to|η|<2.5, and then 0.2×0.2 up to|η|<5.0. The EM calorimeters feature a
much finer readout granularity varying by layer, with cells as small as 0.025×0.025 extending to|η|<
2.5.
The operational fractions for early 2010 of the various calorimetry systems were 97% (Tile), 98%
(LAr), almost 100% (HEC) and 100% (FCal). Approximately 187,000 calorimeter cells (99% of the total) were usable for event reconstruction.
3 Data Sample, Initial Event Selection, and Jet Reconstruction
The 61±7 nb−1sample of ppcollisions at √
s=7 TeV was collected online using a simplified trigger configuration that required a lowest-level (L1) hardware-based calorimeter jet trigger to be fired with nominal energy thresholds of 10 and 15 GeV [6]. Only events recorded during stable beam and good detector conditions have been used.
3.1 Jet Angular Variables
When reconstructing jets, the natural angular variables are rapidity,y, or pseudorapidity,η, instead of the angle relative to the beamline, θ. The primary motivation for usingyis that any interval∆yis invariant under Lorentz boosts. This property causes QCD jets produced in the parton center-of-momentum frame to retain their "shapes" in the angular space ∆y×∆φwhen boosted to the detector frame by parton x imbalance. Shape invariance is a critical element in obtaining optimal performance from jet algorithms.
While the rapidity,y, depends on jet masses; pseudorapidity,η, depends only onθ, and approachesy in the high momentum limit. With its more direct connection to detector geometry,ηis the appropriate variable to use when applying jet selection criteria; whereas y is preferable for comparison to theory, since it is closely associated with physical processes. In the current analysis we use η for selections based on fiducial volume, andyfor selections and analyses pertaining to theory.
3.2 Jet Reconstruction
The first step in jet reconstruction is to identify localized calorimeter energy deposits, and to represent them as clusters of ‘nearby’ calorimeter cells, determining the total energy E = P
Ecell of each cluster, as well as its centroid in the detector frame of reference. Each cluster can then be referred to as a massless pseudo-particle (in e.g. jet reconstruction), with its momentum pointing to the direction of its energy weighted centroid (ηcluster, φcluster) in the nominal ATLAS coordinate system. Consequently, the jet kinematic variables calculated in this note are based in this same coordinate system.
In the current analysis, all clusters signals are reconstructed at the ‘electromagnetic’ (EM) energy scale, the fundamental signal energy scale for the ATLAS calorimeter. This scale gives the correct value for energy deposited by electromagnetic showers, but does not include corrections for the lower response to hadronic showers.
ATLAS jet algorithms determine jet energies and directions by summing cluster four-vectors, using algorithm-specific criteria to determine which clusters to include in each jet. In this process, though the clusters are massless, jets acquire masses due to the angular spread of their clusters.
In order to relate jet properties to the underlying partonic scattering, the jet reconstruction algorithm must be infrared and collinear safe. The anti-kT [7] algorithm has this property, and is used throughout this study with the size parameter equal to 0.6 and full four-momentum recombination.
3.3 Jet Energy Calibration
Jets reconstructed from clusters set to the EM-scale must be recalibrated. In the current analysis of
√s = 7 TeV data, all jets have their total energy rescaled by a single factor, the Numerical Inversion
constant [6], which has been determined as a function of the jet pT and ηby comparing detector level jets to particle level jets (EReco/Etruth) in Monte Carlo (MC). This will rescale the jet four-vectors, thus rescaling energy, momentum, and mass; while leaving the angular variables of jets, or dijets formed from them, unchanged.
The jet energy scale calibration [6] has been verified and its accuracy estimated through (1) in situ measurement of single particle response [8], (2) using a set of dedicated MC samples to study systematics and (3) an in situηintercalibration method that uses thepTbalance of all dijets (irrespective of theη’s of their component jets) to calculate intercalibration weights with the highest available statistics. Methods (1) and (3) depend only on detector properties, and do not include corrections that would involve complex observables, such as jet shapes.
3.4 Monte Carlo Specifics
The Monte Carlo simulation needed for the jet calibration, and for analyses described below, has the following essential components. The MC event generator samples have been produced with Pythia 6.4.21 [9] at a center-of-mass energy √
s=7 TeV, with the ATLAS MC09 parameter tune (which utilizes the MRST2007LOmod PDF) [10]. The samples are QCD dijet events, which were generated in specific bins of parton transverse momentum produced by the 2 →2 matrix element. This is necessary in order to obtain a reasonable number of events at high pT due to the steeply falling dijet cross section. The samples are then re-combined by weighting the events in each sample according to the cross section for that sample. The generated events are passed through the standard Geant4 [11] simulation of the ATLAS detector [12] and then fully reconstructed and analyzed using the same procedure as is applied to the data.
4 Dijet Event Selection Criteria, and Angular Distributions
The essential selection criterion for exotic dijet events is that there be at least two jets, and that the two leading (highest pT ) jets have sufficient pT to be relevant to the analysis at hand. And, since exotic signals are expected to populate the central region – which also represents the best understood detector volume – the two leading jets are required to be within|η| <2.8.
Considerations of trigger and selection efficiences lead to the following selection criteria: the leading jet is constrained to have pT >60 GeV, and the next-to-leading jet must have pT > 30 GeV. For events meeting these pTcriteria, the trigger and the jet reconstruction efficiences are close to 100%.
Furthermore, events are rejected [13] if (1) the leading or the next-to-leading jet is not associated with in-time calorimeter energy, or (2) if there is any jet with pT> 15 GeV that is badly measured due to dead cells, masked cells, or other effects, or (3) if there is no vertex with>4 tracks andz<100 mm.
These selection criteria [13] remove≤0.5% of the events.
To maximize the sensitivity of binned spectra for exotic signals, further event selection criteria are employed. Event selection based on jet angular variables consists of first defining an acceptance in the ‘detector’ variable η, followed by a set of selections in the ‘physics’ variable yof jets within the acceptance. To motivate the choices, we first outline the studies that have led to these angular selection criteria, as well as the pTselection criteria described above.
4.1 DijetχSpectra
The first of the dijet angular distributions analyzed in this study is the differential cross section dσ/dχvs χin bins of dijet invariant mass, Mj j, with
χ=exp(|y1−y2|)=exp(2|y∗|), (1)
wherey1 andy2 are the rapidities of the two highest pT jets in the event, andy∗ = (y1−y2)/2, which is directly related to the scattering angle in the dijet frame. The distribution is measured up to a certain value χmax, and is often normalized to unit area in 1 < χ < χmax, i.e. (1/σ)dσ/dχ. For example, the choice of this normalization in the current study avoids introducing the integrated luminosity, and its attendant uncertainty, into the normalization of the data.
The dominant 2-to-2 parton processes in QCD are thet-channel analogs of Rutherford scattering, with sharp peaking in the forward direction. The utility of the χvariable is that it remaps the angular distribution to emphasize larger angle processes, such as those characteristic of the more-isotropic ex- otic physics interactions. QCD produces aχdistribution which is slowly varying. In searches for new physics, when QCD is being considered as the background process, this slow variation relative to hy- pothesized new signals makes the analysis more robust against false signals. New physics is expected to appear as an excess of events at lowχfor a large dijet mass.
4.2 Kinematic selection criteria forχSpectra
The dijet angular distribution is a convolution of the hard scattering cross section with the parton distribu- tion functions (PDF’s). Kinematic selection criteria are applied to reduce the impact of PDF uncertainties and to enhance the effects of the hard scattering process, which carries the information about new physics.
The basic strategy is to find combinations of the physics observables, the leading and next-to-leading jet rapiditiesy1andy2, that limit the variation in partonic variables x1and x2(and, thus, the variation in the PDF’s), while leaving variation in the dijet observable,χ, relatively unconstrained.
Consideration of the underlying kinematic variables, along with extensive Monte Carlo studies, have led to the following kinematic criteria. Consider only jets with|y|1,2 <|y|max, with|y|maxdictated by the limited detector range. In order to benefit maximally from the detector, the orthogonal selection criteria are applied toy∗, the dijet frame angular variable introduced above, and toyboost =(y1+y2)/2, which is the boost of the dijet system w.r.t. the laboratory frame. Departures from SM physics would be expected for large scattering angles (small y∗), and for collisions where both incoming partons have similar |x| (smallyboost).
In order to see the shape differences in SM and exotic angular distributions, there must also be a sufficient range inχ. For an angular distribution measurement up toχmax, the following set of criteria has been applied:
2|y∗|=|y1−y2|<2|y|max−c (2)
2|yboost|=|y1+y2|<c (3)
withca parameter that is a trade offbetween statistics, range inχ, and sensitivity to new physics. In this study c = 1.5 andymax = 2.45 are chosen. With these criteria the distributions can be measured up to χmax=exp(2ymax−c)30.
The χ distributions are also binned in dijet invariant mass Mj j and plotted for each mass bin of interest. The dijet invariant mass of two massless partons can be written as:
Mj j = √ pT1pT2
pχ+1/χ−2 cos(∆φ), (4)
with pT1and pT2 being the transverse momenta of the highest and second highest jet respectively, and with∆φ=|φ1−φ2|.
In the 7 TeV data analyzed here the range in Mj j is limited. Thus two bins have been defined, with Mj jranges from 340 to 520 GeV, from 520 to 680 GeV.
The lower mass bin has less sensitivity to new physics and is used mainly as a control sample to compare data with QCD. It utilizes a jet trigger that is fully efficient at a leading jet pT of 60 GeV (L1_J10). Because of trigger rate considerations not all events satisfying the conditions of that trigger
are recorded, and the effective integrated luminosity is 40 nb−1. The upper mass bin contains the more energetic collisions in the dijet frame, and is most appropriate for setting limits on exotic processes. The ability to set limits with the current data sample is most strongly affected by the number of events in this bin. Thus a jet trigger with a higher threshold, being fully efficient at 80 GeV (L1_J15), is used to avoid possible loss of available statistics due to trigger rate considerations. The full 61 nb−1of integrated luminosity are available with that trigger. The low-mass thresholds of these bins are high enough to assure that the corresponding measuredχ-spectra are not biased by the trigger selection.
4.3 Binning forχSpectra
Along with the kinematic criteria given in the previous section, a binning inχmust be defined for physics analysis, based on full Monte Carlo simulation of dijets. The primary metrics used to establish the binning are bin ‘purity’ and ‘stability’, as described below. These two variables quantify bin migrations between generated particle level spectra and reconstructed spectra. Migrations induced by dijet mass resolution and byχresolution were considered simultaneously.
Given a bin,i, we defineNG(i) as the number of dijets generated in bini, andNR(i) as the number reconstructed in bin i. We also define NRG(i, j) as the number of events that are generated in bin j and reconstructed in bin i. Then we define the Purity as P(i,j) = NRG(i, j)/NR(i), and Stability as S(i,j)=NRG(i,j)/NG(j).
The goal is to find a binning with both highPurityandStabilityfor the diagonal cases,i= j; that is, P(i,i) andS(i,i). By achieving this over the whole range ofχand for all dijet mass ranges, resolution effects on the shape ofχspectra are minimized.
In the case ofχ-spectra two further criteria were considered. The first one is the ability to resolve the detailed shape ofχ-spectra at lowχ, where an excess of events is expected for the studied models of new physics. The second one is the typical cell granularity of the ATLAS hadronic calorimetry, which is 0.1 inηfor the Tile Calorimeter. Small migrations of the jet axes due to the granularity can be observed, which lead toη-difference migrations of the same periodicity. The borders betweenχbins were placed at points of minimal migration to maximize the stability ofχspectra.
4.4 DijetηRatio Spectra and their event selection criteria
The second type of dijet angular distributions analyzed are ‘ηratios’, plotted as a function of Mj j–an alternative path to exotic physics signals. To calculateηratios, the detector is segmented into two regions:
central and non-central. Theηratio is defined as the ratio of the number of events where the two highest pT jets fall into the central region to the number of events where the two highest pT jets fall into the non-central region. Since exotic physics signals are expected to produce more central activity than QCD processes do, this is another method for exploring angular ‘shape’ differences between the two. As with theχdistributions, one expects exotic signals to appear at high Mj j. And, like the angular distribution as a function ofχ, theηratio distribution for QCD is very close to being flat in its variable, Mj j. If an exotic physics signal appears above some threshold in dijet invariant mass, Mj j, such a feature would be easily seen in theη ratio spectrum. Like theχdistributions, η ratios are also robust in the presence of a shift in the absolute jet energy scale (JES) since new features due to exotic processes would only be shifted in position.
This variable is well suited to an early analysis, as theηrange may be restricted to the most central regions of the calorimeter, where the jet energy resolution is best. For the current study, the η ratio analysis constrains the two leading jets to |η| < 1.0. This minimizes the potential differences in jet response between the central dijet events, defined by 0<|η1,2|<0.5, and non-central dijet events, defined by 0.5<|η1,2|<1.0.
As with theχdistribution analysis, single jet triggers are used, along with an event selection require- ment based on the leading jet pT , to avoid potential trigger bias. The lowest unbiased dijet mass for a given selection of leading jet transverse momenta can be obtained from the formula 4 withχmax≈exp(2).
Combined with the efficiencies of the single jet triggers, this gives a prescription for identifying the trig- ger that provides the greatest statistics for a given range in dijet invariant mass (L1_J10 for 200<Mj j <
250 GeV, L1_J15 above).
5 Jet Uncertainties in Reconstruction and Monte Carlo
In this section we consider how systematic uncertainties associated with (1) jet energy scale, and (2) parton distribution functions, may be convolved to produce bin by bin uncertainties for spectra under study in the current analysis.
Pseudo-experiments (PE’s) have been used to perform this convolution. The central idea of the PE method is to create an ensemble of independent replicas of experimental outcomes with overall statistical variation resulting from all contributions to the uncertainty. The output of this algorithm is a bin by bin prediction of the overall uncertainty and its component uncertainties. This information forms the basis for much of the statistical analysis described in Section 8, where Bayesian and Frequentist methods are applied to set limits on parameters for the theoretical models under study.
5.1 The jet energy scale (JES) uncertainty
The jet energy scale and calibration were discussed in Section 3, whereas here we focus on the JES uncertainty. The ATLAS JES uncertainty [14] was determined by convolving a comprehensive set of uncertainties from the following: (1) closure of the Numerical Inversion in Monte Carlo determined using a set of dedicated samples, (2) single particle response studies, and (3) the η intercalibration method.
The end result was provided as a function, convenient for use in simulation, depending on pT and η:
σJES(pT, η). With the currently available ATLAS data sets, the JES uncertainty ranges from a minimum of 5% to a maximum of 10% over the calibrated portion of the ATLAS calorimeter. The fluctuations due to absolute JES uncertainty are assumed to be fully correlated across pT andη. As angular distributions are sensitive to relative JES differences inη, an additional 3% uncertainty of the inter-calibration was used forχspectra. Theηratio uses more central jets only, resulting in an inter-calibration uncertainty of 1%.
In the current analysis, for a given spectrum under study, 1000 pseudo-experiments are performed, using all events in the data set and allowing the jet energy scale to fluctuate in accordance with σJES(pT jet, ηjet). For each pseudo-experiment a factor is sampled from a Gaussian distribution G(1, σJES(pT , η)) and applied toEand pT of all jets (without changing the jet direction). In the end, 1000 independent pseudo-spectra have been generated. These spectra are then used as input to the next stages of the algorithm, described in Sections 5.2 and 5.3.
5.2 Parton distribution function (PDF) uncertainty
The PDF uncertainty is convolved with the JES uncertainty by performing PDF pseudo-experiments, of NPDF instances, on each of the 1000 pseudo-spectra generated in the first step. The PDF’s and their errors are taken from CTEQ6.6 [15], with the asymmetric errorsσPDF+and σPDF−for each bin of the studied spectrum being obtained through the use of Master equations [16]. To model the asymmetric errors, when a random numberδp is generated, ifδp ≥ 0, thenσPDF+is used, while forδp ≤0,σPDF−
will be chosen. δp is then multiplied by the chosen σPDF to give the variation ∆p due to the PDF uncertainty. This variation is applied in turn to each bin of each pseudo-spectrum. The fluctuations due
to PDF uncertainty are assumed to be fully correlated across pT andηbins, which agrees well with the correlations among the 44 spectra obtained with the CTEQ6.6 error pdfs.
The number of JES and PDF pseudo-experiments have been chosen to be large enough to ensure that the error on the resulting limit due to the number of pseudo-experiments is negligible.
6 Measured Dijet Angular Distributions and Their Uncertainties
6.1 χDistributions
For theχdistributions, two dijet invariant mass bins have been chosen for analysis, based on the available statistics. In this analysis, the lower mass bin is the control sample, used to establish the correspondence between data and the QCD Monte Carlo; and the upper mass bin is the sample where exotic physics signals would be more likely to appear, used to set limits on new physics processes.
2|
1-y
= e|y
χ
5 10 15 20 25 30
Relative Uncertainty
-0.10 -0.05 0.00 0.05
0.10 PDF Uncertainty
JES Uncertainty
Total Systematic Uncertainty
ATLAS Preliminary
(a) 340<Mj j<520 GeV.
2|
1-y
= e|y
χ
5 10 15 20 25 30
Relative Uncertainty
-0.10 -0.05 0.00 0.05
0.10 PDF Uncertainty
JES Uncertainty
Total Systematic Uncertainty
ATLAS Preliminary
(b) 520<Mj j<680 GeV.
Figure 1: Relative systematic uncertainties ofχspectra for 340< Mj j <520 GeV (a), and 520<Mj j<
680 (b), with respect to the QCD prediction.
To show the relative importance of the systematic uncertainties in the QCD prediction, Figure 1 contains the uncertainty bands for both mass ranges as a function ofχ.
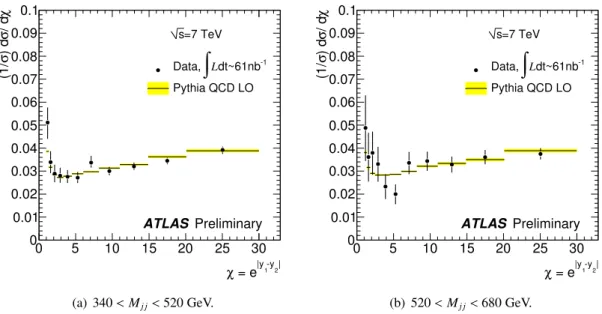
With these uncertainties in hand, we may now plot, for both mass bins, the QCD prediction and combined theoretical uncertainties, overlaid by the data, with experimental uncertainties. Figure 2 shows the close correspondence between QCD in the lower mass bin (a), and the available data in the upper mass bin (b), to be used for limit calculations in Section 8. In these plots the QCD predictions are denoted by yellow bands, where the vertical extent of the band represents the combined total theoretical uncertainties.
The agreement with QCD is good, withχ2/N DF =1.4 and 1.1 for the low and high dijet mass bins, respectively. Data hints at the QCD LO prediction slightly underestimating the hard component of the spectra at lowχ. Statistical uncertainties only allow a tentative statement, though, and underestimation at lowχis conservative with regard to setting limits on new physics.
2|
1-y
= e|y
χ
0 5 10 15 20 25 30
χ/ dσ) dσ(1/
0 0.01 0.02 0.03 0.04 0.05 0.06 0.07 0.08 0.09 0.1
=7 TeV s
dt~61nb-1
∫
L Data, Pythia QCD LOATLAS Preliminary
(a) 340<Mj j<520 GeV.
2|
1-y
= e|y
χ
0 5 10 15 20 25 30
χ/ dσ) dσ(1/
0 0.01 0.02 0.03 0.04 0.05 0.06 0.07 0.08 0.09 0.1
=7 TeV s
dt~61nb-1
∫
L Data, Pythia QCD LOATLAS Preliminary
(b) 520<Mj j<680 GeV.
Figure 2: Detector levelχdistributions for 340<Mj j<520 GeV (a), and for 520<Mj j<680 GeV (b).
Shown are the QCD prediction including the theoretical uncertainties (band), and 7 TeV collision data including experimental uncertainties (black dots).
6.2 η-Ratio Distribution
Now turning to the η-ratio distribution, pseudo-experiments are used again to calculate the systematic uncertainties associated with a full detector simulation of the QCD Monte Carlo prediction. This dis- tribution provides complementary information about the running of the exotic signal cross-section with dijet invariant mass, and is used either as evidence for new physics, or for setting limits.
For the available date, Figure 3(b) shows good agreement with QCD, the resultingχ2/N DF being 0.43. Consequently, in Section 7,η-ratio distributions will be used for setting limits on exotic processes.
7 Signal Hypotheses for Physics beyond the Standard Model
The conclusion from Section 6 is that there is good agreement between data and the QCD prediction in the χspectrum for 340 <Mj j < 520 GeV. A comparison of data and Monte Carlo in the higher mass bin, where an increased sensitivity to new physics is expected, will now be used to constrain potential contributions to the spectra from processes beyond the Standard Model.
Given a new theoretical exotic physics process, that would appear in the presence of a QCD-like spectrum, the exotic physics model is ideal for limit-setting if it contains one or more continuously variable parameters. A ‘hypothesis’ may then be created by choosing a value, or set of values, for the model parameters, creating a test ‘signal’ that might appear above background. In general, this signal will differ in shape from the QCD background.
7.1 Quark Compositeness, and Contact Interactions
For a number of years, signals of quark compositeness have been sought in dijet angular distributions and jet inclusive pT spectra, by the CDF and D0 experiments at the Fermilab TeVatron Collider [3, 4].
But to date only limits have been set. Since ppcollisions at √s=7 TeV at the LHC provide a factor of 3.5 increase in center-of-mass energy relative to the TeVatron, these searches will continue in the ATLAS and CMS experiments, leading either to more stringent limits or to the discovery of quark compositeness.
Dijet Invariant Mass (GeV)
200 300 400 500 600 700
Relative Uncertainty
-0.10 -0.05 0.00 0.05 0.10 0.15 0.20
Relative JES Uncertainty Absolute JES Uncertainty PDF Uncertainty All Systematics
ATLAS Preliminary
=7 TeV s
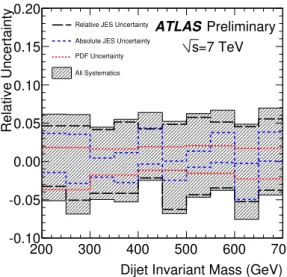
(a) Relative systematic uncertainties of theη-ratio spec- trum with respect to the QCD prediction.
Dijet Invariant Mass (GeV) 200 300 400 500 600 700 800
-Ratioη
0.0 0.5 1.0 1.5 2.0 2.5
Data
∫
Ldt=61nb-1 Pythia QCD LOATLAS Preliminary
=7 TeV s
(b)ηratio distribution
Figure 3: Relative η-ratio uncertainties (a), and theη-ratio distribution (b). Shown in (b) are the QCD prediction including the theoretical uncertainties (band), and 7 TeV collision data including experimental uncertainties (black dots).
In the absence of any compositeness models to provide a detailed description of the scattering pro- cess, current convention is to parameterize the Lagrangian as an effective four-fermion contact inter- action [17], by analogy with the Fermi four-fermion interaction used to describe effects of the weak interaction prior to the discovery of theWboson.
In high-pt dijet production, quark-quark processes dominate, so that only quark compositeness can be investigated. If quarks are made of constituents, then at the scale of the constituent binding energy (Λ), new interactions among quarks should appear. IfΛis much larger than √
ˆ
s, these interactions are suppressed by inverse powers ofΛand the quarks would appear to be point-like. The dominant effect should then come from the lowest dimensional interactions with four fermions (contact terms). The contact interaction model used in this study is described by the following effective Lagrangian:
Lqqqq(Λ)= ηg2 2(Λ+LL)2q
Ψ¯LqγµΨqLΨ¯LqγµΨLq, (5) whereη = +1 (destructive interference), g2/4π = 1 and the quark fieldsΨqLare left-handed (this is the LLmodel).
We shall now adopt the simplified notation: Λ ≡ Λ+LLThe contact interaction model described in Eq. 5 is available in Monte Carlo generators. All quarks are considered composite.
The full Lagrangian is the sum of the Lagrangian in Eq. (5) and the QCD Lagrangian. The relative phase of these terms is controlled by the interference parameter, η, which may be chosen in the range from -1, for maximum constructive interference, to+1 for maximum destructive interference. For con- servatism in the setting of limits it has become conventional to choose destructive interference (+1). It should be noted that the interference complicates limit analysis since the compositeness signal cannot be treated as an incoherent term that simply adds to QCD. Instead of usingΛas a continuous parame- ter, angular distribution templates must be generated for specific choices of Λ, and then applied to the statistical analysis.
The contact term description can be used to model theonsetof compositeness effects at some char-
acteristic scale Λ. But it cannot be used as a realistic model above this scale since it does not describe interactions among quark constituents. The contact term model is an ‘unphysical’ description for scales aboveΛ.
While increased √
sultimately gives the LHC a greater reach for detection of quark compositeness, analysis of the current 7 TeV ATLAS data shows that in the low dijet mass regime under study the LHC is at a disadvantage relative to the TeVatron. At the LHC, dijet production in this mass range is dominated by interactions with significantly lower parton momentum fractions (x) compared to the TeVatron. At low x, jets are produced primarily by gluon processes, while the quark compositeness signal would come solely from qq interactions. As the LHC experiments continue to take data at 7 TeV, with the accumulation of large samples of dijets with high pT and high mass, this situation will ‘reverse’. The higher energy and increased luminosity of the LHC will yield significantly higher sensitivity to quark compositeness.
7.2 Sensitivity to exotic signals
If the signal corresponds to a given cross sectionσ, with total acceptanceA, then the cross section relative to QCD background may be characterized by the following relative cross section,θ:
θ= σ(signal)×A(signal)
σ(QCD)×A(QCD) (6)
Determining the limit on the model hypothesis involves finding the acceptance dependent limits onθ, and then comparingθlimittoθhypothesisto exclude the hypothesis for the given values of its model parameters.
One advantage of the use ofθis that a single signal template can be used to derive generic limits on the relative cross section of a class of physics beyond the Standard Model.
7.3 Quantum Black Holes
In a novel theoretical approach to quantum gravitational effects in models with large extra dimensions, developed by Patrick Meade and Lisa Randall [18], the authors argue that thermal black holes with semi- classical behavior are highly suppressed. If produced, the rapid fall of the total production cross section would cause most of these Quantum Black Holes (QBH’s) to appear near their production threshold (assumed to be the reduced Planck Mass, MD), and to decay with a spherical distribution to few-particle states, such as dijets. With these properties, they would be favored to appear in compositeness searches.
In the present analysis this model is used as a generic template of non-resonant new physics resulting in dijet final states, and treated as an addition to QCD jet production.
The Monte Carlo Generator Charybdis2 [19] has been used to simulate these dijet-like quantum grav- itational signatures. The expectation is an enhancement of the 2→Xcross section at the reduced Planck Scale MD. For parton center of mass energies √
ˆ
s= MBH > MD, Charybdis2 uses the geometrical cross section σ = πR2S, whereRS is the higher dimensional Schwarzschild Radius. Charybdis2 is interfaced with Pythia for hadronization and particle decays, and the ATLAS offline framework (Athena) is used for simulation and reconstruction of events. To simulate a complete set of jet observables, the signal samples are added to QCD jet production samples, and the PDF uncertainties on the combined sample are considered to be comparable to pure QCD.
7.4 Signal Template from QBH
The parameters of the phenomenological QBH model mainly influence the production cross-section and threshold, while the impact on the angular distribution of resulting dijet events can be neglected.
Combined with the use of the relative cross section, θ, Monte Carlo samples of QBHs can be used as
2|
1-y
= e|y
χ
5 10 15 20 25 30
χ/dσ)dσ(1/
0.00 0.02 0.04 0.06 0.08 0.10 0.12 0.14 0.16 0.18 0.20
QCD = 0.05 θ
= 0.10 θ
= 0.30 θ
= 0.50 θ ATLAS Preliminary
=7 TeV s MC
(a) χ distributions for dijet invariant mass 520<Mj j<680, QCD and example values ofθ.
Dijet Invariant Mass (GeV) 200 250 300 350 400 450 500 550
-Ratioη
0.0 0.5 1.0 1.5 2.0 2.5
QCD = 0.05 θ
= 0.10 θ
= 0.30 θ
= 0.50 θ
ATLASPreliminary
=7 TeV s MC
(b)ηratio distributions.
Figure 4: Comparison of Monte Carlo predictions for QCD and example hypotheses of physics beyond the Standard Model (QBH signal template with a production threshold of 600 GeV), for χspectra (a) andη-ratios (b).
signal templates for a class of new physics processes. The defining characteristics of this class are an approximately isotropic angular distribution of jets, and a non-resonant distribution of signal events.
This second criterion ensures that the uncertainty on the acceptance resulting from the jet energy scale uncertainty is negligible; in contrast to narrow resonances, which could move out of the studied range due to the energy scale.
Figure 4(a) showsχspectra resulting from the signal template for choices ofθ between 0 and 0.5, and establishes that theχvariable can be a sensitive indicator of new physics. Exotic physics signals can produce an excess of events in the low-χbins when the dijet invariant mass is high.
Figure 4(b) illustrates that the ηratio as a function of dijet invariant mass can also be a powerful discriminant, since this ratio will show a significant increase over QCD for large Mj j. These ratios also provide supplemental information on exotic signals from the point of rise in Mj j, and from the shape of the rise.
8 Limits on Exotic Signals
In this section we introduce the statistical methods used withχspectra to calculate limits on parameters of physics models under study. The starting point is to find the ‘likelihood’ for each physical model under consideration.
8.1 Statistical Methods
As discussed in Section 5, the overall systematic errors in the present analysis are determined via the method of pseudo-experiments to convolve the jet energy scale (JES, j) uncertainty for the spectra under study with the Parton distribution functions (PDF, p).
The pseudo-experiments method is used again, to convolve the uncertainties associated with each physical model. The likelihood, for each physical model and choice of values, is the probability to
observe some data spectrum, given the model hypothesis. For each physical model, the calculation may be performed repeatedly for different choices of model parameter settings, to determine the likelihood of each.
In order to suppress components of systematic uncertainties affecting the absolute cross section only, the choice has been made to normalize theoretical spectra and data to the same number of events, or
‘area’. In the following we refer to this data representation as ‘normalized’ spectra, and hypothesis testing reduces to a spectrum shape comparison.
In a givenbinof the studied distribution for a given value ofθ, pseudo-experiment (j,p,l), wherelis the integrated luminosity, we will use the following number of events:
Nnorm(θ,bin, j,p) =dtot× N(θ,bin, j,p,l) PNbin
bin=1N(θ,bin, j,p,l) (7)
so thatldrops out. This also significantly reduces the effects of other systematic uncertainties.
The probability, P, to measuredbin events in the data, when we expect Nnormis calculated with the Poisson distribution. The likelihood, L(d~|θ, j,p), to measure thed~= (d1, . . . ,dbinmax) events in the data inbinmax,1 ≤ binmax ≤ Nbin,bins of the studied spectrum, given theθ, is equal to the product of the probabilities for the individual bins. Using the law of total probability, the dependence of the likelihood on the indices of the pseudo-experiments is marginalized by summing over all the pseudo-experiments.
The final likelihood is then:
L(d~|θ)=
NJES
X
j=1 NPDF
X
p=1 binmax
Y
bin=1
Poisson(dbin,Nnorm(θ,bin,j,p)). (8)
Bayesian Method Bayes’ theorem is used in order to calculate limits on theθparameter of the studied physics model. It can be written as
P(θ|d)~ ∝ L(d~|θ)P(θ), (9)
where the likelihood L(d~|θ) was obtained in Section 8.1, P(θ|d) is the~ posterior probability and P(theta) is thepriorprobability. The prior is a subjective probability that the theory (any hypothesis) is true and is physics model dependent.
The following prior was used in this study: Pprior(θ) =c
The posterior is used to set the lower limitθlimon the value of the parameterθfor a given confidence levelC.L.as follows:
Z θlim
0
P(θ|d)dθ~ =C.L.. (10)
Frequentist Method In addition to the Bayesian approach, a Frequentist method was employed to cross-check the resulting limits. A simple ratioRof events in theχ-spectra was used as the observable.
For a distinct hypothesis of the relative cross-section θ one-sided 95% confidence intervals for R are constructed. A limit on θ results using Neyman’s construction. All hypotheses where the value of R observed in data is not within the respective confidence interval are excluded.
8.2 Discussion of Results
Bayesian and Frequentist approaches were used to compare the given hypotheses of new physics to the data observed in √
s=7 TeV proton-proton collisions. Table 1 summarizes the obtained limits using the quark contact term (QCT) model described in Section 7.1.
4] [1/TeV Λ4
1/
0 0.5 1 1.5 2 2.5 3
Posterior pdf
0 0.005 0.01 0.015 0.02 0.025 0.03 0.035 0.04
= 7 TeV s dt=61nb-1
∫
LATLAS Preliminary
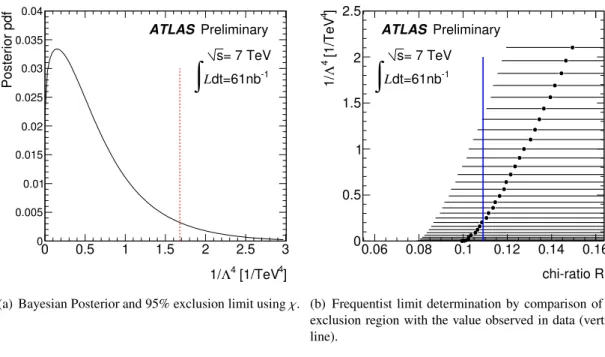
(a) Bayesian Posterior and 95% exclusion limit usingχ.
chi-ratio R 0.06 0.08 0.1 0.12 0.14 0.16 ]4 [1/TeV4 Λ1/
0 0.5 1 1.5 2 2.5
= 7 TeV s dt=61nb-1
∫
LATLAS Preliminary
(b) Frequentist limit determination by comparison of the exclusion region with the value observed in data (vertical line).
Figure 5: Limits onΛresulting from analysis of potential signal in 7 TeV collision data.
χ-spectrum η-ratio Bayes. Frequ. Bayes.
Λ[GeV] 875 930 760
Table 1: Bayesian and Frequentist limits onΛusing theχ-spectrum andη-ratio, at 95% confidence.
Inχ spectra using Bayesian statistics, the compositeness scale factor Λ can be constrained to be greater than 875 GeV, using events with a dijet mass between 520 and 680 GeV. This limit is given at a 95% confidence level.
These limits are close to the measured range of dijet mass, so that the applicability of the contact interaction approach is not guaranteed, as discussed in Section 7.1. The results are thus considered to be benchmark limits quantifying the agreement between data and the QCD prediction, and demonstrating the current sensitivity of ATLAS - and not physics limits on a model of quark compositeness.
χ-spectrum η-ratio
MD[GeV] Bayes. Frequ. QBH, n=6 Bayes. QBH, n=6
600 8.0% 8.9% 109% 1.6% 17%
800 8.1% 9.6% 13% 0.8% 7%
Table 2: Frequentist and Bayesian limits onθusing theχ-spectrum andη-ratio, at 95% confidence level.
For illustration, and to allow comparison of chi andη-ratio results, an expectedθfor a specific model of QBH production is included.
Table 2 summarizes the limits obtained onθ for the generic signal template, together with the ex- pectedθ-values for illustration, using one specific model of QBH production given in Section 7.3.
Inχspectra using Bayesian statistics, the relative cross-section of considered non-resonant physics beyond the Standard Model can be constrained to be less than 8% at a 95% confidence level, for events with a dijet mass between 520 and 680 GeV and independent of the production threshold MD of the signal template.
Limits onθresulting from theηratio cannot be directly compared to the limits obtained from theχ spectrum, due to a different signal and background acceptance. But considering a specific theory, limits on model parameters can be obtained and compared. Using the model of pure dijet QBH production with 6 extra dimensions the naive option of a geometrical cross-section is excluded for both production thresholds and observables with 95% confidence.
9 Summary
Early results from a detector level measurement of dijet angular distributions in ATLAS from √ s = 7 TeV proton-proton collisions at the LHC were presented; both forχspectra, binned in dijet mass Mj j, and for η ratios as a function of Mj j. After discussing the specifics of ATLAS detector capabilities, data reconstruction, triggers, the data stream, event selection, and data analysis, the final spectra were compared to a QCD prediction including detector simulation. For both angular observables, in the data collected from March to July 2010, there is no evidence for a deviation from QCD and the Standard Model. A search for quark contact interactions showed that they are excluded below a compositeness scale of Λ =875 GeV, corresponding to a distance scale of 2.3×10⁻⁴ fm, based on analysis of the χ spectra. Consequently, generic limits were set on the potential fraction of signal events with an isotropic angular distribution in the χspectrum for dijet masses between 520 and 680 GeV. Using a model of non-resonant new physics as a signal template, the ratio of potential signal over QCD background was constrained to be less than 8% at the 95% confidence limit.
References
[1] UA1 Collaboration: G. Arnisonet al.Angular distributions for high-mass jet pairs and a limit on the energy scale of compositeness for quarks from the cern pp collider. Physics Letters B, 177(2):244 – 250, 1986.
[2] UA2 Collaboration: P. Bagnaiaet al. Measurement of jet production properties at the cern collider.
Physics Letters B, 144(3-4):283 – 290, 1984.
[3] CDF Collaboration. Measurement of Dijet Angular Distributions by the Collider Detector at Fer- milab. Phys. Rev. Lett., 77:5336–5341, 1996.
[4] D0 Collaboration. Measurement of Dijet Angular distributions at √s=1.96 TeV and Searches for Quark Compositeness and Extra Spatial Dimensions. Physical Review Letters, 103:191803, 2009.
[5] G. Aad et al. The ATLAS Collaboration. The ATLAS Experiment at the CERN Large Hadron Collider. JINST, 3:S08003, 2008.
[6] The ATLAS Collaboration. Observation of Energetic Jets in pp Collisions at √
s=7 TeV using the ATLAS Experiment at the LHC.ATLAS-CONF-2010-043.
[7] Cacciari, M. and Salam, G. P., and Soyez, G. The anti-kt jet clustering algorithm. Journal of High Energy Physics, 2008, 2008.
[8] JETM Jet/Etmiss. Jet energy resolution and selection efficiency relative to track jets from in-situ techniques with the ATLAS detector using proton-proton collisions at a center of mass energy
√(s)=7 TeV.
[9] T. Sjöstrand, S. Mrenna, and P. Skands. PYTHIA 6.4 Physics and Manual. JHEP, 0605:026, 2006.
[10] The ATLAS Collaboration. ATLAS Monte Carlo Tunes for MC09. ATL-PHYS-PUB-2010-002, 2010.
[11] S. Agostinelli et al. Geant4 - a simulation toolkit. Nuclear Instruments and Methods in Physics Research A, 506:250–303, 2003.
[12] G. Aad et al. The ATLAS Collaboration. The ATLAS Simulation Infrastructure.
arXiv:1005.4568v1, 25 May, 2010.
[13] The ATLAS Collaboration. Data-Quality Requirements and Event Cleaning for Jets and Miss- ing Transverse Energy Reconstruction with the ATLAS Detector in Proton-Proton Collisions at a Center-of-Mass Energy of √
s=7 TeV. ATLAS-CONF-2010-038.
[14] JETM Jet/Etmiss. Jet energy scale and its systematic uncertainty for jets produced in proton-proton collisions at √
(s)=7 TeV and measured with the ATLAS detector.
[15] P. M. Nadolsky, H. L. Lai, Q.-H. Cao, J. Huston, J. Pumplin, D. Stump, W. K. Tung, and C. P. Yuan.
Implications of CTEQ global analysis for collider observables. Phys. Rev., D78:013004, 2008.
[16] W.J. Stirling J.M. Campbell, J.W. Huston. Hard interactions of quarks and gluons: a primer for LHC physics. Rep. Prog. Phys., 70(1):089, 2007.
[17] E. Eichten et al. Phys. Rev. Lett., 50:811–814, 1983.
[18] L. Randall P. Meade. Black Holes and Quantum Gravity at the LHC. JHEP05, 2008:003, 2008.
[19] C. M. Harris, P. Richardson, and B. R. Webber. CHARYBDIS: A Black Hole Event Generator.
JHEP, 0308:033, 2003.