A TLAS-CONF-2010-045 13 July 2010
ATLAS NOTE
ATLAS-CONF-2010-045
June 10, 2010
First observation of the J /ψ → µ + µ − resonance in ATLAS pp collisions at
√ s = 7 TeV
The ATLAS Collaboration
Abstract
The first J/ψ → µ
+µ
−observation using the ATLAS detector, in 7 TeV proton-proton
collisions at the LHC, is reported for an integrated luminosity of approximately 6.4 nb
−1.
The reconstructed invariant mass agrees with the PDG value within statistical uncertainties,
and the peak width is compatible with Monte Carlo expectations. The kinematic properties
of the J/ψ candidates are presented and compared with Monte Carlo data. The muon trigger
and reconstruction efficiencies in this very low transverse momentum region are studied
using the J/ψ candidates.
1 Introduction
Study of the J/ψ resonance with early Large Hadron Collider (LHC) [1] data is one of the first goals of the ATLAS [2] physics programme. Measuring the J/ψ and Υ production cross-sections at the LHC will provide sensitive tests of QCD predictions. Measuring the J/ψ production and properties in ATLAS is a crucial step both for understanding the detector performance and for performing measurements of various B-physics channels. The J/ψ resonance provides an excellent testing ground for studies of muon trigger and identification efficiencies, as well as momentum scale and resolution of muons with transverse momentum below 20 GeV (the “low p
T” region).
In this note we present the first studies on the J/ψ resonance of the di-muon decay channel with the ATLAS detector using data collected in √
s = 7 TeV proton-proton collisions at the LHC between the end of March and mid May 2010, corresponding to an integrated luminosity of approximately 6.4 nb
−1. Section 2 gives a brief overview of the ATLAS detector and trigger used for the current analysis and section 3 describes the data and Monte Carlo samples used. Section 4 describes the event and J/ψ candidate selection and section 5 presents results on the invariant mass determination, width and yields of the J/ψ candidates, studied in both the central and endcap regions of the detector. It also describes both the kinematic properties of the J/ψ candidates as well as the kinematic distributions and efficiencies of the muons coming from the decays. Comparisons with Monte Carlo predictions are performed using P 6 [3]. Finally, sections 6 and 7 discuss first studies of muon trigger for the J/ψ candidates and summarize the results.
2 The ATLAS detector
The ATLAS detector is designed to fully exploit the discovery potential of the LHC. It covers almost the full solid angle around the collision point with layers of tracking detectors, calorimeters and muon chambers. For the measurements presented in this paper the trigger system, the Inner Detector tracking devices (ID) and the Muon Spectrometer (MS) are of particular importance.
The ATLAS Inner Detector has full coverage in φ and covers the range | η | < 2.5. It consists of a silicon Pixel detector (Pixel), a silicon strip detector (SCT) and a Transition Radiation Tracker (TRT).
These detectors cover a sensitive radial distance from the interaction point of 50.5 mm up to 1066 mm and are immersed in a 2 Tesla axial magnetic field. The Inner Detector barrel (end-cap) parts consist of 3 (2x3) Pixel layers, 4 (2x9) layers of double-sided silicon strip modules, and 73 (2x160) layers of TRT straws.
The ATLAS Muon Spectrometer [4] designed to detect tracks over a large region of | η | <2.7, consists of a large toroidal magnet (with an average magnetic field of 0.5 Tesla) and four detectors, each using a different technology. It has one Barrel Region (BR; | η | < 1.05) and two End-cap Regions (ER; 1.05 <
| η | < 2.7). Monitored Drift Tube chambers (MDT) in both the BR and ER sections and Cathode Strip Chambers (CSC) are used as precision chambers, whereas Resistive Plate Chambers (RPC) in the BR and Thin Gap Chambers (TGC) in the ER are used as trigger chambers. The chambers are arranged in three layers, so high-p
Tparticles traverse at least three stations with a lever arm of several metres.
The ATLAS detector has a three-level trigger system: Level 1 (L1), Level 2 (L2), and the Event Filter (EF). For these measurements, the trigger relies on the Minimum Bias Trigger Scintillators (MBTS).
The MBTS are mounted at each end of the detector in front of the Liquid Argon Endcap-Calorimeter
cryostats at z= ± 3.56m and are segmented into eight sectors in azimuth and two rings in (2.09 < | η | <2.82
and 2.82 < | η | <3.84). The MBTS trigger is configured to require two hits above threshold from either
sides of the detector. A dedicated muon software trigger commissioning chain at the EF level is required
to confirm the candidate events chosen for these measurements. This is initiated by the MBTS L1 trigger
and searches for the presence of at least one muon track in the entire Muon Spectrometer (the full scan
procedure). The efficiency of this muon commissioning software trigger with respect to the MBTS L1 trigger for the J/ψ candidates is discussed in the note.
The ATLAS coordinate system is described in the reference [4].
2.1 Muon Identification and Reconstruction
Muon identification and reconstruction extends to | η | < 2.7, covering a p
Trange from 1 GeV to around 1 TeV. In the muon reconstruction algorithms three categories of muons are foreseen:
• Muons from standalone reconstruction: the standalone muon reconstruction is entirely based on the tracks reconstructed in the Muon Spectrometer (MS). The track parameters are obtained from the MS track and are extrapolated to the interaction point, taking into account multiple scattering and energy loss in the traversed material. The standalone reconstruction covers | η | < 2.7.
• Muons from combined reconstruction: the combined muon reconstruction relies on a statistical combination of track parameters and the covariance matrices of both a standalone MS track and an ID track, selecting the tracks to be paired on the basis of tight matching criteria to create a combined muon track traversing the ID and MS. Due to ID coverage, the combined reconstruction covers | η | < 2.5.
• Muons from ID track tagging: a tagged muon is formed by segments which are not associated with an MS track, but which are matched to ID tracks extrapolated to the MS. Such a reconstructed muon adopts the measured parameters of the associated ID track. The muon tagging covers | η | < 2 only.
In the current analysis, only combined and tagged muons are used; muon pairs are required to consist of at least one combined muon, whereas the second is allowed to be of either type. For the evaluation of the mass, the parameters of the ID tracks associated with the muons are used, since the muon spectrometer measures the muon momenta after they have passed through the calorimetry.
3 Data and Monte Carlo samples
3.1 Dataset and luminosity
Collision data with a centre-of-mass energy of 7 TeV, taken between March 30th and May 17th 2010, are included in this analysis. Segments of data known as luminosity blocks within those runs are included if they are taken in a period where the LHC operators had declared the beams to be stable. Additionally, data is only included if it is deemed to be suitable for physics analysis, on the basis of the status of the muon spectrometer, inner detector and magnet systems. Events within those luminosity blocks are required to have passed the L1 and EF triggers, as described in section 2. Taking into account the luminosity block selection, the total integrated luminosity for the sample is calculated to be (6.4 ± 1.3) nb
−1.
3.2 Monte Carlo samples used
Monte Carlo comparisons are made using two samples (for background and signal contributions) gen- erated with P 6 [3], tuned using the ATLAS MC09 tune [5] and MRST LO
⋆[6] parton distribution functions. For the J/ψ signal Monte Carlo, we use P ’s implementation of prompt J/ψ production subprocesses in the NRQCD Colour Octet Mechanism framework, tuned to describe Tevatron results [7].
For a description of the continuum background we use P ’s minimum-bias process, which includes
all basic parton-parton scattering subprocesses. In order to avoid any double-counting the untuned, older model of prompt J/ψ production (native to the minimum-bias sub-processes in Pythia), was explicitly removed from the minimum bias sample. The events were simulated with G 4 [8] and fully re- constructed with the same software that was used to process the data from the detector. Background contributions are expected to primarily come from heavy flavour decays, muons from pion and kaon in-flight decays, fakes from misidentification of hadrons as muons, and Drell-Yan production.
The samples were generated without polar or azimuthal anisotropy in the decay of the J/ψ (the default in P ), and no attempt is made to account for spin-alignment effects at this time.
Low p
TJ/ψ are dominated by prompt production, so any contributions of the b → J/ψ indirect production processes are unimportant for the distributions studied at this stage. The direct J/ψ MC samples are used to compare the shape of the reconstructed invariant mass and resolution with the data.
In this case, the MC is normalised to the number of signal events observed. However, in order to compare the shape of the kinematic variables of the J/ψ candidates in the data to MC, a mixture of the two MC components are used. As neither the J/ψ or continuum cross-sections have yet been measured by ATLAS and as we are concerned in this note with studies of distribution shapes, we allow the signal and background MC contributions to float relative to each other, the exact normalisations being determined from a fit to data. It should be noted that the available statistics of the minimum bias MC is only 0.4 nb
−1; this causes large fluctuations in the shape comparisons of data with MC.
4 Event and candidate selection
The data used in this analysis was taken during a period of LHC commissioning, where the beam bunches were being squeezed, and consequently the instantaneous luminosity was rising from run to run. Two separate data streams are therefore employed. Events were written into the first stream if they passed the L1 minimum bias trigger. This trigger was not prescaled for runs taken when the instantaneous luminos- ity was below 10
28cm
−2s
−1. For runs taken at and above this luminosity, this trigger was prescaled.
Events written into the second stream were selected by the same minimum bias trigger, but were also subject to the EF trigger, which required at least one muon to pass the EF muon commissioning chain with a muon of any p
Treconstructed in the MS. This additional selection allowed the minimum bias trigger to feed the stream without a prescale being applied, since the higher level trigger removed many events.
To allow the analysis to use data written by an unprescaled minimum bias trigger at all luminosi- ties, events are processed from the first stream up until the point at which the luminosity rose above 10
28cm
−2s
−1. Beyond this point the analysis switches to the second stream. For both streams, however, events are only processed which passed the full event filter selection. In the case of the first stream this trigger was not vetoing events but was just recording its decision (in other words, acting in pass-through or passive mode) but the recorded decision allows events which would not have passed it to be rejected in the offline analysis. In this way the whole analysis is done on a consistent trigger selection, and all processed events were written by an unprescaled level 1 trigger.
To ensure that collision events are selected, events passing the trigger selection are required to have at least three tracks associated with the same reconstructed primary vertex. The three tracks are required to have at least one hit in the pixel system and at least six hits in the SCT. No p
Tcut is applied to these tracks, apart from a cut of p
T> 0.5 GeV which is applied automatically to all inner detector tracks by the reconstruction software when running with the standard settings.
In each surviving event, pairs of reconstructed muons are sought. Only muons associated with ID
tracks that have at least one hit in the pixels and six in the SCT are accepted. No p
Tcut is applied to
these tracks, apart from the default cut of p
T> 0.5 GeV described above. At least one of the muons
in each pair is required to be combined, as described in Section 2.1. The contamination from cosmic
ray background may come from a pair formed by a cosmic muon and a muon from the collision. This probability is estimated to be very small ( < 10
−4) from the 900 GeV data analysis [9]. A cosmic muon mimicking a J/ψ decaying back-to-back is excluded because muons detected in the MS can only have momentum higher than 3 GeV.
The two inner detector tracks from each pair of muons passing these selections are fitted to a com- mon vertex using the ATLAS offline vertexing tools based on the Kalman filtering method [10]. No constraints on mass or pointing to the primary vertex are applied to the fit, and a very high vertex fit χ
2upper limit is applied (χ
2< 200). Those pairs which successfully form a vertex are regarded as J/ψ → µµ candidates. No momenta or η cuts are applied to the candidates. Muon pairs whose tracks are assigned the same charge are retained for the purpose of cross-checking. Cuts in this analysis are not optimized to reject backgrounds, since the aim of this study is to understand the shape of the low p
Tcombinatorial background.
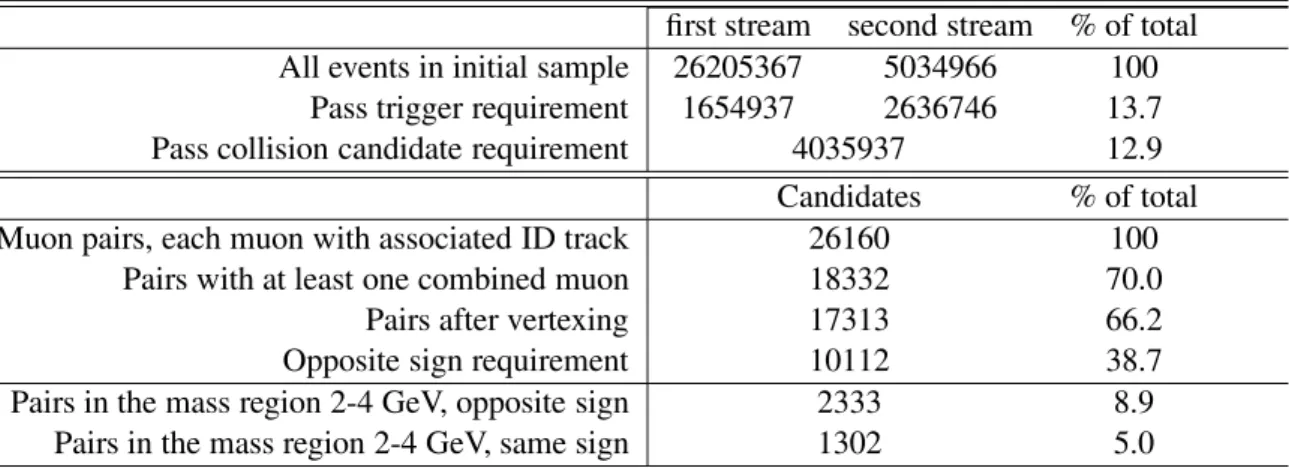
Table 1 lists the surviving events and candidates after each of the selections described above.
Table 1: Event and J/ψ candidate selections
first stream second stream % of total All events in initial sample 26205367 5034966 100
Pass trigger requirement 1654937 2636746 13.7 Pass collision candidate requirement 4035937 12.9
Candidates % of total Muon pairs, each muon with associated ID track 26160 100
Pairs with at least one combined muon 18332 70.0
Pairs after vertexing 17313 66.2
Opposite sign requirement 10112 38.7
Pairs in the mass region 2-4 GeV, opposite sign 2333 8.9
Pairs in the mass region 2-4 GeV, same sign 1302 5.0
5 Physics and performance properties of the J /ψ → µ + µ − signal
5.1 Reconstruction and fit of J /ψ mass signal
Invariant mass distributions are studied for the muon pairs described in Section 3. In all cases ID track parameters are used to calculate the properties of the J/ψ candidates. Once the vertex fit is applied, the refitted track parameters and error matrices are used to calculate the invariant mass and per-candidate mass error. About 1% of the events contained two J/ψ candidates (from three or more muons); no events are found with more than two candidates.
In order to investigate further the measured properties of J/ψ candidates found in different regions of the detector, the candidates are divided into three categories:
• both muons in the barrel detector (BB)
• one muon in the barrel and one in the endcap (EB)
• both muons in the endcap (EE)
An unbinned maximum-likelihood fit is used to extract the J/ψ mass and the number of J/ψ signal candidates from the data. The likelihood function is defined by:
L =
N
Y
i=1
"
f
signal(m
iµµ) + f
bkg(m
iµµ)
#
(1) where N is the total number of pairs of oppositely charged muons in the invariant mass range 2 < m
µµ< 4 GeV. The f
signaland f
bkgare probability density functions that model the J/ψ signal and background mass shapes in this range and a
0is the fraction of pairs originating from J/ψ decay. For the signal, the mass is modeled with a Gaussian distribution:
f
signal(m
µµ, δm
µµ) ≡ a
0√ 1
2π S δm
µµe
−(mµµ−mJ/ψ)2
2(Sδmµµ)2
(2)
whose mean value m
J/ψis the J/ψ mass and its width is a product S δm
µµ, where the scale factor S is a parameter of the fit and δm
µµis the measured mass error calculated for each muon pair from the covariance matrix of the vertex finding. For the fits made before vertexing the per-candidate error is calculated from the covariance matrices of the original track parameters. For the background, the mass distribution is assumed to follow a flat function:
f
bkg(m
µµ) ≡ (1 − a
0) (3)
The fit returns values of the free parameters a
0, m
J/ψand S and a covariance matrix of the fit. They are used to calculate other characteristics of the data. The number of J/ψ signal decays N
sigand its uncertainty is calculated from a
0and its uncertainty, and the total number of pairs N. The mass resolution σ
mis calculated by summing the result of the function f
signal(m
µµ, δm
µµ) over all candidates; σ
mdefines the region of the distribution for which the integral of sum over f
signal(m
µµ, δm
µµ) retains 68.27% of N
sig. The uncertainty on σ
mis calculated using the covariance matrices of the fitted vertices. Number of background events N
bckin the mass interval m
J/ψ± 3σ
mand its error are calculated from a
0, N and the uncertainties of a
0, m
J/ψand σ
m. The same fit procedure is applied to the prompt J/ψ MC events, in this case f
bkg(m
µµ) ≡ 0.
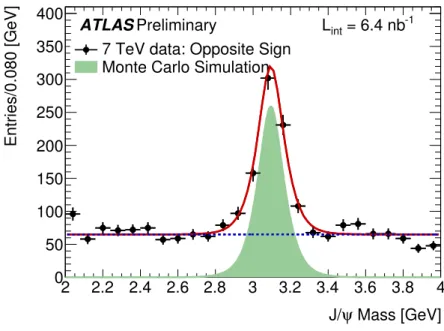
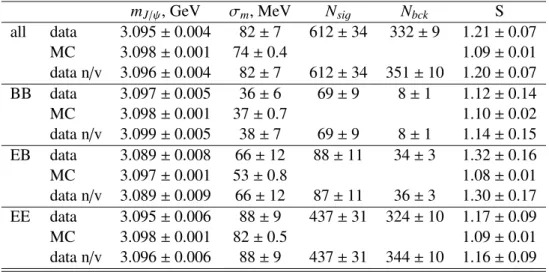
In Figure 1 the invariant mass for all oppositely charged muon pairs passing vertexing is shown. The fit results from data and MC, both with and without the application of vertexing on the di-muons are summarised in Table 2. No systematic errors are considered in the current study. The J/ψ mass returned by the fit is 3.095 GeV with an error of 0.004 GeV. The number of J/ψ signal decays is N
sig= 612 ± 34, the mass resolution of J/ψ signal is σ
m= 82 ± 7 MeV and the number of background pairs in the mass range corresponding to m
J/ψ± 3σ
mis N
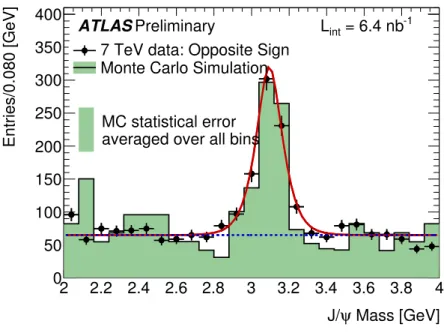
bck= 332 ± 9. In the same figure, the fit function to the prompt J/ψ MC samples, normalised to the number of signal events observed, is also shown. In Figure 2, the same data points are shown and the shape of the distribution is compared to the complete MC sample (prompt J/ψ and minimum bias) as described in Section 3.
In Table 2 it is seen that the vertexing has no statistically significant effect on the mass resolution and mean position, while the background is reduced slightly (about 6%). Larger background rejection from vertexing is expected if there is a significant contribution from leptons originating from semileptonic decays of heavy flavour, B and D mesons [11].
Figure 3 shows the invariant mass distribution of the opposite sign pairs after vertexing, with the
same sign superimposed. The same sign pairs contribution in the J/ψ signal region is lower than the
background from opposite sign pairs, as expected. The small excess in the background contribution from
opposite sign pairs is in agreement with the expected contribution of muons from B and D meson decays
in the current data.
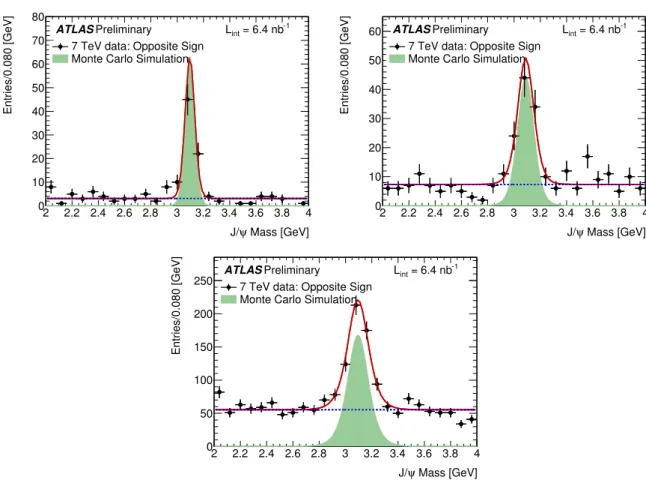
The invariant mass resolution depends on the pseudorapidities of the two muon tracks. To illustrate this effect all accepted J/ψ candidates are divided into the three classes as described above, and the same mass fit is performed on each. Figure 4 shows the distributions for oppositely charged pairs after vertexing for the three categories (BB), (EB) and (EE); MC is also superimposed. The results of these individual fits are summarised in Table 2. As expected, due to material effects, the mass width when both muons are in the endcap region is ∼ 2.5 times greater than when both muons are in the barrel. This behavior is also well reproduced in the MC. The values of the scale factor S vary between 1.12 in barrel and 1.30 for the EB case, nevertheless all S values are consistent with 1 within statistical errors of the current data. S values larger than 1 indicate that the errors on tracks and on vertexing are underestimated.
Mass [GeV]
ψ J/
2 2.2 2.4 2.6 2.8 3 3.2 3.4 3.6 3.8 4
Entries/0.080 [GeV]
0 50 100 150 200 250 300 350 400
7 TeV data: Opposite Sign Monte Carlo Simulation
ATLAS Preliminary L
int= 6.4 nb
-1Figure 1: Invariant mass distribution of reconstructed J/ψ → µ
+µ
−candidates. The points with error bars are data. The solid line is the result of maximum likelihood unbinned fit to all di-muon pairs in the mass window 2–4 GeV and the dashed line is the result for the background of the same fit. The result of the fit to the prompt J/ψ MC is represented by solid area.
5.2 Kinematic distributions of the J/ψ candidates
The current analysis has access to very low p
TJ/ψ candidates producing soft p
Tmuon tracks, which are nevertheless detected in the MS. Muons with enough energy to cross the calorimeters reach the MS mainly in the forward region (where p >> p
T). As a consequence, the J/ψ candidates in this momentum regime have preferentially high rapidity.
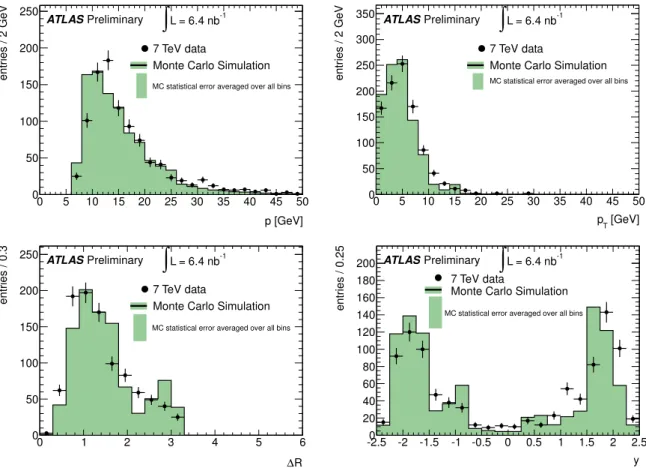
The kinematic properties of the event candidates in the J/ψ mass region 2.86 GeV - 3.34 GeV are
shown in Figure 5. A comparison with MC (for both prompt J/ψ and minimum bias simulation) is also
shown in the same figure. As can be seen it is possible to access the lowest possible J/ψ p
Twhich in
turn is a result of the muon acceptance of the ATLAS detector without any threshold requirement on the
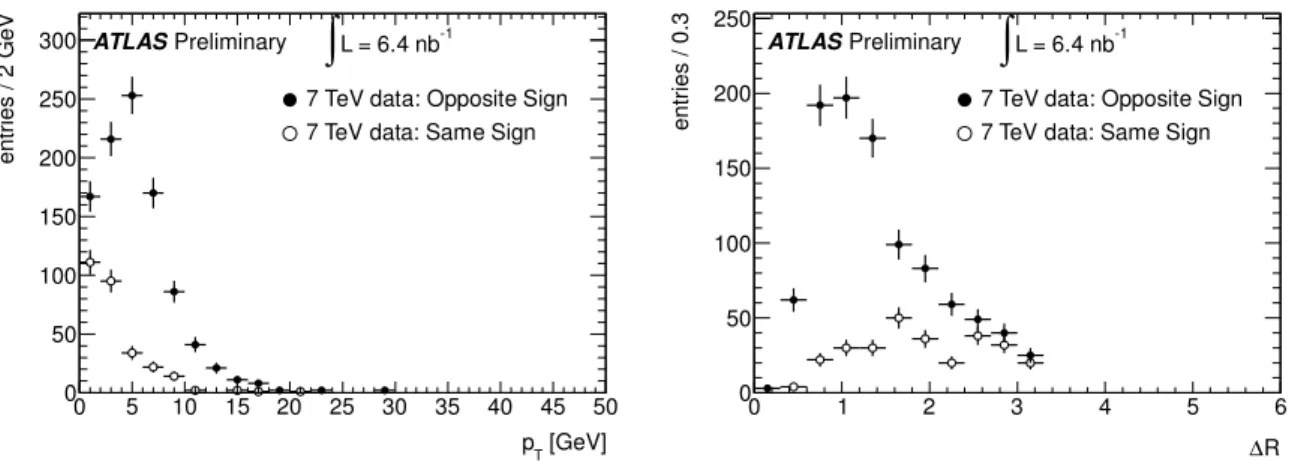
muon trigger. In Figure 6, the kinematic variables ∆R and p
Tare compared to the same-sign di-muon
combinations in the J/ψ mass region.
Mass [GeV]
ψ J/
2 2.2 2.4 2.6 2.8 3 3.2 3.4 3.6 3.8 4
Entries/0.080 [GeV]
0 50 100 150 200 250 300 350 400
7 TeV data: Opposite Sign Monte Carlo Simulation
ATLAS Preliminary L
int= 6.4 nb
-1MC statistical error averaged over all bins
Figure 2: Invariant mass distribution of reconstructed J/ψ → µ
+µ
−candidates. The points with error bars are data. The solid line is the result of maximum likelihood unbinned fit to all di-muon pairs in the mass window 2–4 GeV and the dashed line is the result for the background of the same fit. MC from both prompt J/ψ and minimum bias simulation are superimposed.
Mass [GeV]
J/ψ
2 2.2 2.4 2.6 2.8 3 3.2 3.4 3.6 3.8 4
Entries/0.080 [GeV]
0 50 100 150 200 250 300 350 400
7 TeV data: Opposite Sign 7 TeV data: Same Sign
ATLASPreliminary Lint = 6.4 nb-1
Figure 3: Invariant mass distribution of reconstructed J/ψ → µ
+µ
−candidates after vertexing. Same
sign combinations (open circles) are superimposed.
Mass [GeV]
ψ J/
2 2.2 2.4 2.6 2.8 3 3.2 3.4 3.6 3.8 4
Entries/0.080 [GeV]
0 10 20 30 40 50 60 70 80
7 TeV data: Opposite Sign Monte Carlo Simulation
ATLASPreliminary Lint = 6.4 nb-1
Mass [GeV]
ψ J/
2 2.2 2.4 2.6 2.8 3 3.2 3.4 3.6 3.8 4
Entries/0.080 [GeV]
0 10 20 30 40 50 60
7 TeV data: Opposite Sign Monte Carlo Simulation
ATLASPreliminary Lint = 6.4 nb-1
Mass [GeV]
ψ J/
2 2.2 2.4 2.6 2.8 3 3.2 3.4 3.6 3.8 4
Entries/0.080 [GeV]
0 50 100 150 200
250 7 TeV data: Opposite Sign Monte Carlo Simulation
ATLASPreliminary Lint = 6.4 nb-1
Figure 4: Invariant mass of J/ψ → µ
+µ
−candidates in three muon pseudorapidity categories: both muons in the barrel (top left), one muon in the barrel, second in the endcap (top right), both muons in the endcap (bottom). The solid lines illustrate the results of the unbinned maximum likelihood fit to all di-muon pairs in the mass window 2–4 GeV, the dashed lines are the result for background only in the same fit. The solid area in each case represents the Monte Carlo prediction, from prompt J/ψ only.
5.3 Properties of the muons from the J/ψ candidates
Combined and tagged muons as described in Section 2 are used to form the J/ψ candidates, requiring at least one muon of the pair to be reconstructed as combined. Requiring one combined muon in the pair is also expected to reduce the contribution of combinatorial backgrounds to the J/ψ resonance. The fraction of muon pairs in the reconstructed J/ψ that have two combined muons and those which have one combined and one tagged are shown in Table 3.
Muons with p
T. 3 GeV and as low as 1 GeV are mainly detected in the endcap region of the MS. At the same time most of the J/ψ cross-section produces low p
Tmuons. As a consequence, the observed J/ψ candidates preferentially populate the endcap region as shown in Figure 5 (bottom right).
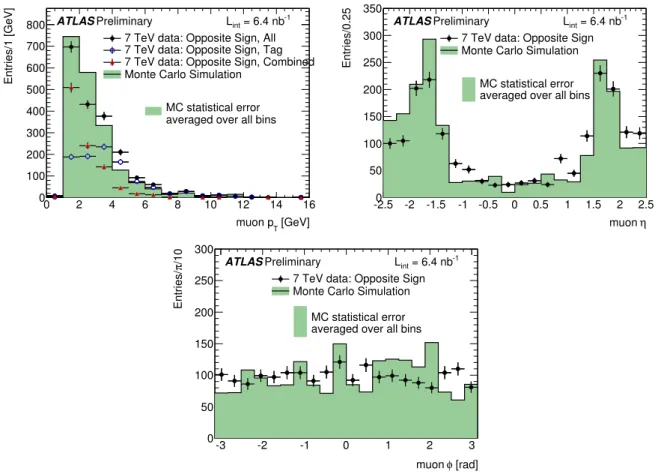
Figure 7 shows the p
T(top left), η (top right) and φ (bottom) distributions of the muons forming
J/ψ candidates, and are compared to direct J/ψ and minimum bias MC. The p
Tdistribution is shown
separately for combined, tagged muons and the sum of both. The distribution in φ is flat and the η dis-
tribution shows that most of the muons are found in the end-cap region, as expected. The p
Tdistribution
has a shoulder around 2.5 GeV, because the plot contains contributions from both combined and tagged
muons. The tagged muons peak at 2 GeV whereas the combined muons peak at almost 3 GeV. Summing
the contributions produces the shoulder, as seen in the data, while in MC it is washed out due to limited
Table 2: Summary of fit results to mass distributions of J/ψ → µ
+µ
−candidates. The number of back- ground events is given in the range m
J/ψ± 3σ
m. The same fit is applied to prompt J/ψ MC data, assuming
f
bkg≡ 0 in the formula 1. Results for data before vertexing are shown for comparison.
m
J/ψ, GeV σ
m, MeV N
sigN
bckS
all data 3.095 ± 0.004 82 ± 7 612 ± 34 332 ± 9 1.21 ± 0.07
MC 3.098 ± 0.001 74 ± 0.4 1.09 ± 0.01
data n/v 3.096 ± 0.004 82 ± 7 612 ± 34 351 ± 10 1.20 ± 0.07 BB data 3.097 ± 0.005 36 ± 6 69 ± 9 8 ± 1 1.12 ± 0.14
MC 3.098 ± 0.001 37 ± 0.7 1.10 ± 0.02
data n/v 3.099 ± 0.005 38 ± 7 69 ± 9 8 ± 1 1.14 ± 0.15 EB data 3.089 ± 0.008 66 ± 12 88 ± 11 34 ± 3 1.32 ± 0.16
MC 3.097 ± 0.001 53 ± 0.8 1.08 ± 0.01
data n/v 3.089 ± 0.009 66 ± 12 87 ± 11 36 ± 3 1.30 ± 0.17 EE data 3.095 ± 0.006 88 ± 9 437 ± 31 324 ± 10 1.17 ± 0.09
MC 3.098 ± 0.001 82 ± 0.5 1.09 ± 0.01
data n/v 3.096 ± 0.006 88 ± 9 437 ± 31 344 ± 10 1.16 ± 0.09
Table 3: The fraction of muon pairs in the reconstructed J/ψ in data and MC combined combined combined tagged
Data (26.4 ± 1.4)% (73.6 ± 1.4)%
MC (31 ± 0.3)% (69 ± 0.3)%
p [GeV]
0 5 10 15 20 25 30 35 40 45 50
entries / 2 GeV
0 50 100 150 200 250
MC statistical error averaged over all bins
ATLASPreliminary
∫
L = 6.4 nb-1 7 TeV dataMonte Carlo Simulation
[GeV]
pT
0 5 10 15 20 25 30 35 40 45 50
entries / 2 GeV
0 50 100 150 200 250 300 350
MC statistical error averaged over all bins
ATLASPreliminary
∫
L = 6.4 nb-1 7 TeV dataMonte Carlo Simulation
∆R
0 1 2 3 4 5 6
entries / 0.3
0 50 100 150 200 250
MC statistical error averaged over all bins
ATLASPreliminary
∫
L = 6.4 nb-1 7 TeV dataMonte Carlo Simulation
y -2.5 -2 -1.5 -1 -0.5 0 0.5 1 1.5 2 2.5
entries / 0.25
0 20 40 60 80 100 120 140 160 180 200
MC statistical error averaged over all bins
ATLASPreliminary
∫
L = 6.4 nb-1 7 TeV dataMonte Carlo Simulation
Figure 5: Momentum (top left), transverse momentum (top right), ∆R distance (bottom left) between the two muons and rapidity (bottom right) distributions of the J/ψ candidates in the mass range m
J/ψ± 3σ
m. On the same plots MC distributions from both prompt J/ψ and minimum bias simulation are superimposed for comparison.
statistics in the background contribution from minimum bias. The effect is well manifested in the direct J/ψ MC.
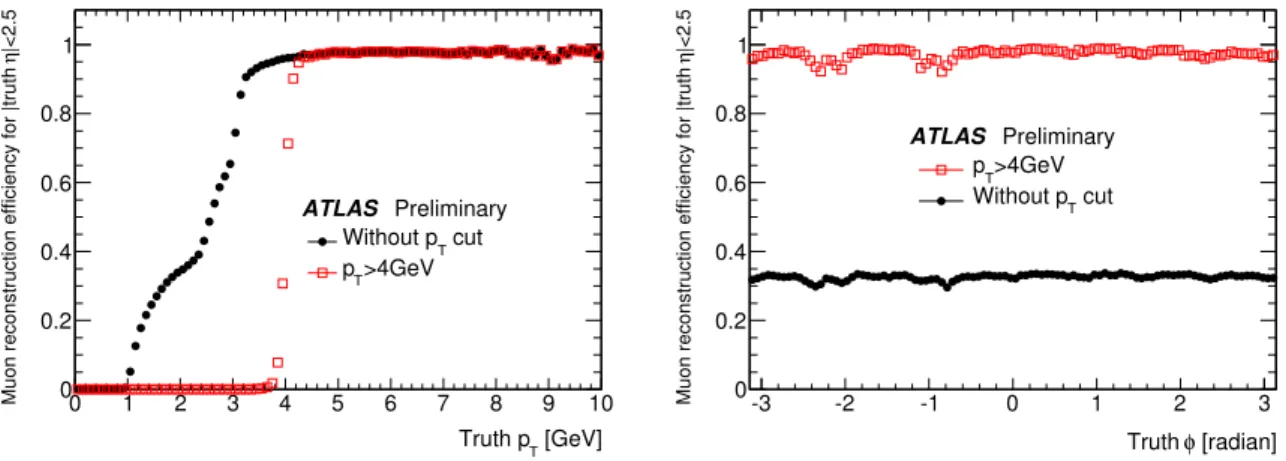
Figure 8 shows the muon reconstruction efficiency as a function of the p
Tand φ using the direct J/ψ MC production sample only. The distributions are compared to the expected efficiencies for muons with p
T> 4 GeV. Muons of both types (combined and tagged) are included in these plots. The distributions for muons with p
T> 4 GeV are as expected [12]. The two small drops in the efficiency distribution as a function of φ (φ ∼ -1 and φ ∼ -2) are due to the feet supporting the toroids, which affects the reconstruction efficiency in this volume.
5.4 Discussion of the results
The J/ψ mass determined from data agrees with the PDG mass within the statistical precision. No statistically significant mass shifts from the PDG value are observed in any of the pseudorapidity regions.
The mass resolution of the J/ψ signal varies with the pseudorapidity of the muons and within statistical
precision the resolutions from data agree with MC expectations as shown in Figure 4. This agreement,
along with the observed consistency of J/ψ kinematic properties between data and MC events in variables
such as momenta, transverse momenta, rapidity and ∆R, are the essential conclusions derived from the
first J/ψ signal studies.
[GeV]
pT
0 5 10 15 20 25 30 35 40 45 50
entries / 2 GeV
0 50 100 150 200 250
300 ATLASPreliminary
∫
L = 6.4 nb-17 TeV data: Opposite Sign 7 TeV data: Same Sign
∆R
0 1 2 3 4 5 6
entries / 0.3
0 50 100 150 200 250
ATLASPreliminary
∫
L = 6.4 nb-17 TeV data: Opposite Sign 7 TeV data: Same Sign
Figure 6: Distributions of transverse momentum (left) and ∆R distance (right) between the two muons of the J/ψ candidates in the mass range m
J/ψ± 3σ
m. On the same plots the same-sign combinations in the same mass region are superimposed.
It should be noted that the minimum bias MC statistics are small in comparison with the data, as it is evident in Figure 5 and 7. This is particularly visible in the p and p
Tdistributions Despite these limited MC statistics, the shapes of the kinematic distributions of the J/ψ candidates are well reproduced by MC. Furthermore the mass distribution of the same sign muon pairs as shown in Figure 3 matches the shape of the background in the side bands of the opposite sign muon pairs, and is smaller overall.
Di-muon pairs of opposite sign in the mass region have different kinematic properties from the same sign pairs, as shown in Figure 6.
The single muon distributions from the observed J/ψ candidates have a p
Tspectrum starting at 1 GeV and are mainly populating the endcap region of the detector. The shape of the turn-on in the efficiency plot as a function of p
Tis a result of the p
Tspectrum shown in Figure 7. With these statistics, the single muon reconstruction efficiency from the J/ψ candidates is estimated with MC only; integrated overall, this efficiency is about 30% for muons in | η | <2.5.
6 Trigger e ffi ciency studies for J/ψ candidates
The data used in this analysis were collected using the minimum bias L1 trigger [9]. This sample is therefore ideal for studying the L1 muon trigger efficiency and the trigger turn-on curves. This is of particular interest as at luminosities above 10
29cm
−2s
−1, the J/ψ candidate selection will be based on the L1 muon trigger.
The ATLAS Level 1 (L1) muon trigger is based on two different trigger chamber technologies: RPCs for the barrel region out to | η | < 1.05 and TGCs for the endcap region from 1.05 < | η | < 2.4 [4]. It looks for hit coincidences within different RPC or TGC detector layers inside programmed geometrical windows which define the muon p
T(L1 trigger roads), then selects muons above six programmable thresholds and provides a rough estimate of their positions, with coordinates η and φ [13].
For this first data period the muon trigger is the loosest possible requiring time coincidence between any two hits in any of the detector layers. This trigger type is the MU0 low p
Twhere no geometrical constraint (no road and then no p
Tselection) is applied.
In this section the efficiency of the muon L1 trigger both in the barrel and endcap regions is studied for the observed J/ψ candidates and compared to the trigger efficiency from inclusive muon production.
The lowest threshold MU0 trigger is checked for all J/ψ candidates by requiring at least one of the
[GeV]
muon pT
0 2 4 6 8 10 12 14 16
Entries/1 [GeV]
0 100 200 300 400 500 600 700 800
MC statistical error averaged over all bins 7 TeV data: Opposite Sign, All 7 TeV data: Opposite Sign, Tag 7 TeV data: Opposite Sign, Combined Monte Carlo Simulation
ATLASPreliminary Lint = 6.4 nb-1
η muon -2.5 -2 -1.5 -1 -0.5 0 0.5 1 1.5 2 2.5
Entries/0.25
0 50 100 150 200 250 300 350
7 TeV data: Opposite Sign Monte Carlo Simulation ATLASPreliminary Lint = 6.4 nb-1
MC statistical error averaged over all bins
[rad]
φ muon
-3 -2 -1 0 1 2 3
/10πEntries/
0 50 100 150 200 250 300
7 TeV data: Opposite Sign Monte Carlo Simulation ATLASPreliminary Lint = 6.4 nb-1
MC statistical error averaged over all bins
Figure 7: Distributions of p
T(top left), η (top right) and φ (bottom) for muons forming the J/ψ candidates for data and MC.
reconstructed muons to match within a cone of ∆R < 0.5 to the L1 MU0 trigger in the RPC or TGC.
The ∆R cut is optimized on MC. This efficiency is shown as a function of the J/ψ p
Tin Figure 9. One observes that using the lowest muon trigger threshold MU0, one has access to J/ψ p
Tas low as 2 GeV.
This is of particular interest for polarisation studies provided the trigger is not prescaled.
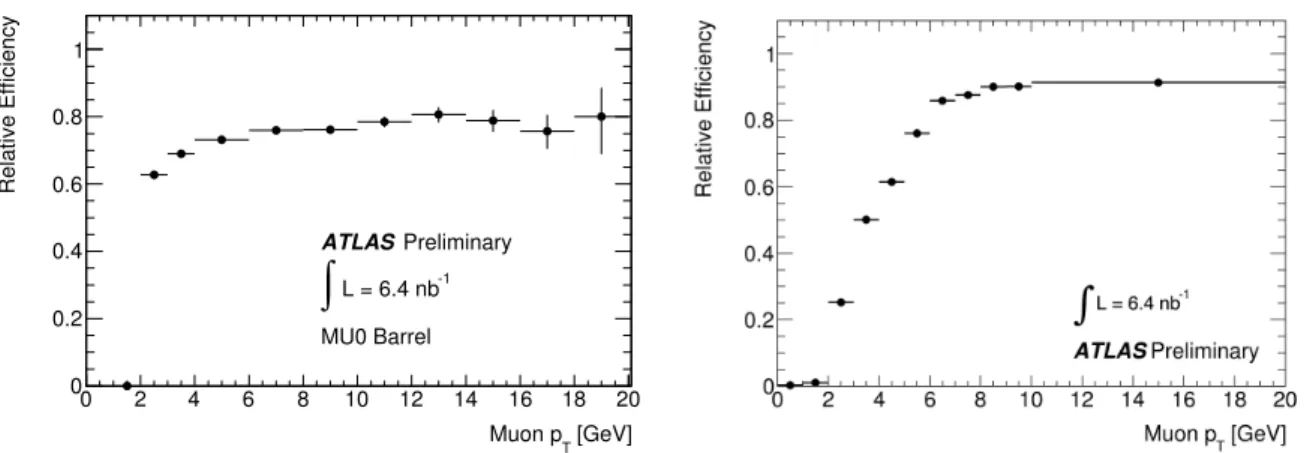
The inclusive L1 muon trigger efficiency of the lowest threshold MU0 is also studied, for the barrel and endcap trigger separately. Collision events containing at least one combined muon of any p
Tare considered. Furthermore, prompt muons are selected by requiring a small difference in p
Tbetween the ID track and the MS track extrapolated to the interaction point. Additionally, it is required that the ID tracks do not feature “kinks” along their length. The efficiency is measured relative to offline combined muons requiring a matching between an η-φ cone “Region of Interest” (RoI) where trigger hits are located, and the offline combined muon. The matching criteria is set to a ∆R(µ
trig, µ
offline) < 0.5.
In particular for the barrel trigger a subset of runs is used, and as the L1 timing was not fully com- missioned at the time the runs were taken, L1 RPC triggers of ± 3 Bunch Crossings (BC) are included.
The observed plateau at 80% is due to the geometrical acceptance of the RPC trigger. The efficiencies
for both barrel and endcap triggers are shown in Figure 10. The plateau and turn-on curves from muons
coming from the J/ψ candidates are reproduced well by the ones shown in Figure 10, but with large
statistical uncertainties. Consequently only the single prompt muon efficiency plots are shown here.
Figure 8: Muon reconstruction efficiency as a function of true muon p
T(left) and φ (right).
[GeV]
pT
ψ J/
0 2 4 6 8 10 12 14 16 18 20 22
Relative Efficiency
0 0.2 0.4 0.6 0.8 1
ATLAS Preliminary = 6.4nb−1
∫
LOpposite Sign MU0 Barrel+Endcaps
Figure 9: L1 muon trigger efficiency for the J/ψ candidates as a function of J/ψ p
T.
7 Summary and conclusions
The decay J/ψ → µµ is observed in ATLAS data using combined information from the muon spectrom-
eter and the inner detector. A clear peak in the data is seen with an integrated luminosity of 6.4 ± 1.3nb
−1.
The peak has been fitted using an unbinned maximum likelihood method; this yields an overall mean of
3.095 ± 0.004 GeV, which is in agreement with the PDG value for the J/ψ mass within statistical uncer-
tainty. This close match is a consequence of the work done with cosmic events and earlier collisions to
attain a good understanding of the ATLAS detector. The signal resolution is 82 ± 7 MeV, in line with
Monte Carlo expectations. The mass resolution varies with the pseudorapidity of the muons, as expected,
and this variation is in agreement with Monte Carlo within statistical uncertainty. The process of finding
the J/ψ → µµ decay vertex, which will be required for all subsequent physics studies on J/ψ, was not
found to affect the measured mass and its resolution beyond statistical uncertainties, as expected. We
conclude by stating that the final number of observed J/ψ → µµ decays was 612 ± 34, over a background
of 332 ± 9 candidates.
[GeV]
Muon pT
0 2 4 6 8 10 12 14 16 18 20
Relative Efficiency
0 0.2 0.4 0.6 0.8 1
ATLASPreliminary L = 6.4 nb-1
∫
MU0 Barrel