ATLAS-CONF-2010-044 13July2010
ATLAS NOTE
ATLAS-CONF-2010-044
June 5, 2010
Observation of W →`ν and Z → `` production in proton-proton collisions at √
s =7 TeV with the ATLAS detector
The ATLAS Collaborationa
aCERN
Abstract
This note describes an observation by the ATLAS experiment of 57 W→`νcandidates and three Z → `` candidates, where ` = e, µ, produced in √
s = 7 TeV proton-proton collisions at the LHC. These results correspond to total integrated luminosities of 6.7 nb−1 for the W →eνand Z→ee channels, and 6.4 nb−1and 7.9 nb−1for the W →µνand Z→µµ channels, respectively. The number of events observed is consistent with the expectations.
1 Introduction
The experimental study of the electroweak gauge bosons has a history of about thirty years. The W and the Z particles were initially discovered and measured at the CERN proton-antiproton collider in 1983 [1, 2, 3, 4]. During the early 1990’s, the Z properties were measured in great detail at the high energy e+e− colliders LEP and SLC [5]. In the second half of that decade, an energy increase of LEP allowed to measure W bosons produced in pairs. The Tevatron proton-antiproton collider has been accumulating W and Z events over the last twenty years. The results of these programmes include high- precision measurements of the W and Z mass, width, and couplings, as well as detailed information on their production in proton-antiproton collisions and corresponding constraints on the proton parton density functions [6]. The current uncertainties on the intrinsic properties of the W boson are about ten times larger than their Z counterparts [7].
The W and Z bosons are expected to be produced abundantly at the Large Hadron Collider (LHC) [8], and for the first time in proton-proton collisions. This significant dataset and the high LHC energy will allow for detailed measurements of their production properties at a previously unexplored energy scale.
These conditions, together with the particular nature of the collisions, will provide new insights on the proton properties, tests of perturbative QCD calculations, and ultimately a precise determination of the mass of the W boson [9]. In this process, the well-known properties of the Z boson will provide sig- nificant constraints on the determination of the performance of the collider experiments at the LHC; its known mass, width and leptonic decays can be exploited to measure precisely the detector energy and momentum scale, resolution, as well as lepton identification and trigger efficiencies.
The critical first step in making such precision measurements is an observation of W and Z produc- tion at the LHC. This note details an observation by the ATLAS [10] experiment of 17 W →eνand 40 W →µνcandidates produced from the √
s=7 TeV proton-proton collisions of the LHC, resulting from total integrated luminosities of 6.7 nb−1 and 6.4 nb−1in the electron and muon channels, respectively.
One Z → ee and two Z → µµ candidates were also observed with data corresponding to integrated luminosities of 6.7 nb−1and 7.9 nb−1, respectively. These data were collected over a seven-week period from March to May 2010. The uncertainty on the luminosity determination is on the order of 20%.
In this note, the nominal interaction point is defined as the origin of the coordinate system, while the beam direction defines the z-axis and the x−yplane is transverse to the beam direction. The positive x-axis is defined as pointing from the interaction point to the centre of the LHC ring and the positive
y-axis is defined as pointing upwards. The azimuthal angleφis measured around the beam axis and the
polar angleθis the angle from the beam axis. The pseudorapidity is defined asη = −ln tan(θ/2). The transverse momentum pT, the transverse energy ET, and the transverse missing energy ETmiss are defined in the x−yplane. The distance∆R in theη−φspace is defined as∆R= p
∆η2+ ∆φ2.
2 The ATLAS detector
The ATLAS detector [10] at the LHC comprises of a thin superconducting solenoid surrounding the inner-detector cavity and three large superconducting toroids arranged with an eight-fold azimuthal coil symmetry placed around the calorimeters, forming the basis of the muon spectrometer.
The Inner-Detector (ID) system is immersed in a 2 T axial field and provides tracking information on charged particles in a pseudorapidity range matched by the precision measurements of the electro- magnetic calorimeter. The silicon tracking detectors, pixel and silicon microstrip (SCT), cover the pseu- dorapidity range|η| < 2.5. The highest granularity is achieved around the vertex region using the pixel detectors. Typically three pixel layers are crossed by each track. For the SCT, eight strip layers (provid- ing four space points) are crossed by each track in the barrel region. A large number of hits (typically 36 per track) is provided by the Transition Radiation Tracker (TRT), which enables track-following up
to|η|=2.0. The electron identification information is provided by the detection of transition radiation in the xenon-based gas mixture of the TRT straw tubes.
The calorimeter system covers the pseudorapidity range|η| < 4.9, using a variety of detector tech- nologies. The lead-liquid argon (LAr) electromagnetic (EM) calorimeter is divided into a barrel part (|η| < 1.475) and two end-cap components (1.375 < |η| < 3.2). Over the region devoted to precision physics (|η| < 2.5), the EM calorimeter is segmented in three sections in depth. The remaining portion of the EM calorimeter, known as the end-cap inner wheel, is segmented in two sections in depth and has a coarser lateral granularity than for the rest of the acceptance. In the region of |η| < 1.8, a thin LAr presampler detector is used to correct for the energy lost by electrons, positrons, and photons upstream of the calorimeter. The hadronic tile calorimeter is placed directly outside the EM calorimeter envelope.
This steel/scintillating-tile detector consists of a barrel covering the region|η| < 1.0, and two extended barrels in the range 0.8 < |η| < 1.7. The copper-LAr Hadronic End-cap Calorimeter (HEC) consists of two independent wheels per end-cap (1.5 < |η| < 3.2), located directly behind the end-cap electro- magnetic calorimeter. The Forward Calorimeter (FCal) consists of three modules in each end-cap: the first, made of copper-LAr, is optimised for electromagnetic measurements, while the other two, made of tungsten-LAr, measure primarily the energy of hadronic interactions.
The muon spectrometer is based on the magnetic deflection of muon tracks in the large superconduct- ing air-core toroid magnets, instrumented with separate trigger and high-precision tracking chambers. A system of three large air-core toroids, a barrel and two end-caps, generates the magnetic field for the muon spectrometer in the pseudorapidity range of |η| < 2.7. In the barrel region, tracks are measured in chambers arranged in three cylindrical layers around the beam axis; in the transition and end-cap re- gions, the chambers are installed in planes perpendicular to the beam, also in three layers. Over most of the η-range, a precision measurement of the track coordinates in the principal bending direction of the magnetic field is provided by Monitored Drift Tubes (MDT’s). At large pseudorapidities, Cathode Strip Chambers (CSC’s) with higher granularity are used in the innermost plane over 2 < |η| < 2.7, to withstand the demanding rate and background conditions expected with the LHC operation at the nom- inal luminosity and centre-of-mass energy. The trigger system which covers the pseudorapidity range
|η|<2.4 consists of Resistive Plate Chambers (RPC’s) in the barrel (|η|<1.05) and Thin Gap Chambers (TGC’s) in the end-cap regions.
The first-level (L1) trigger system uses a subset of the total detector information to make a decision on whether or not to process an event. Details about L1 calorimeter and muon trigger systems used in the analysis of the W and Z candidates are provided in Section 5.
3 W, Z processes and sources of background
The results presented in this note are compared to expectations based on Monte Carlo simulations. The signal and background samples used in this note were generated at √
s = 7 TeV with PYTHIA [11]
using MRST LO [12] parton distribution functions (PDF), then simulated with GEANT4 [13] and fully reconstructed. These samples are summarised in Table 1.
The W and Z production cross sections times their respective W→`νand Z/γ∗→``decay branch- ing ratios used in this study are calculated at next-to-next-to-leading order (NNLO) in QCD corrections using the FEWZ program [14] with the MSTW2008 parton distribution function set [15]. The dilepton invariant mass of the Z/γ∗→``process is chosen to be greater than 60 GeV. These values are:
σNNLOW→`ν =10.45 nb and σNNLOZ/γ∗→`` =0.989 nb. (1) The estimated uncertainties for both cross sections coming from the factorization and renormalization scales as well as the parton distribution functions are expected to be approximately 3% [16, 17, 18].
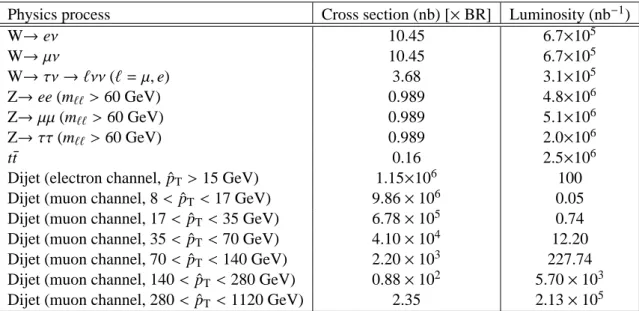
Physics process Cross section (nb) [×BR] Luminosity (nb−1)
W→eν 10.45 6.7×10⁵
W→µν 10.45 6.7×10⁵
W→τν→`νν(`=µ,e) 3.68 3.1×10⁵
Z→ee (m``>60 GeV) 0.989 4.8×10⁶
Z→µµ(m`` >60 GeV) 0.989 5.1×10⁶
Z→ττ(m``>60 GeV) 0.989 2.0×10⁶
t¯t 0.16 2.5×10⁶
Dijet (electron channel, ˆpT>15 GeV) 1.15×10⁶ 100 Dijet (muon channel, 8< ˆpT <17 GeV) 9.86×10⁶ 0.05 Dijet (muon channel, 17< ˆpT <35 GeV) 6.78×10⁵ 0.74 Dijet (muon channel, 35< ˆpT <70 GeV) 4.10×10⁴ 12.20 Dijet (muon channel, 70< ˆpT <140 GeV) 2.20×10³ 227.74 Dijet (muon channel, 140< ˆpT <280 GeV) 0.88×10² 5.70×10³ Dijet (muon channel, 280< ˆpT <1120 GeV) 2.35 2.13×10⁵
Table 1: Signal and background Monte Carlo samples used in the electron and muon channel analy- ses, including the production cross section (multiplied by the relevant branching ratios (BR)) and the integrated luminosity of the samples. The variable ˆpT is the transverse momentum of the partons in- volved in the hard scatter. W and Z cross sections are given at NNLO, the t¯t cross section is given at next-to-leading order (plus next-to-next-to-leading log), and the dijet cross sections are given at leading order.
The background contributions, expected primarily from jet production via QCD processes, have significant components from semi-leptonic decays of heavy quarks, hadrons misidentified as leptons, and in the case of the electron channel, electrons from conversions. For both the electron and muon channels, these sources of background have been obtained from dijet samples.
In the case of the W analysis, W events decaying intoτ-leptons with subsequent leptonicτdecays are also expected to contribute in both channels. Contributions from Z → µµdecays are significant in the muon channel. Due to the ηcoverage of the muon system, this type of decay is more likely to generate EmissT in the muon channel than Z → ee decays in the electron channel. The muon channel additionally takes into account contributions from Z →ττdecays and from t¯t events involving at least one semi-leptonic decay, though these contributions are small.
4 Object reconstruction
4.1 Electrons
The ATLAS standard electron/photon reconstruction and identification algorithm [19] is designed to provide various levels of background rejection optimised for high identification efficiencies for transverse energy ET>20 GeV, over the full acceptance of the inner-detector system. Electron reconstruction begins with a seed cluster of energy of ET > 2.5 GeV in the second layer of the electromagnetic calorimeter.
This cluster of size∆η×∆φ=0.075×0.125 is selected by a sliding window algorithm. A matching track, extrapolated to the middle EM calorimeter layer, is searched for in a broad window of∆η×∆φ=0.05×0.1 amongst all reconstructed tracks with pT > 0.5 GeV. The closest-matched track to this layer’s cluster barycentre is kept as that belonging to the electron candidate. The final electron candidates have cluster sizes of∆η×∆φ = 0.075×0.175 in the barrel calorimeter and 0.125×0.125 in the end-cap. The total
transverse energy of these clusters is the ET used in this analysis.
The baseline electron identification selections [19] are based on criteria using calorimeter and tracker information and have been optimised in 10 bins inηand 11 bins in ET. Three reference sets of require- ments (loose, medium, and tight) have been chosen, providing progressively stronger jet rejection at the expense of some identification efficiency loss. Each set adds additional constraints to the previous requirements:
• Loose: this basic selection uses EM shower shape information from the second layer of the EM calorimeter (lateral shower containment and shower width) and energy leakage into the hadronic calorimeters as discriminant variables. This set of requirements provides high and uniform identi- fication efficiency but a low background rejection;
• Medium: this selection provides additional hadronic rejection by evaluating the energy deposit patterns in the first layer of the EM calorimeter (the shower width and the ratio of the energy difference associated with the largest and second largest energy deposit over the sum of these ener- gies), track quality variables (number of hits in the pixel and silicon trackers, the transverse impact parameter) and a cluster-track matching variable (ηbetween the cluster and the track extrapolated to the first layer of the EM calorimeter)
• Tight: this selection further rejects charged hadrons and secondary electrons from conversions by fully exploiting the electron identification potential of the ATLAS detector. It makes requirements on the ratio of cluster energy to track momentum, on the number of hits in the TRT, and on the ratio of high-threshold to the total number of hits in the TRT. Electrons from conversions are rejected by requiring at least one hit in the first layer of the pixel detector. A conversion-flagging algorithm is also used to further reduce this contribution. The impact-parameter requirement applied in the medium selection is further tightened at this level.
Using Z → ee signal and QCD dijet Monte Carlo samples for electrons with ET > 20 GeV within the range |η| < 2.47 and excluding the transition region between the barrel and end-cap calorimeters (1.37<|η|<1.52), the expected identification efficiencies are estimated to be 94%, 90%, and 72% with respective rejection factors against background jets with true ET>20 GeV of 1100, 6800, and 92000 for loose, medium, and tight electron identification, respectively [19].
4.2 Muons
The ATLAS muon identification and reconstruction algorithms take advantage of the multiple sub- detector technologies which provide complementary approaches and cover pseudorapidities up to 2.7 over a wide pTrange [9].
The stand-alone muon reconstruction is based entirely on muon-spectrometer information, indepen- dently of whether or not this track is also reconstructed in the inner detector. The muon reconstruction is initiated locally in a muon chamber by the search for straight line track segments in the bending plane.
Hits in the precision chambers are used and the segment candidates are requested to point to the centre of ATLAS. The hit coordinateφin the non-bending plane measured by the trigger detectors is associated to the segment when available. A minimum of two track segments in different muon stations are combined to form a muon track candidate using three-dimensional tracking in the magnetic field. The track param- eters (pT,η,φ, distance of closest approach to the primary vertex along the beam axis and transverse to it) are obtained from the muon spectrometer track fit and are extrapolated to the interaction point taking into account both multiple scattering and energy loss in the calorimeters. For the latter, the reconstruc- tion utilises either a parameterisation or actual measurements of calorimeter energy losses, together with parameterisation of energy loss in the inert material. The typical muon energy loss in the calorimeters is
3 GeV. The stand-alone muon reconstruction algorithms use the least-squares formalism to fit tracks in the muon spectrometer and most material effects are directly integrated into theχ2function.
The combined muon reconstruction associates the stand-alone muon spectrometer tracks to an inner- detector track, that measures the bending of the muon within the solenoid, using the pixel, SCT and TRT detectors. The association between the stand-alone and inner-detector tracks is performed using a χ2, defined from the difference between the respective track parameters weighted by their combined covariance matrices. The parameters are evaluated at the point of minimum approach to the beam axis.
The combined track parameters are derived either from a statistical combination of the two tracks or from a refit of the full track. To validate the results presented in this note, these two independent reconstruction chains were exercised, leading to a good agreement. The results presented here are based on the one which relies on the statistical combination of muon-spectrometer and inner-detector measurements.
The reconstruction and identification efficiencies for muons with pT >10 GeV as extracted from W and Z signal Monte Carlo samples is estimated to be 94% [9]. The availability of muons with energies up to 100 GeV energy in cosmic rays has enabled the commissioning of the muon identification system.
Results from these studies indicate that the performance is in agreement with Monte Carlo expectation in this entire energy range. The tracking resolution has been measured to be better than 5% and the muon detection efficiency is in reasonable agreement with the values measured in simulated events. Detailed studies in collision data are underway but are currently limited by the number of high-pTmuons collected so far.
4.3 Transverse missing energy
The transverse missing energy (EmissT ) reconstruction used in the electron channel is currently only based on calorimeter information. This relies on a cell-based algorithm which sums the electromagnetic-scale energy deposits of calorimeter cells inside three-dimensional topological clusters [20]. The EM scale is the energy deposited in the calorimeter calculated under the assumption that all processes are purely electromagnetic in nature. No corrections for the different calorimeter response to hadrons and electrons or photons nor for dead material losses are applied. These topological clusters are built around energy E>4σnoiseseeds, whereσnoiseis the Gaussian width of the cell energy distribution in randomly triggered events, by iteratively gathering neighbouring cells with E > 2σnoise and, in a final step, by adding all direct neighbours of these accumulated secondary cells. The x- and y-components of the calorimeter EmissT term are calculated by summing over the transverse energies measured in these topological cluster cells i:
EElectron,miss
x,y =ECalo,missx,y =−X
i
Ex,y. (2)
The EmissT used in the muon channel is calculated from the reconstructed momenta of muons mea- sured in the range of pseudorapidity|η|<2.7 and the calorimeter term as given in Eq. 2:
EMuon,missx,y =−
X
Muons
Ex,y+X
i
Ex,y
=−
X
isolated
px,y+ X
non−isolated
px,y
+ECalo,missx,y , (3) where non-isolated muons are those within a distance ∆R ≤ 0.3 of another jet in the event. The pT of an isolated muon is determined from the combined measurement of the inner detector and muon spectrometer as explained in Section 4.2. The energy lost by an isolated muon in the calorimeters is not added to the calorimeter term. For a non-isolated muon, the energy lost in the calorimeter cannot be separated from the nearby jet energy. The muon spectrometer measurement of the muon momentum after energy loss in the calorimeter is therefore used unless there is a significant mis-match between the spectrometer and combined measurements, in which case the combined measurement minus the parameterised energy loss in the calorimeter is used. For higher values of the pseudorapidity outside the
fiducial volume of the inner detector (2.5 < |η| < 2.7), there is no matched track requirement and the muon spectrometer stand-alone measurement is used instead.
In both the electron and muon cases, the ETmissis defined as:
ETmiss= q
(Emissx )2+(Emissy )2. (4)
The performance of the ETmiss reconstruction in minimum-bias data is described in Ref. [21].
5 Event selection and preparation
5.1 Event selection
The results presented in this note were collected over a seven-week period, from March to May 2010.
From all data taken at a centre-of-mass energy of 7 TeV and for which the LHC declared stable beams, only those with the detector high voltage in nominal condition are selected. In addition, while the elec- tron channel analysis requires the solenoid to be on, the muon channel analysis needs both solenoid and toroid at nominal field. Finally, both leptonic channels require that all of the sub-detectors are opera- tional such that the response and main criteria needed for particle identification as well as energy and momentum computations do not deviate significantly from their expected behaviour. These basic data- quality requirements resulted in total integrated luminosities of 6.7 nb−1 for the W → eνand Z → ee channels, and 6.4 nb−1 and 7.9 nb−1 for the W → µν and Z → µµchannels, respectively. While the W →µνanalysis requires calorimeter information to calculate the ETmiss, no calorimeter information is required for the Z →µµchannel. This is the reason why they do not have the same integrated luminosity.
The uncertainty on the luminosity determination is on the order of 20%, though the relative luminosity between the various channels is known to a much higher precision.
Events are selected with the hardware-based L1 trigger. The L1 calorimeter trigger selects photons and electrons within|η|<2.5 using calorimeter information with the reduced granularity of trigger towers of dimension∆η×∆φ=0.1×0.1. The calorimeter trigger used in this analysis accepts electron and photon candidates if the signal from a cluster of trigger towers is above two trigger counts, where one count corresponds to approximately 1 GeV. The L1 muon trigger searches for patterns of hits within|η| <2.4 consistent with high-pT muons originating from the interaction region. The trigger logic is based on three trigger stations. The algorithm requires a coincidence of hits in the different trigger stations within a road, which tracks the path of a muon from the interaction point through the detector. The width of the road is related to the pT threshold to be applied. The muon trigger used in this analysis corresponds to the lowest pT threshold trigger which has a fully-opened road with a two-station coincidence. As a result of these trigger decisions, 1.2×10⁷and 2.8×10⁵ events are triggered in the electron and muon channels, respectively.
Collision candidates are selected by requiring a primary vertex with at least three tracks, consistent with the beam spot position. To reduce fake collision candidates from cosmic-ray or beam-halo events, the muon analysis requires the primary vertex position along the beam axis is required to be within 15 cm of the nominal position.
5.2 Event preparation
An analysis of a high statistics sample of minimum-bias events has shown that events can occasionally contain very localised high-energy calorimeter deposits not originating from the proton-proton collision, but e.g. from unexpected discharges in the hadronic end-cap calorimeter, and more rarely coherent noise in the electromagnetic calorimeter. Cosmic-ray muons undergoing a hard bremsstrahlung are also a potential source of localised energy deposits uncorrelated to the primary proton-proton collisions.
The occurrence of these events is very rare but can potentially impact significantly the EmissT measure- ment by creating high-energy tails [22]. To avoid spoiling the ETmiss measurement, dedicated cleaning requirements using reconstructed jets (with the anti-ktalgorithm [23]) in a narrow cone of size∆R=0.4 have been developed using a minimum-bias event sample. The jet properties are used as probes of the quality of the local calorimeter-energy deposit:
i) if more than 80% of the jet energy is deposited in the HEC calorimeter, 90% of the jet energy must be distributed over at least 6 calorimeter cells;
ii) if more than 95% of the jet energy is deposited in the EM calorimeter, less than 80% of the total jet energy must come from cells with an abnormal signal shape;
iii) the jet must primarily contain cells with energy deposited less than 50 ns before or after the nominal proton-proton collision time.
Events are kept only if all the jets reconstructed in the event with a transverse energy greater than 10 GeV at the EM scale fulfill the three requirements mentioned above. It was verified that these criteria remove less than one per mill of minimum-bias events and no W →`νevents nor dijet events in Monte Carlo simulation.
For the electron channel only, the quality of the reconstruction of the energy deposited by the elec- tron in the liquid argon calorimeter is assessed. The event is rejected if the candidate electromagnetic cluster is located in any problematic region of this detector: regions affected by major high-voltage prob- lems, isolated cells producing a high noise signal or no signal at all, and electronic front-end boards not providing any output signal. These problems can cause extended dead regions in a given layer of the calorimeter, which may have an important impact on the energy reconstruction of the electron. To min- imise the systematic uncertainty, an additional requirement is imposed such that a fiducial area around the energy clusters may not intersect that covered by a problematic front-end board if these are located in the first or second layers of the LAr EM calorimeter, where most of the electromagnetic shower energy is deposited. The loss in acceptance due to these requirements is 9% for the W signal and the background.
6 Preselection of high transverse-energy leptons
A preselection of high transverse-energy electrons and muons is made. Electron candidates with the identification level “loose” according to the algorithm as described in Section 4.1 are required to have a cluster ET >20 GeV within the range|η|< 2.47, excluding the transition region between the barrel and end-cap calorimeters (1.37 < |η| < 1.52). Muon candidate events selected according to the algorithm described in Section 4.2 are required to have at least one combined muon with pT >15 GeV and a pT
as measured by the muon-spectrometer greater than 10 GeV, within the range|η| < 2.4. The difference between the inner-detector and muon-spectrometer pT, corrected for the mean energy loss in upstream material, is required to be less than 15 GeV to increase the robustness against track reconstruction mis- matches. The difference between the z position of the muon track extrapolated to the beam line and the z coordinate of the primary vertex is required to be less than 1 cm.
Figures 1 and 2 show the kinematic properties of these candidates and compare these to the signal and background Monte Carlo samples described in Section 3. At this stage of the selection, the candidate events are dominated by the QCD background. If these Monte Carlo distributions are normalised to the total integrated luminosity of the data, the dijet Monte Carlo cross section appears to be over-estimated by a factor of approximately 2.2 for the electron channel and a factor of 1.9 for the muon channel. This is one of the reasons why partially data-driven background estimates for the electron and muon channels are presented in Section 8. These estimates are a first attempt to measure the QCD background contribution to the W channel and will greatly benefit from more statistics. The Monte Carlo distributions in Figures 1
[GeV]
ET
0 10 20 30 40 50 60 70 80 90 100
Entries / 5 GeV
10-1
1 10 102
103
104
Preliminary ATLAS
L = 6.7 nb-1
∫
= 7 TeV ) s Data 2010 (
ν
→ e W Conversions Hadrons b/c
ν τ
→ W
0 10 20 30 40 50 60 70 80 90 100 10-1
1 10 102
103
104
0 10 20 30 40 50 60 70 80 90 100 10-1
1 10 102
103
104
0 10 20 30 40 50 60 70 80 90 100 10-1
1 10 102
103
104
(a)
η
-2 -1 0 1 2
Entries / 0.1
0 20 40 60 80 100 120 140
= 7 TeV) s Data 2010 (
ν
→e W QCD
ν τ
→ W
ATLASPreliminary ∫ L= 6.7 nb-1
(b)
φ
-3 -2 -1 0 1 2 3
Entries / 0.32
0 50 100 150 200 250
= 7 TeV) s Data 2010 (
ν
→e W QCD
ν τ
→ W
ATLASPreliminary ∫ L=6.7 nb-1
(c)
Figure 1:Cluster ET(a), as well asη(b) andφ(c) (measured in the second layer of the electromagnetic calorime- ter) of electron candidates after preselection for data and Monte Carlo candidates broken down into the various signal and background components. The total number of Monte Carlo candidates is normalised to the number of observed data candidates. In Figure 1(a), the total QCD background is broken down into its constituents: hadrons misidentified as electrons, electrons from conversions, and electrons from semi-leptonic decays of heavy quarks.
[GeV]
pT
0 10 20 30 40 50 60 70 80 90 100
Entries / 5 GeV
1 10 102
103
[GeV]
pT
0 10 20 30 40 50 60 70 80 90 100
Entries / 5 GeV
1 10 102
103
ATLAS Preliminary L = 6.4 nb-1
∫
= 7 TeV) s Data 2010 (
ν µ
→ W QCD
ν τ
→ W
µ µ
→ Z
(a)
η -2 -1.5 -1 -0.5 0 0.5 1 1.5 2
Entries / 0.23
0 10 20 30 40 50 60 70 80
η -2 -1.5 -1 -0.5 0 0.5 1 1.5 2
Entries / 0.23
0 10 20 30 40 50 60 70 80
ATLAS Preliminary L = 6.4 nb-1
∫
= 7 TeV) s Data 2010 (
ν µ
→ W QCD
ν τ
→ W
µ µ
→ Z
(b)
φ
-3 -2 -1 0 1 2 3
Entries / 0.31
0 10 20 30 40 50 60 70 80
φ
-3 -2 -1 0 1 2 3
Entries / 0.31
0 10 20 30 40 50 60 70 80
ATLAS Preliminary L = 6.4 nb-1
∫
= 7 TeV) s Data 2010 (
ν µ
→ W QCD
ν τ
→ W
µ µ
→ Z
(c)
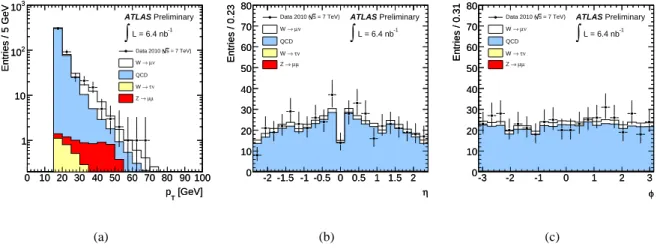
Figure 2: Combined pT (a),η (b), andφ(c) of muon candidates after preselection for data and Monte Carlo candidates broken down into the various signal and background components. The total number of Monte Carlo candidates is normalised to the number of observed data candidates.
and 2 have been normalised to the total number of data events, taking into account these scale factors for the QCD background. It is to be noted that all data distributions in this note are given with statistical error bars only, corresponding to 68.3% confidence intervals. These distributions show reasonable agreement in shape between data and Monte Carlo events. More details on the properties of inclusive muons are given in Ref. [24].
Figure 3 shows their transverse missing energy normalised in the same fashion as for Figures 1 and 2. Within the limited statistics afforded by the muon analysis, the EmissT distribution from the data is well reproduced by the Monte Carlo, and an excess of events around the expected signal peak region com-
[GeV]
T
Emiss
0 10 20 30 40 50 60 70 80 90 100
Entries / 5 GeV
10-1
1 10 102
103
104 ATLAS Preliminary L = 6.7 nb-1
∫
= 7 TeV ) s Data 2010 (
ν
→ e W Conversions Hadrons b/c
ν τ
→ W
0 10 20 30 40 50 60 70 80 90 100 10-1
1 10 102
103
104
0 10 20 30 40 50 60 70 80 90 100 10-1
1 10 102
103
104
0 10 20 30 40 50 60 70 80 90 100 10-1
1 10 102
103
104
(a)
[GeV]
miss
ET
0 10 20 30 40 50 60 70 80 90 100
Entries / 5 GeV
1 10 102
103
[GeV]
miss
ET
0 10 20 30 40 50 60 70 80 90 100
Entries / 5 GeV
1 10 102
103
ATLAS Preliminary L = 6.4 nb-1
∫
= 7 TeV) s Data 2010 (
ν µ
→ W QCD
ν τ
→ W
µ µ
→ Z
(b)
Figure 3: EmissT of electron (a) and muon (b) candidates after preselection for data and Monte Carlo candidates broken down into the various signal and background components. The total number of Monte Carlo candidates is normalised to the number of observed data candidates. In Figure 3(a), the total QCD background is broken down into its constituents: hadrons misidentified as electrons, electrons from conversions, and electrons from semi-leptonic decays of heavy quarks.
pared to the background is already visible at this stage of the selection (and is the reason for the different histogramme-stacking order between the electron and the muon channel). The higher-statistics compari- son of the electron analysis demonstrates that the ETmiss rejection in the data for EmissT >25 GeV is worse than in the Monte Carlo. The source of this discrepancy is currently under investigation. It is strongly correlated to the presence of a jet faking the electron in the event and therefore not in disagreement with the conclusions of Ref. [21] which focuses on inclusive minimum-bias events.
7 Selection and observation of W candidates
Additional requirements beyond those imposed in Section 6 are used to better discriminate potential W →`νevents from background events. The electron identification level as described in Section 4.1 is increased to “tight” while the minimum muon combined pT is increased to 20 GeV. Only the highest pT
lepton in the event is used.
Both the electron and muon analyses have considered the use of an isolation parameter to enhance the expected signal. However, the isolation requirements for the different channels should be considered separately, given that an electron is quite a complex object which can undergo bremsstrahlung while a muon is in some sense a simpler object primarily defined by its track. In addition, the EM calorimeter requirements for the electrons use variables which already provide some effective isolation.
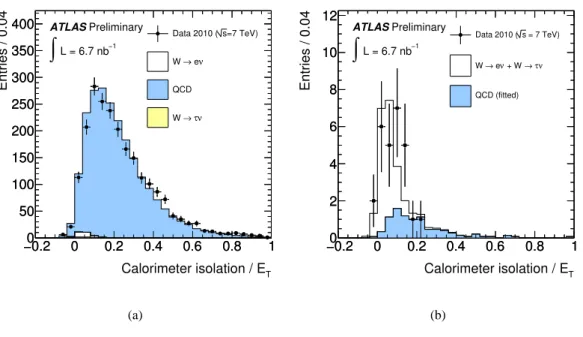
A calorimeter-based isolation parameter for the electron channel defined as the total calorimeter energy within a cone of ∆R < 0.3 surrounding the candidate electron cluster which is then divided by the cluster ET and a track-based isolation for the muon channel defined as the sum of inner-detector transverse momenta within a cone∆R<0.4 (P
pIDT ) which is then divided by the total combined muon
Calorimeter isolation / ET
-0.2 0 0.2 0.4 0.6 0.8 1 [GeV] Tmiss E
0 10 20 30 40 50 60 70 80 90 100
= 7 TeV ) s Data 2010 (
ν
→ e W
ν τ
→ QCD + W Preliminary
ATLAS
L = 6.7 nb-1
∫
(a)
Track Isolation / pT
0 0.5 1 1.5 2 2.5
[GeV]miss TE
0 10 20 30 40 50 60 70 80 90 100
Track Isolation / pT
0 0.5 1 1.5 2 2.5
[GeV]miss TE
0 10 20 30 40 50 60 70 80 90 100
= 7 TeV) s Data 2010 (
ν µ
→ W Backgrounds
L = 6.4 nb-1
∫
Preliminary ATLAS
(b)
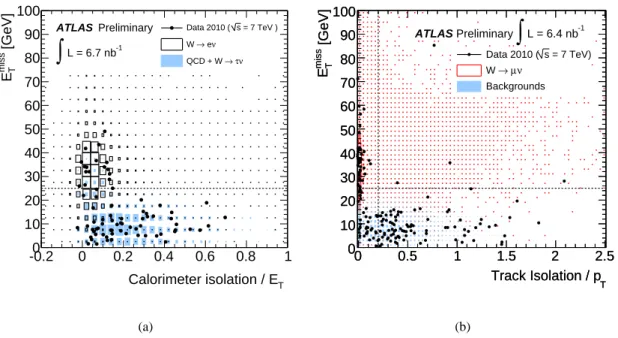
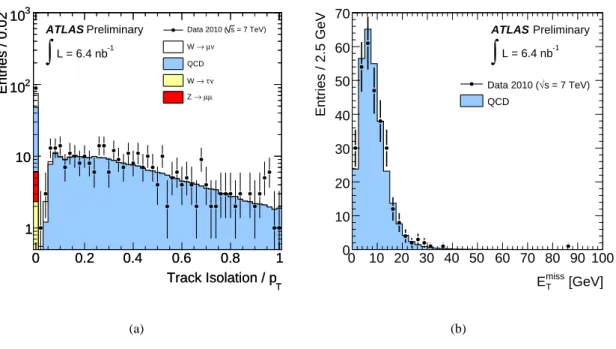
Figure 4: EmissT versus calorimeter-isolation parameter for electron candidates (a) and track-isolation param- eter for muon candidates (b) after preselection plus the “tight” requirement for electrons and muon combined pT>20 GeV.
pT are shown in Figure 4 and are plotted against the EmissT of the event. The isolation variable will be used in the electron analysis to make a data-driven estimate of the background contributions to the W →eνcandidates; therefore, no form of isolation is explicitly applied in the electron-channel selection.
An isolation requirement of P
pIDT /pT < 0.2 is used in the muon analysis given that, after all other selections are made to identify W candidates, this requirement rejects over 87% of the expected QCD background while keeping 99% of signal events. All further results shown in this section have passed the preselection requirements of Section 6, the “tight” requirement for electrons, the muon combined
pT>20 GeV, and this muon isolation requirement.
Additional kinematic requirements are explored in the last step of the signal selection: the EmissT of the event and the transverse mass mT of the lepton-EmissT system defined as
mT = q
2p`TpνT(1−cos(φ`−φν)) (5) where the measured EmissT components in (x, y) provide the neutrino information. All Monte Carlo one-dimensional distributions shown in this section have been normalised to integrated luminosities of 6.7 nb−1and 6.4 nb−1, in the electron and muon channels, respectively, using the cross sections as given in Table 1. In addition, the QCD background contributions have been scaled by factors of 1/2.2 and 1/1.9 in the electron and muon channels, respectively, to account for the over-estimation of the the dijet Monte Carlo cross section described in Section 6.
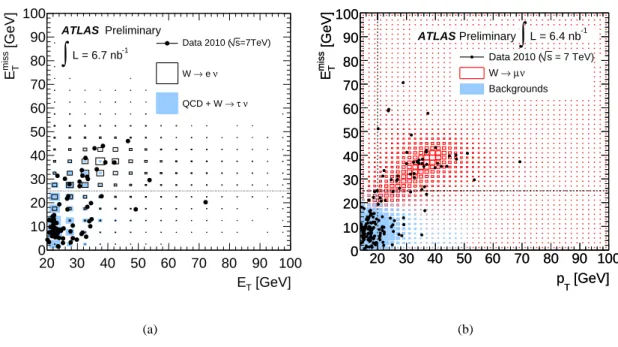
Figure 5 shows the EmissT distribution of all electron and muon candidates passing the requirements listed above. Both distributions indicate that applying a requirement of ETmiss> 25 GeV would greatly enhance the W signal over the expected background. This observation is also evident from the two- dimensional plot of EmissT versus electron cluster ET and muon combined pT shown in Figure 6. True W →`νevents in the Monte Carlo are predominantly at high EmissT due to the escaping neutrino in the event. Although some of the QCD background may also have neutrinos in their final state, these events
[GeV]
T
Emiss
0 10 20 30 40 50 60 70 80 90 100
Entries / 5 GeV
10-1
1 10 102
Preliminary ATLAS
L = 6.7 nb-1
∫
= 7 TeV ) s Data 2010 (
ν
→ e W QCD
ν τ
→ W
0 10 20 30 40 50 60 70 80 90 100 10-1
1 10 102
0 10 20 30 40 50 60 70 80 90 100 10-1
1 10 102
0 10 20 30 40 50 60 70 80 90 100 10-1
1 10 102
(a)
[GeV]
miss
ET
0 10 20 30 40 50 60 70 80 90 100
Entries / 5 GeV
10-1
1 10 102
[GeV]
miss
ET
0 10 20 30 40 50 60 70 80 90 100
Entries / 5 GeV
10-1
1 10 102
ATLAS Preliminary L = 6.4 nb-1
∫
= 7 TeV) s Data 2010 (
ν µ
→ W QCD
ν τ
→ W
µ µ
→ Z
(b)
Figure 5:EmissT of selected electron (a) and muon (b) candidates.
[GeV]
ET
20 30 40 50 60 70 80 90 100 [GeV]miss TE
0 10 20 30 40 50 60 70 80 90 100
=7TeV) s Data 2010 (
ν
→ e W
ν τ
→ QCD + W Preliminary
ATLAS
L = 6.7 nb-1
∫
(a)
[GeV]
pT
20 30 40 50 60 70 80 90 100 [GeV]miss TE
0 10 20 30 40 50 60 70 80 90 100
[GeV]
pT
20 30 40 50 60 70 80 90 100 [GeV]miss TE
0 10 20 30 40 50 60 70 80 90 100
= 7 TeV) s Data 2010 (
ν µ
→ W Backgrounds
L = 6.4 nb-1
∫
Preliminary ATLAS
(b)
Figure 6: EmissT versus the electron cluster ET(a) and the muon combined pT(b). For the purpose of this figure, the requirement of the muon combined pT is lowered to 15 GeV.
mostly populate the regions of small EmissT .
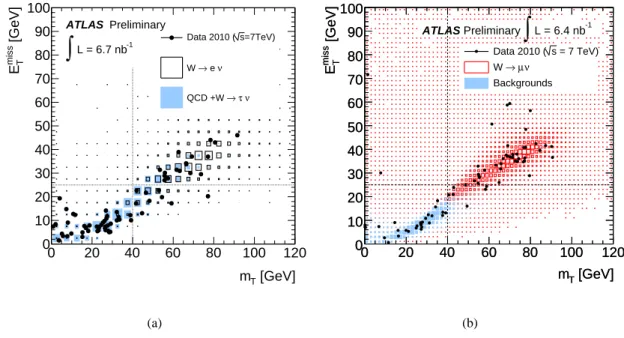
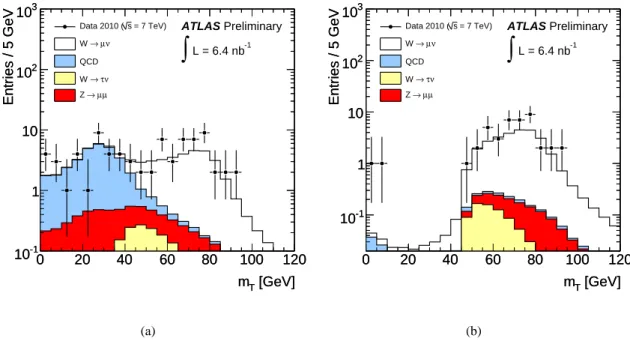
The transverse mass of the lepton-EmissT system is highly correlated to the ETmiss of the event as is demonstrated in Figure 7 which shows a two-dimensional plot of the EmissT -mT plane. Figures 8 and 9 show projections of Figure 7 where the mT of the event is shown without and with a requirement of