ATLAS-CONF-2010-036 13July2010
ATLAS NOTE
ATLAS-CONF-2010-036
June 7, 2010
Muon Performance in Minimum Bias pp Collision Data at √
s =7 TeV with ATLAS
The ATLAS Collaboration
Abstract
Muon final states provide clean signatures for many physics processes at the LHC. Up to transverse muon momenta of about 30 GeV muons are predominantly produced in weak decays of hadrons while they also come from the decays of W and Z boson and top quarks at higher momenta. The design of the ATLAS detector allows for efficient muon identification with high resolution in a wide momentum range from the GeV to the TeV region. High momentum resolution and good rejection of muons from pion and kaon decays-in-flight and calorimeter punch-through are achieved by the combination of the precise momentum measurements in the inner detector and the ATLAS muon spectrometer.
The performance of the ATLAS muon reconstruction and identification was studied with up to 0.6 nb−1 of LHC pp collision data at √
s = 7 TeV collected with a minimum bias trigger. Measured detector efficiencies, hit multiplicities, muon isolation, and residual dis- tributions of reconstructed muon tracks are well reproduced by the Monte-Carlo simulation.
1 Introduction
Many physics processes at the LHC are only accessible in final states with highly energetic charged leptons due to the overwhelming QCD background. The ATLAS detector is optimized for muon identifi- cation, with an efficiency greater than 95% and a fractional momentum resolution better than 3% over a wide transverse momentum (pT) range and 10% at pT =1 TeV. Muon momenta are independently mea- sured in the inner detector and the muon spectrometer. The deflection of muons by the magnetic field generated by a system of air core toroid coils in the muon spectrometer is measured by three layers of precision drift tube (MDT) chambers in|η|<2 and by two layers of MDT chambers in combination with one layer of cathode strip chambers (CSC) at the entrance of the muon spectrometer for 2 ≤ |η| < 2.7.
Three layers of resistive plate chambers (RPC) in the barrel region (|η|< 1) and three layers of thin gap chambers (TGC) in the end caps (1 < |η| < 2.4) provide the muon trigger and also measure the muon trajectory in the non-bending plane of the spectrometer magnets. Up to |η| = 2.5 muon momenta are also measured in the inner detector by three types of detectors operated in a solenoidal field of 2 T: a silicon pixel detector closest to the interaction point, a silicon strip detector (SCT) surrounding the pixel detector, and a transition radiation straw tube tracker (TRT) as outermost part of the inner detector [1].
The muon reconstruction algorithms exploit the redundancy of the momentum measurements in the inner detector and the muon spectrometer. The combination of these two measurements improves the momentum resolution and reduces the muon misidentification rate to a few per mill per event [2]. The algorithms for the reconstruction of muons in pp collisions at √
s = 7 TeV have been optimized with Monte-Carlo simulations. 0.6 nb−1integrated luminosity of pp collisions at 7 TeV centre-of-mass energy, corresponding to the data acquired with minimum bias triggers, were used to study the performance of the muon reconstruction in ATLAS and the reliability of the Monte-Carlo simulation. After a short introduction to the muon reconstruction algorithms, the results of this study will be presented in this note.
2 Muon identification strategies
In ATLAS four kinds of muon candidates are distinguished depending on the way they are reconstructed:
stand-alone muons, combined muons, segment tagged muons, and calorimeter tagged muons.
Stand-alone muon: The muon trajectory is only reconstructed in the muon spectrometer. The muon momentum measured in muon spectrometer is corrected for the parametrized energy loss of the muon in the calorimeter, to obtain the muon momentum at the interaction point. The direction of flight and the impact parameter of the muon at the interaction point are determined by extrapolating the spectrometer track back to the beam line.
Combined muon. The momentum of the stand-alone muon is combined with the momentum measured in the inner detector. The muon trajectory in the inner detector also provides information about the impact parameter of the muon trajectory with respect to the primary vertex.
Segment tagged muon: A trajectory in the inner detector is identified as a muon if the trajectory ex- trapolated to the muon spectrometer can be associated with straight track segments in the precision muon chambers.
Calorimeter tagged muon: A trajectory in the inner detector is identified as a muon if the associated energy depositions in the calorimeters is compatible with the hypothesis of a minimum ionizing particle.
Stand-alone muons can be reconstructed in the whole acceptance range of the muon spectrometer of
|η|<2.7 while combined and segment tagged muons are restricted to the acceptance of the inner detector of|η| <2.5. Segment tagged muons are mainly needed to identify muons with low transverse momenta, pT . 5 GeV, because the deflection of these low energy muons in the muon spectrometer is so large that they do not cross two layers of muon chambers, which is the minimum for a stand-alone track. The calorimeter tagged muons are important to cover the acceptance gap of the muon spectrometer at|η| ∼0 required by services for the inner detector and the calorimeters.
The identification of combined and tagged muons uses the fitted tracks from the set of reconstructed inner detector charged particles. Due to the high granularity of the pixel and SCT detectors incorrect associtaions of hit clusters to track are minimized and fake tracks can be rejected before a track is con- sidered as a muon candidate. The matching between inner detector tracks, calorimeter deposits and muon spectrometer tracks or track segments uses a precise propagation of the track parameters and errors through the inhomogeneous magnetic field and takes into account an accurate and optimised description of the active and passive material of the full detector.
In the early phase of the LHC operation, ATLAS uses more than one reconstruction algorithm for each muon category following different pattern recognition strategies. The complementarity of the differ- ent muon types and the corresponding alternative reconstruction algorithms makes it possible to evaluate the muon performance in detail also with inclusive muons in minimum bias data without the need of di-muon resonances.
The track based reconstruction algorithms are organized in two chains as reported in [2] and [3].
2.1 Chain 1
In chain 1 the muon stand-alone reconstruction is initiated in a muon chamber by the search for straight line track segments in the bending plane of the toroidal field. Hits in the precision chambers confirmed by trigger chambers hits wherever possible are used and the segment candidates are required to point loosely to the centre of ATLAS. The hit coordinate x in the non-bending plane measured by the trigger chambers is associated with the segment when available. Otherwise x is determined by the chamber position. As the drift tubes of the precision chambers are almost 100% efficient in their active volume, segments crossing the active areas of tubes which give no hit are disfavoured. If more than at least two track segments in different muon chambers are found in a constrained η−φ region of interest, these are combined to form a muon track candidate using three-dimensional tracking in the magnetic field.
The resulting stand-alone track extrapolated to the interaction point is statistically combined with the matching inner detector track.
2.2 Chain 2
In chain 2 the global pattern recognition in the muon spectrometer is based on two independent Hough transforms [4] in the bending and non-bending plane while search roads are used during the pattern recognition in chain 1. The hit patterns obtained in the two projections are then combined in the segment finding. Straight line segments are reconstructed in each chamber and hits from trigger detectors from the same pattern are associated with them. Track candidates are built from the segments associated to the same hit pattern found by the Hough transforms. Segments in the outermost chambers are used to seed the track fit with all the segments in the next chamber closer to the interaction point. All the successful combinations are considered in extending the track fit to the segments in the innermost chamber layer.
If more than one track is found, the track with the highest number of hits is selected, but, unlike the procedure in chain 1, tracks crossing many unhit tubes are not rejected. If two tracks have the same number of hits, the track with the smallerχ2value is selected. The final track candidates are refitted with the full treatment of material effects.
Combined muons are identified by a common track fit to the hits in the inner detector and the muon spectrometer. This fit has high rejection power against mismatches between inner detector and stand- alone muon tracks.
Chain 2 also offers an alternative approach to the combined muon reconstruction: here the pattern recognition in the muon spectrometer is seeded by the extrapolation of an inner detector track.
3 Detector status
The data analysed in this note were recorded with a well functioning ATLAS detector. The fraction of dead or noisy channels was low in all sub-detectors: 2.6% in the pixel detector, 0.7% in the silicon strip detector, 2.0% in the transition radiation tracker, 1.8% in the calorimeters, 0.3% in the muon drift-tube chambers, 1.5% in the cathode strip chambers, 2.7% in the resistive plate chambers, and 1.2% in the thin gap chambers. The occupancy of the tracking detectors due to electronics noise was low, less than 0.1%.
Dead and noisy channels which are spotted in experimental data in the inner detector and the calorime- ters are also simulated as dead and noisy channels. No dead or noisy channels or known cross talk between read-out channels are simulated in the muon spectrometer.
4 Data sets
The analysis presented here is performed on pp collision data collected in spring 2010 at √
s = 7 TeV with the minimum bias trigger, requiring coincidence of the two sides of the minimum bias trigger scintillators. In the samples used in the analysis, stable beam operation and proper functioning of all detector modules used in the muon reconstruction were required. Depending on the particular analysis, the selected data set corresponds to an integrated luminosity of up to 0.6 nb−1.
The experimental data are compared to non-diffractive minimum bias Monte-Carlo simulation, gen- erated with PYTHIA [5], fully simulated with GEANT-4 [6] and fully reconstructed with the ATLAS reconstruction software.
5 Event and muon selection
To ensure that the minimum bias trigger was not fired by cosmic rays, only events with at least three inner detector tracks with at least one pixel and more than 5 SCT hits, one track with p > 4 GeV, were selected.
As long as not stated otherwise, combined muons are used, and no additional selection cut on top of the cuts applied by the reconstruction algorithms is applied. Combined muons are chosen because of their very low contamination with muons from cosmic rays. The analysis of randomly triggered events yields about 10−5stand-alone muons with pT >6 GeV per random trigger in chain 1 and about 10−4stand-alone muons with pT >6 GeV per random trigger in chain 2. The higher stand-alone muon rate in chain 2 is mainly caused by less stringent requirements on the pointing of the tracks to the interacting points than applied in chain 1. The rate of 10−4 stand-alone muons per random trigger in chain 2 is consistent with the rate of cosmic muons traversing the ATLAS muon spectrometer. After the combination of the stand- alone muon tracks with matching inner detector tracks only 10−6combined muons with pT >6 GeV per random trigger are found in either chain.
ATLAS Preliminary ATLAS Preliminary
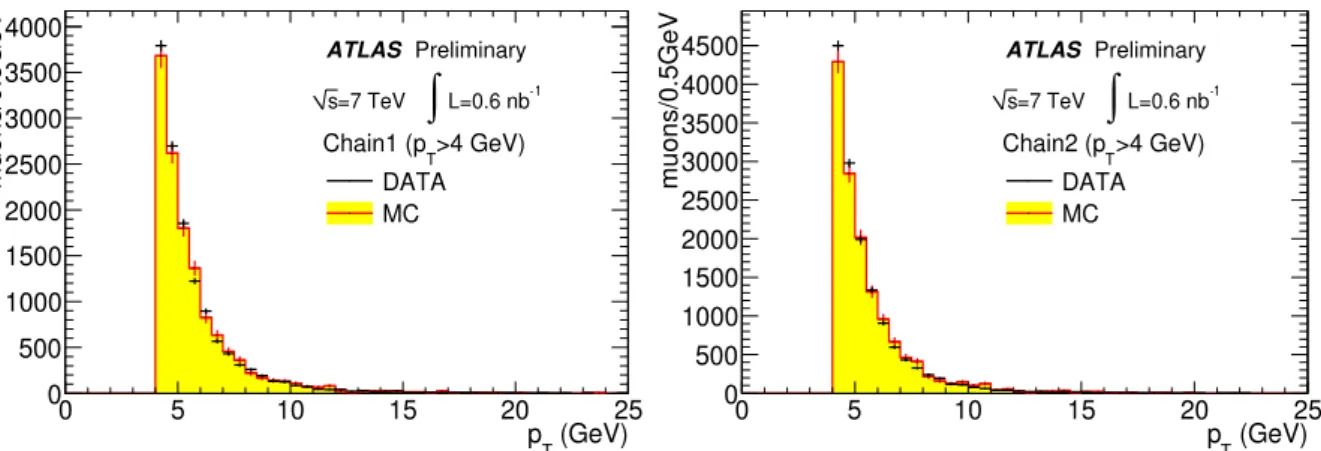
Figure 1: Comparison of the transverse momentum distributions of the combined muons reconstructed by the two chains above 4 GeV transverse momentum in experimental data with the Pythia minimum bias Monte-Carlo prediction. The simulated distributions are normalized to the number of entries in the experimental distribution.
6 Validation of the muon Monte-Carlo simulation
The predictions of the muon Monte-Carlo simulation are validated in several steps in this note. In the first step, which is documented in this section, elementary distributions like the number of hits on the reconstructed muon tracks and the energy deposited in the calorimeters around the reconstructed muons are considered. In the second step the performance of the combined reconstruction algorithms is studied with respect to the performance of the muon taggers.
ATLAS Preliminary ATLAS Preliminary
Figure 2: Comparison of the pseudo-rapidity distributions of the combined muons reconstructed by the two chains above 4 GeV transverse momentum in experimental data with the Pythia minimum bias Monte-Carlo prediction. The simulated distributions are normalized to the number of entries in the experimental distribution.
6.1 Basic validation on the track level
Figure 1 shows the pTspectra of the combined muons as measured in 7 TeV minimum bias data by each reconstruction chains above pT =4 GeV. In both chains the Monte-Carlo simulation reproduces the mea-
sured momentum spectrum well within statistical errors. About 10% more combined muons are found in chain 2 than in chain 1 for 4 GeV≤ pT ≤6 GeV while almost the same number of combined muons is found in chain 1 and 2 for pT > 6 GeV. The Monte-Carlo distributions of Figure 1 are normalized to the experimental data distribution. The ratio of the normalization factors of chain 1 and chain 2 is close to 1 (0.91±0.03 for pT > 4 GeV, 0.97±0.03 for pT > 6 GeV). The performances of the combined reconstruction algorithms of the two chains are very similar for pT > 6 GeV. Their behaviour is well reproduced by the Monte-Carlo simulation.
The shapes of the measured pseudorapidity distributions agree with the shape of the simulated distri- butions in Figure 2. So the measured muons are distributed in the phase space like the simulated muons.
The drops in the muon rates at η ∼ 0 and |η| = 1.2 reflect known acceptance gaps of the muon spec- trometers. η ∼0 is not fully instrumented with muon chambers to provide space for inner detector and calorimeter services. |η|=1.2 is a barrel end-cap transition region where several muon chambers are not installed yet [1].
In the following sections results will only be shown for muons of one algorithm chain because of the great similarity of the results for the two chains. Unless stated otherwise muons with pT > 4 GeV are considered.
ATLAS Preliminary ATLAS Preliminary
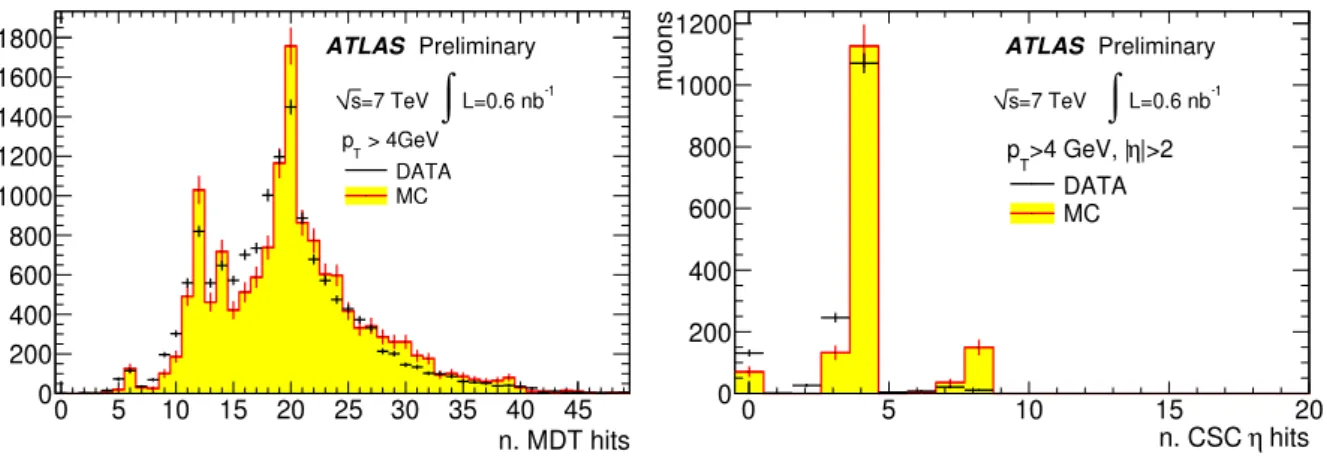
Figure 3: Comparison of the measured distributions of the number of MDT hits (left plot) and CSC hits in the bending plane (right plot) on the combined muon tracks with the Monte-Carlo predictions for chain 2.
The performance of the reconstruction of charged particle tracks in the inner detector is known to be well modelled by the ATLAS simulation [7]. In this section, the validation of the Monte-Carlo simulation will therefore be focused on the muon spectrometer.
Reasonable agreement between experimental and simulated data is observed for the number of pre- cision chambers hits on the combined muon track in the muon spectrometer (see Figure 3. The shape of the MDT and CSC hit distributions in data, for hits in the bending plane, follow the shapes of the Monte-Carlo curves.
Larger discrepancies between the hit multiplicity distributions are found for the trigger chambers.
Yet the fraction of muon tracks with at least two trigger chamber hits needed for the reconstruction of the muon trajectory in the non-bending plane of the spectrometer magnet system is well predicted by the Monte-Carlo simulation. The simulation predicts a 2% higher fraction than measured since known inefficiencies of the trigger chambers were not simulated.
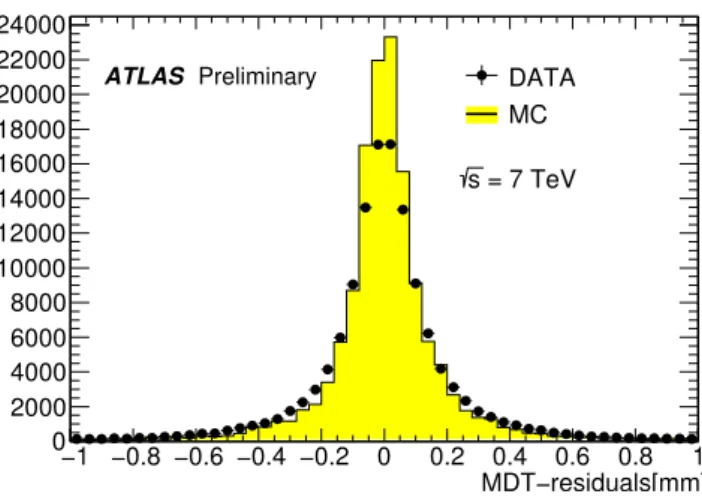
A discrepancy between the Monte-Carlo prediction and the experimental measurement is also ex- pected for the track residuals in the MDT chambers. Wider residuals than predicted, as shown in Fig- ure 4, are caused by two effects. The first, main effect is the underestimation of the amount of material
ATLAS Preliminary
Figure 4: Comparison of the measured MDT track residual distribution with the Monte-Carlo prediction for chain 2.
in the muon spectrometer in the Monte-Carlo simulation which will be corrected in future Monte-Carlo productions. The second much smaller effect is the limited accuracy of the calibration of the MDT cham- bers. Because of the limited statistics the calibration of the space drift-time relationships of the MDT chambers is not performed with the ultimate accuracy of 20µm, but only of the order of 50 to 100µm.
6.2 Validation of the muon energy depositions in the calorimeters and isolation cuts A powerful tool in suppressing muons from mesons in jets is the requirement that the muons are isolated.
The isolation can be based on a cut on the energy deposited in the calorimeter in a cone of typically 0.2 ≤ ∆R ≤ 0.4 (∆R = p
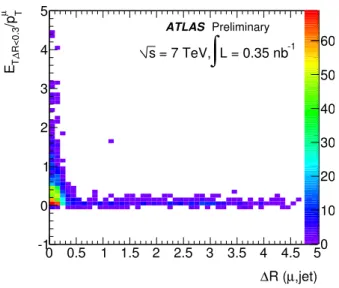
∆η2+ ∆φ2) around the reconstructed muon trajectory. Figure 5 shows the transverse energy deposited in the calorimeters in a cone of ∆R = 0.3 around a muon above 6 GeV transverse momentum as a function of the distance from the closest jet with pT >5 GeV. Isolated muons separated (∆R>0.5) have deposited only very little energy while muons in jets show much larger energy around them in the calorimeters.
Muons in the minimum bias data of pp collision at 7 TeV centre-of-mass energy are predominantly produced in meson decays. As such the minimum bias data provide an initial testbed for the calorimeter based muon isolation.
Figure 6 shows the transverse energy deposited (after pedestal subtraction) around a muon within a cone of∆R<0.2 and∆R<0.3 divided by the pT of the combined muon. The experimental data points are in agreement with the Monte-Carlo prediction.
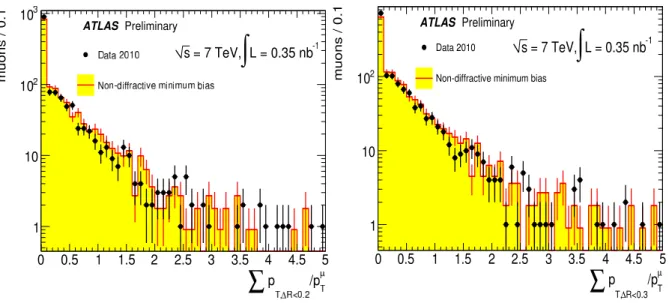
Alternatively the sum of the transverse momenta of the tracks in a given cone around the muon is used as isolation variable. Figure 7 shows the sums of the transverse momenta of the tracks within cones of∆R< 0.2 and∆R <0.3 around the reconstructed combined muons. As before reasonable agreement between the measured and simulated distribution is achieved.
One can conclude that the ATLAS Monte-Carlo simulation can be used to optimize muon isolation criteria.
7 Relative efficiency measurement
The Monte-Carlo simulation produces a fairly good description of basic combined muon characteristics, such as those presented above, or such as the χ2 quantifying the compatibility of the muon track pa-
,jet) µ
∆R ( 0 0.5 1 1.5 2 2.5 3 3.5 4 4.5 5
µ T/pR<0.3∆T,E
-1 0 1 2 3 4 5
0 10 20 30 40 50
-1 60 L = 0.35 nb
∫
= 7 TeV, s
ATLAS Preliminary
Figure 5: Dependence of the measured transverse energy deposited around a combined muon in a cone of∆R<0.3 normalized to the transverse momentum of the muon above 6 GeV transverse momentum on the distance to the closest jet with pT >5 GeV. No overlap removal between muons and jets is performed.
rameters measured in the inner detector with those measured in the muon spectrometer, as shown in [8].
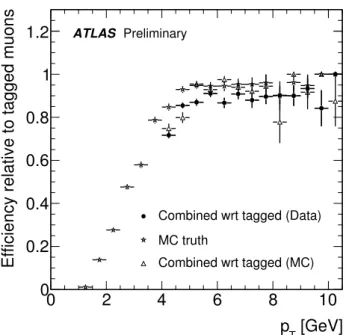
Investigation of the relative efficiencies of the muon reconstruction algorithms provides a study of the predictive power of the Monte-Carlo simulation at a higher level of complexity. For instance, the effi- ciency of the combined muon reconstruction algorithm can be measured for muons that are reconstructed in the inner detector and that are both segment tagged and calorimeter tagged (tagged muons). This latter category of muons is used because it has a high purity and a high efficiency (90% according to MC).
Figure 8 shows the efficiency of combined muons reconstructed by chain 2 measured with respect to tagged muons of chain 2 for collision data and for Monte-Carlo simulation. The combined muon reconstruction efficiency in simulation, measured using only muons identified in the simulation as true muons, is also shown in the figure (as the star-shaped symbols labeled as MC truth). The relative effi- ciency for data is on average a few percent lower than predicted by simulation, indicating either a lower purity of the tagged muon sample in data than in simulation or a lower efficiency of combined muon reconstruction in data than simulation. The relative efficiency predicted for simulation is also a bit lower than the efficiency of combined muon reconstruction in simulation, due to some contamination of the tagged muon sample by inner detector tracks that are mistagged as muons.
8 Measurement of the momentum resolution
The inner detector momentum resolution for muons with 6 GeV< pT <20 GeV is dominated by multiple scattering and unaffected by the small residual misalignment of the inner detector. A fractional momen- tum resolution of.2% is reached in the barrel region which increases to about 5% in the forward end-cap region [2][9]. The stand-alone muon momentum resolution is dominated by energy loss fluctuations for pT .10 GeV and by multiple scattering above 10 GeV. A fractional stand-alone momentum resolution of&5% is expected for muons with pT . 10 GeV [2]. The distribution of the difference of the muon momentum measured in the inner detector and the stand-alone muon momentum therefore provides an estimate of the stand-alone muon momentum resolution. Figure 9 shows the distribution of this differ- ence divided by the momentum measured in the inner detector. The distribution has a narrow core and a
ATLAS Preliminary ATLAS Preliminary
Figure 6: Comparison of the measured transverse energy deposited around a combined muon in a cone of∆R<0.2 on the left and of∆R<0.3 on the right normalized to the transverse momentum of the muon with the Monte-Carlo prediction. The distributions are normalized to the number of selected events.
tail to positive values. The shape of the distribution is similar in the Monte-Carlo simulation. According to the Monte-Carlo simulation, the tail of the distribution to positive values is caused by muons from pion and kaon decays-in-flight. The origin of the larger tail in the measured than the simulated distribution is not yet understood and under further investigation.
9 Conclusions
The first half inverse nb of pp collision minimum bias data at √
s has been used to validate the muon Monte-Carlo simulation. Exploiting the redundancy in the muon reconstruction algorithms it was possi- ble to measure relative efficiencies of the muon reconstruction algorithms which are very well predicted by the Monte-Carlo simulation. The same level of agreement between simulation and experimental mea- surement is observed in the energy deposition in the calorimeters for isolated and non-isolated muons.
The ATLAS muon Monte-Carlo simulation has shown to be a reliable tool for muon performance studies.
References
[1] ATLAS Collaboration, G. Aad et al., The ATLAS Experiment at the CERN Large Hadron Collider, JINST 3 (2008) S08003.
[2] The ATLAS Collaboration, G. Aad et al., Expected Performance of the ATLAS Experiment - Detector, Trigger and Physics,arXiv:0901.0512 [hep-ex].
[3] ATLAS Collaboration, G. Aad et al., Identification of muon candidates in pp collisions at
√s=900 GeV with the ATLAS detector, ATLAS-CONF-2010-015 (2010) .
[4] R. Duda and P. Hart, Use of the Hough Transformation to Detect Lines and Curves in Pictures, Comm. ACM, Vol. 15, pp. 11-15 (1972) .
ATLAS Preliminary
µ
/pT R<0.3
∆ T,
∑ p
0 0.5 1 1.5 2 2.5 3 3.5 4 4.5 5
muons / 0.1
1 10 102
Data 2010
Non-diffractive minimum bias
L = 0.35 nb-1
∫
= 7 TeV, s
ATLAS Preliminary
Figure 7: Comparison of the measured sum of the transverse momenta of tracks around a combined muon in a cone of∆R<0.2 on the left and of∆R<0.3 on the right normalized to the transverse momentum of the muon with the Monte-Carlo prediction. The distributions are normalized to the number of selected events.
[5] P. S. T. Sjostrand, S. Mrenna, PYTHIA 6.4 Phyisics and Manual, JHEP 09 (2009) 026.
[6] GEANT-4 Collaboration Collaboration, S. A. et al., GEANT-4: A simulation toolkit, Nucl. Instrum.
Meth. (2003) .
[7] ATLAS Collaboration, G. Aad et al., Tracking Results and Comparison to Monte Carlo simulation at √
s=900 GeV, ATLAS-CONF-2010-011 (2010) .
[8] ATLAS Collaboration, G. Aad et al., Preliminary studies for the measurement of the inclusive muon spectrum in pp collisions at √
s=7 TeV with the ATLAS detector., ATL-CONF-2010-035 (2010) . [9] ATLAS Collaboration, P. Ryan et al., The ATLAS Inner Detector commissioning and calibration,
arXiv:1004.5293 [physics.ins-det].
ATLAS Preliminary
Figure 8: Comparison of the relative efficiency of the combined reconstruction algorithm of chain 2 with respect to the segment and calorimeter tagged muons of chain 2 with the Monte-Carlo prediction for pT > 4 GeV. The star-shaped symbols labeled as MC truth show for comparison the combined reconstruction efficiency for muons identified in the simulation as true muons.
ATLAS Preliminary
Figure 9: Difference of the muon momentum measured in the inner detector and the stand-alone muon momentum normalized to the momentum measured in the inner detector as an estimate for the stand- alone momentum resolution. The Monte-Carlo distribution is normalized to the number of entries in the experimental distribution.