ATLAS-CONF-2010-048 28July2010
ATLAS NOTE
ATLAS-CONF-2010-048
July 21, 2010
Studies of Di ff ractive Enhanced Minimum Bias Events in ATLAS
The ATLAS collaboration
Abstract
While charged particle multiplicities in non-diffractive events have been studied in great detail both at the Tevatron and the LHC, there is comparatively little information about the diffractive component of the inelastic cross section. In this note we select a sample of events at √s = 7 TeV enhanced in diffractive interactions by selecting events that have hits on exactly one side of the Minimum Bias Trigger Scintillator detector of ATLAS. We study the rate of such events with respect to events that have hits on either side. Furthermore we study the multiplicity,ηand pT distributions of tracks in this sample and compare it to simulated Monte Carlo events from the P6, Pand P8 generators which have been passed through ATLAS simulation. The analysis is not corrected for experimental effects due to detector or reconstruction inefficiencies or mismeasurements.
1 Introduction
The total pp cross section can be divided into two components, elastic and inelastic interactions. The latter category is further subdivided into non-diffractive (ND) events, in which there is an exchange of quantum numbers between the two interacting systems, and diffractive events, where a color singlet with the quantum numbers of the vacuum, often termed a pomeron, is exchanged and one (single diffraction, SD) or both (double diffraction, DD) of the protons breaks up. The non-diffractive processes dominate the inelastic interactions, however the diffractive component contributes typically 20-30% of the inelastic collisions at √
s=7 TeV according to the current models.
These pp interactions fall into the realm of soft QCD, where interactions are too strong for pertur- bative calculations. Diffractive interactions, generally at low momentum transfer, can only be described by phenomenological models, and there is little consensus in the theoretical community as to which method is the best. Uncertainties in model predictions for the behavior of diffractive events at LHC en- ergies are high, which leads to uncertainties of 20% in the luminosity determination based on counting inelastic collisions [1]. However, a smaller uncertainty of 11% has recently been achieved based on dedicated Van-der-Meer scans. If a better understanding of diffractive interactions can be achieved, the knowledge could then be used to improve the uncertainty on the luminosity based on the counting of inelastic collisions. Additionally, the uncertainty in the diffractive model creates difficulties for tuning the non-diffractive portion, forcing the tunes to be made from restricted areas of phase space, such as in [2].
The absence of color exchange in diffractive events leads to rapidity gaps, a characteristic which experimentalists can exploit. This note describes an analysis which measures the properties of tracks in a diffractive enhanced event sample, compares them to the predictions from Monte Carlo (MC) generators passed through the ATLAS simulation and additionally aims to constrain the relative diffractive to non- diffractive cross sections. The generators used are P6 [3], P8 [4] and P[5]. In particular we examine events that have hits only on one side of the Minimum Bias Trigger Scintillator (MBTS) detectors to enhance the sample in the diffractive component. For events with at least one track with pT > 500 MeV and|η| < 2.5 the inclusive sample that has hits on either both or one side of the MBTS detector consists of about 12-20% diffractive events, while the sample where hits are only present on one side consists of 85-98% diffractive events (depending on which MC model is used). Thus the sample is greatly enhanced in diffractive events and provides a good testing ground for the diffractive models.
This note is structured as follows. Section 2 describes the ATLAS detector and, in particular, the sub- detectors relevant to this measurement. Section 3 introduces the measurement strategy and the datasets and event and track selection are described in Section 4. Section 5 reviews the systematic uncertainties in the measurement and Section 6 presents the results. Finally, conclusions are drawn in Section 7.
2 The ATLAS Detector
The ATLAS detector [6] is a general multi-purpose detector that covers nearly the full solid angle around the interaction point with tracking systems, calorimeters and muon systems. In this analysis we primarily rely on the tracking subdetectors (Pixel, SCT and TRT) and the MBTS.
The ATLAS inner detector covers the rapidity range|η|< 2.51. It consists of a silicon pixel detector (Pixel), a silicon microstrip detector (SCT) and a transition radiation tracker (TRT). The hits recorded in these detectors are input to the tracking pattern recognition, and are used for this analysis to identify charged particles and to measure their properties.
1When referring to the MBTS or inner detector acceptance ηis defined with respect to the nominal z=0 of the ATLAS detector. Trackηis defined with respect to the track perigee position.
The MBTS detectors are mounted on the front of the LAr endcap calorimeter cryostats at ±z = 3.56 m. They are segmented into eight sectors in azimuth and into two rings in pseudorapidity (2.09 <
|η|<2.82 and 2.82< |η| <3.84). A signal hit in the MBTS detector is defined to be a hit with a charge deposition of> 0.15 pC. This value can be compared to the noise that is well described by a gaussian function with a width of 0.02 pC. A minimum ionizing particle typically deposits a charge of about 0.5 pC.
3 Measurement Strategy
The aim of this measurement is to probe the diffractive contributions to the total cross section both in terms of rate as well as the charged particle kinematic distributions and multiplicities.
We create a sample enhanced in diffractive events by selecting events where there is activity on only the positive or only the negative z side of the MBTS detector. Here activity is defined as a hit in at least one MBTS cell. This requirement preferentially selects single and double diffractive events. Double diffractive events pass the selection if the mass of the diffractive system on one of the two sides is small enough that the particles all escape at|η|>3.84 and thus do not create a signal in the MBTS detector.
For this analysis we further require the events to have a track with a transverse momentum of at least 500 MeVand |η| < 2.5, similar to the inclusive minimum bias measurements at √
s = 0.9 TeV [7] and
√s=7 TeV [8]. We then define the quantity Rssas the ratio of all such events which have at least one hit on exactly one side of the MBTS, the single-sided events (Nss), to the number of such events that have any hit in either side of the MBTS, Nany:
Rss = Nss
Nany (1)
= AS Dss σS D+ADDss σDD+AN Dss σN D
AS DanyσS D+ADDanyσDD+AN DanyσN D (2)
= ADssσD+AN Dss σN D
AanyD σD+AN DanyσN D (3)
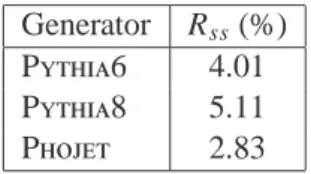
where Assis the acceptance for the single-sided requirement and Aanyis the acceptance for a require- ment of at least one hit in the MBTS detector. ADss, AanyD andσDrefer to the total diffractive contribution, i.e. the combined acceptance and cross section for the single- and double-diffractive components. The various MC generators predict a value between 2.8 and 5.1% for Rss, depending on which model is used, see section 6 for more details.
To investigate the event kinematics we measure the following track and event distributions 1
Nev dNtrk
dη , 1 Nev
1 2πpT
d2Ntrk
dηdpT, 1 Nev
dNev
dntrk, 1 Nev
dNtrk
d∆η
where Nevis the number of events with at least one track satisfying the single-sided MBTS require- ments. pTis the transverse momentum,ηis the pseudo-rapidity of the track, ntrkis the number of selected tracks per event and Ntrkis the total number of selected tracks. ∆ηis the absolute value of the difference in pseudorapidity between the edge of the MBTS detector that has no hit (ηMBT S) and the track, i.e.
∆η=|ηMBT S −η|whereηMBT S is+2.08 or -2.08 depending on which MBTS side did not have any hits.
For this distribution we only show the data whereη > ηMBT S (η < ηMBT S) forηMBT S <0 (ηMBT S > 0).
For single diffractive events and double diffractive events with a large enough rapidity gap such that they satisfy the single-sided MBTS requirement, we expect this variable to be peaked to large∆η.
Generator σDD(mb) σS D(mb) σN D(mb) σinel(mb) (σS D+σDD)/σinel
Pythia 9.3 13.7 48.5 71.5 32.2%
Phojet 3.9 10.7 61.6 76.2 19.2%
Table 1: Cross sections at √
s = 7 TeV for double-diffractive, single-diffractive, and non-diffractive production as used by the default P and P models. Also given are the total inelastic cross section and the fractional contribution of the diffractive processes to it.
These measurements differ from the published Minimum Bias analysis by the fact that they are not corrected for detector effects. Those corrections are beyond the scope of this note but are envisaged before publication of the final results of this analysis. Systematic uncertainties are assessed, and reflect the agreement between data and simulation for the detector and reconstruction.
4 Datasets and Event Selection
The data used in the note come from two ATLAS runs at √
s = 7 TeV taken between March 30th and April 1st corresponding to an integrated luminosity of approximately 23µb−1.
The MC samples used are the P6 MC09 tune [9], and P8 and Pwith default settings.
There is a significant difference in the diffractive modeling between the P6 and P8 generators in that P8 uses pomeron parton distribution functions (pdfs) which allows for a hard diffractive component through parton-parton scattering. P6 uses a soft fragmentation model which does not produce high pT particles easily. Hard diffractive processes have been implemented in Pas well, although not through pomeron pdfs.
The cross sections are given in Table 1. The Pvalues are based on the model by Sj¨ostrand and Schuler from 1994 [10], and are used both in the P6 and the P8 implementation. While the total inelastic cross section agrees within 10% between the two models, Ppredicts a 50% larger diffractive contribution than P.
The Pgenerator in addition implements a “central-diffractive” process where both protons re- main intact and two colorless states are exchanged. This is neglected due to its very small contribution.
All events considered in the analysis must pass the L1 MBTS 1 trigger, which requires a hit in at least one of the MBTS cells, and have at least one reconstructed track fulfilling the following requirements:
• pT >500 MeV
• |η|<2.5
• |dBS0 |<1.5 mm
• |z0|<100 mm
• Npix ≥1
• Nsct ≥6
d0BS is the impact parameter with respect to the beam spot that has been determined for each LHC run in intervals of 10 minutes. z0 is the longitudinal impact parameter with respect of the origin of the detector coordinate system, e.g. the longitudinal center of the detector. This event selection does not require a primary vertex to avoid any bias at low track multiplicity.
For inelastic events that contain at least one track satisfying the above requirements the efficiency of the L1 MBTS 1 trigger requirement is above 97% for each of the inelastic processes. The tracking
efficiency of charged prompt hadrons is about 87% at centralηand falls with increasing|η|to about 65%
at|η|=2.5 [8].
In addition a subset of events (the “single-sided” sample) is selected by vetoing events that have hits on both sides of the MBTS detector.
5 Systematic Uncertainties
The systematic uncertainties in this measurement arise from three principal sources: beam backgrounds, data and MC agreement for the MBTS simulation and the tracking performance.
• The background arising from beam halo and beam gas events is determined using the single, non colliding (unpaired) bunches which traverse ATLAS. In the two runs considered there are 41.5k MBTS triggered events in the unpaired bunches, 39.7k of which have activity on only one side of the MBTS. These numbers can be compared to the 1.4M MBTS triggered events in the paired bunches, 0.2M of which are single sided. Once a track fulfilling all the selection cuts (see Sec. 4) is required we find a total of 52 events passing the MBTS trigger in the unpaired bunches, 1 of which passes the single sided selection. The colliding bunches have 1.2M MBTS triggered events with at least one track passing the selection cuts, with a subset of 53k single sided events. Thus we conclude that the beam background represents less than 1 in 5000, or 0.02% of the number of events selected in the colliding bunches and is thus neglected.
• the systematic uncertainty due to the MBTS detector response is determined by varying the cut value on the charge measured in the MBTS detector between 0.15 and 0.3 pC. The variation was chosen such that it covers any discrepancies observed between data and simulation when studying the MBTS response using tracks. It results in a 14% uncertainty on Rss and a normalization uncertainty of approximately 3% on the track distributions.
The noise modeling of the MBTS detector is also critical as noise hits can potentially spoil the rapidity gap. The noise was studied in data where no beam traversed ATLAS and found to be negligible above the threshold of 0.15 pC.
Lastly, inaccuracies in the modeling of the material between the interaction point and the MBTS detectors can lead to varying MBTS hit rates. We checked the rates in an MC sample with a 20%
increase in the material of the pixel detector services, which are present in the region 2 <|η| <4, and found the effect on the MBTS acceptance to be negligible.
As a cross-check we repeated the measurement requiring the gap to be only on the detector side at z >0 or only on the side at z <0. These should be consistent if the response is the same on both sides. We find that Rssis consistent to within 3% for the two sides.
• the uncertainty due to the tracking efficiency was estimated following the analysis in Ref. [8].
It is dominated by the limited knowledge of the material in the Inner Detector. It results in an uncertainty of about 3% both on Rssand on the track distributions.
6 Results
In this section we present the results both for the rate of the single-sided events, Rss, as well as for the kinematic properties and multiplicity of tracks.
Generator Rss(%) P6 4.01 P8 5.11 P 2.83 Table 2: Predicted values for Rssat √
s=7 TeV for P6, P8 and P. Generator ADD1−trk AS D1−trk A1N D−trk
P6 39.2% 37.0% 97.5%
P8 50.1% 55.6% 97.3%
P 52.2% 63.7% 95.9%
Table 3: Acceptances for events to have at least one track with pT >500 MeV and|η|<2.5 for P6, P8 and Pfor double-diffractive (DD), single-diffractive (SD) and non-diffractive (ND) events at √s=7 TeV.
6.1 Fraction of single-sided events
In this section we discuss the observed fraction of events which have hits only on one side of the MBTS scintillators compared to the total number of events which have at least one hit on either side. In all considered events we require there to be a track passing the selection cuts in Sec. 4. The quantity is called Rssand is defined in Section 3.
In data we measure 52,801 events passing the single-sided selection out of 1,169,508 events passing the any side selection. This gives
Rss =
4.52±0.02(stat.)±0.61(syst.)
%
where the systematic uncertainty accounts for the experimental understanding of the tracking efficiency and the MBTS selection as described in Sec. 5.
This can be compared to the predictions by the MC generators given in Table 2. The data agree well with P8 and P6 while the Pprediction falls short by 70% corresponding to 2.9σ.
Any comparison with the MC programs depends both on the cross sections of the individual parts of the inelastic cross sections and on the acceptance modeling which relies on the particle multiplicity within theηrange covered by the MBTS scintillators as was discussed in Section 3. Ideally one would like to disentangle the cross section from the acceptance but at this moment there are not enough constraints from the data to allow this. Thus we present here a simple comparison where we fix the acceptance from the individual processes and illustrate the effect on the prediction of Rsswhen we vary the relative contribution of the diffractive production modes.
The acceptances of the track requirement are given in Table 3 for the three MC programs. They are about 35-65% for the diffractive and above 95% for the non-diffractive samples.
Table 4 gives the acceptances for the any-sided and single-sided selection for double-diffractive, single-diffractive and non-diffractive events for P6, P8 and P. These acceptances are with respect to the track requirement. So, the total acceptance is obtained by multiplying the numbers from Table 4 with those of Table 3.
It is seen that the acceptance varies between 14% and 27% for the single-sided MBTS requirement for diffractive production while for non-diffractive production the acceptance is in all cases less than 1%.
The acceptances are indeed very similar for the SD process but differ by about a factor two for the DD
Generator DD SD ND ADDany ADDss AS Dany AS Dss AanyN D AN Dss P6 97.2% 23.9% 97.7% 20.7% 99.9% 0.7%
P8 100% 27.0% 100% 22.9% 100% 0.1%
P 97.9% 14.2% 97.8% 22.0% 100% 0.5%
Table 4: Acceptances for events with activity in either side of the MBTS, Aany, and on only one side of the MBTS, Ass, for events at √
s = 7 TeV with at least one track with pT > 500 MeV and |η| < 2.5 for P6, P8 and Pfor double-diffractive (DD), single-diffractive (SD) and non-diffractive (ND) events.
process between the two generators. For the inclusive requirement of any MBTS hit the acceptance is
>97% for all processes and all MC generators.
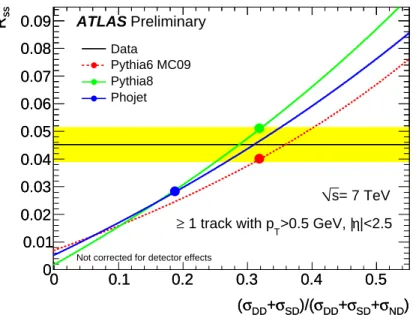
Fig. 1 shows the data compared to the different models as a function of the diffractive contribution to the total inelastic cross section. The acceptances are fixed to the values in Table 4 as are all other properties of the modeling except for the ratio of the total diffractive to total inelastic cross sections.
In particular the ratio of single to double diffractive events is kept fixed. It is seen that the diffractive contribution needs to be increased from 20% to 30% in Pto describe the data. It is interesting that all three acceptance models indicate a contribution of about 30% from the diffractive processes.
ND) σ
SD+ σ
DD+ σ
SD)/(
σ
DD+ σ (
0 0.1 0.2 0.3 0.4 0.5
ssR
0 0.01 0.02 0.03 0.04 0.05 0.06 0.07 0.08 0.09
ND) σ
SD+ σ
DD+ σ
SD)/(
σ
DD+ σ (
0 0.1 0.2 0.3 0.4 0.5
ssR
0 0.01 0.02 0.03 0.04 0.05 0.06 0.07 0.08 0.09
Data
Pythia6 MC09 Pythia8 Phojet
= 7 TeV s
|<2.5 η
>0.5 GeV, | 1 track with pT
≥
Not corrected for detector effects
Preliminary ATLAS
Figure 1: The ratio of events with hits only on one side of the MBTS scintillators to events with any hits in the MBTS scintillators, Rss. The data are shown as the horizontal line and the uncertainty is given by the yellow band. The P6, P8 and Ppredictions are shown as a function of the diffractive contribution to the total inelastic cross section. The values for the cross sections used by these MC programs and the corresponding values of Rssare indicated by the circular markers. The ratio of the single to double diffractive cross sections is held fixed to the generator prediction.
6.2 Track Distributions
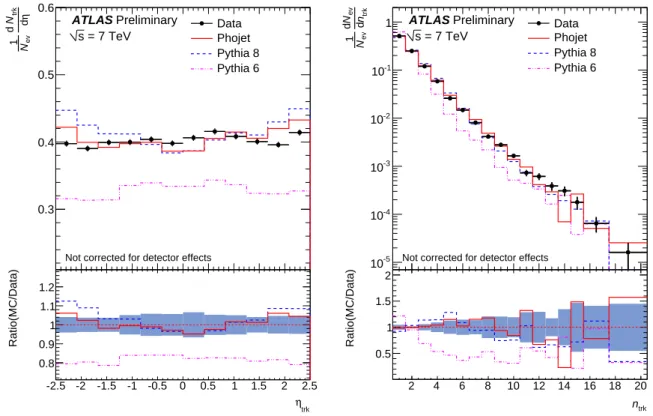
Figures 2 shows the track η and multiplicity distributions for events passing the single-sided MBTS requirement. The data are compared to the P6, P8 and Psamples.
-2.5 -2 -1.5 -1 -0.5 0 0.5 1 1.5 2 2.5
ηd
trkN
d
evN1
0.3 0.4 0.5 0.6
Data Phojet Pythia 8 Pythia 6 = 7 TeV
s
Not corrected for detector effects Preliminary ATLAS
ηtrk
-2.5 -2 -1.5 -1 -0.5 0 0.5 1 1.5 2 2.5
Ratio(MC/Data)
0.8 0.9 1 1.1
1.2 2 4 6 8 10 12 14 16 18 20
trknd
evN
d
evN1
10-5
10-4
10-3
10-2
10-1
1 Data
Phojet Pythia 8 Pythia 6 = 7 TeV
s
Not corrected for detector effects Preliminary ATLAS
ntrk
2 4 6 8 10 12 14 16 18 20
Ratio(MC/Data)
0.5 1 1.5 2
Figure 2: Track distributions for the single sided MBTS requirement. Data are the black points, P
is the solid red line, P8 is the blue dashed line and P6 is the dash-dotted pink line. The left shows N1
ev
dNtrk
dη and the right shows N1
ev
dNev
dntrk. The bottom plots show the ratio of MC to data. In the ratio plot the blue band indicates the quadratic sum of the statistical and systematic uncertainty.
The dntrk/dηdistribution in the data is rather flat and the number of tracks per unit pseudorapidity is about 0.4. It is well modeled by Pand P8 in overall normalization while P6 underesti- mates the data by about 30%.
The ntrkdistribution falls by 5 orders of magnitude over the range of 1 to 20 tracks. It is thus much steeper than that measured in the inclusive sample [8]. It is well modeled both by P8 and P
while the P6 spectrum predicts smaller multiplicities than the data apart from the tail, where the non-diffractive contribution is the most important.
Fig. 3 shows the track N1
ev
1 2πpT
d2Ntrk
dηdpT distribution for data compared to the three MC predictions.
Pis in excellent agreement with the data over most of the pT range. P8 predicts a slightly softer spectrum than that observed in data. P6 is much softer than the data until the very high tail.
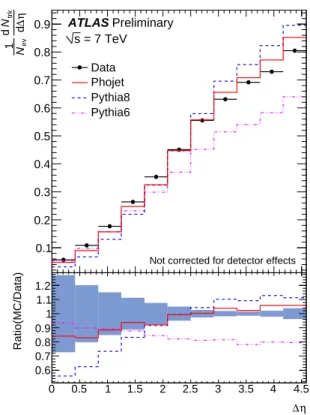
Fig. 4 shows N1
ev
dNtrk
d∆η. It is seen that the rate of tracks increases from 0.05 at ∆η = 0 to 0.8 at the highest ∆η. At low ∆η all three generators describe the data well but at high ∆η where the diffractive processes dominate P6 underestimates the rate of tracks. The uncertainty at low ∆ηis large as the ND component becomes important and it is the most sensitive to the MBTS efficiency because raising the threshold allows double sided events to become single sided events. Additionally the statistical uncertainty is not negligible in this region.
1 2 3 4 5 6
]-2 [GeV Tp d ηd
trkN 2d Tp π2 1 evN1
10-6
10-5
10-4
10-3
10-2
10-1
1
Data Phojet Pythia 8 Pythia 6 = 7 TeV
s
Not corrected for detector effects Preliminary ATLAS
[GeV]
pT
1 2 3 4 5 6
Ratio(MC/Data)
0.5 1 1.5
0.5 0.55 0.6 0.65 0.7 0.75 0.8 0.85 0.9 0.95 1
]-2 [GeV Tp d ηd
trkN 2d Tp π2 1 evN1
0.1 0.2 0.3 0.4 0.5
Data Phojet Pythia8 Pythia 6 = 7 TeV
s
Not corrected for detector effects Preliminary ATLAS
[GeV]
pT
0.5 0.55 0.6 0.65 0.7 0.75 0.8 0.85 0.9 0.95 1
Ratio(MC/Data)
0.6 0.8 1 1.2 1.4
Figure 3: Distributions of N1
ev
1 2πpT
d2Ntrk
dηdpT for the single sided MBTS requirement. Data are the black points, P is the solid red line, P8 is the blue dashed line, and P6 the dash-dotted pink line. Shown is both the distribution as well as the ratio of MC to data. In the ratio plot the blue band indicates the quadratic sum of the statistical and systematic uncertainty. The left plot shows the full pT range, the right plot focuses on the pT < 1 GeV region where the diffractive contribution is most dominant.
In order to understand the origin of the features observed in Figs. 2-4 we plot the distributions for each generator with each of the sub processes plotted separately. Figure 5 shows the η distribution, Figure 6 shows the ntrk, Figure 7 shows the momentum spectrum and Figure 8 shows the∆ηdistribution.
The ηand ∆η distributions best show the relative contributions from the different sub processes to the event sample. P favors single diffractive events whereas the P models favor more similar contributions from both diffractive processes. P8 shows the smallest contribution from ND events.
From the track multiplicity and momentum spectrum plots we see that P6 describes the tails of the distributions entirely with the ND components, whereas P8 and Phave approximately equal contributions of all processes in those regions. This difference is unsurprising given the lack of a hard component to diffraction in P6. Both P8 and Pwould do slightly better in describing the data if there was an increase in the ND component, however Pdescribes the data relatively well in the tails of the pT distribution.
7 Conclusion
In conclusion we have presented measurements enhanced in the diffractive component of the inelastic cross section by selecting events based on the absence of activity in one of the two MBTS detectors in ATLAS at √
s= 7 TeV. The data were compared with several recent MC models in both event rate and
0 0.5 1 1.5 2 2.5 3 3.5 4 4.5
η∆d
trkN
d
evN1
0.1 0.2 0.3 0.4 0.5 0.6 0.7 0.8 0.9
Data Phojet Pythia8 Pythia6 = 7 TeV s
Not corrected for detector effects Preliminary
ATLAS
η
∆
0 0.5 1 1.5 2 2.5 3 3.5 4 4.5
Ratio(MC/Data)
0.6 0.7 0.8 0.9 1 1.1 1.2
Figure 4: Distributions of 1/NevdNtrk/d∆ηfor the single sided MBTS requirement. Data are the black points, P is the solid red line, P8 is the blue dashed line, and P6 the dash-dotted pink line. Shown is both the distribution as well as the ratio of MC to data. In the ratio plot the blue band indicates the quadratic sum of the statistical and systematic uncertainty.
track kinematics. Both the P6 and P8 generators model the rate of the single-sided events quite well. Pand P8 give good descriptions of the track distributions while P6 describes the data less well over most of the measured range. Having determined the detector effects to be the same for data and MC to within our systematic uncertainties, we do not expect correcting for these results to change the conclusions of this study.
References
[1] ATLAS Collaboration, Luminosity Determination Using the ATLAS Detector, ATL-CONF-2010- 060
[2] ATLAS Collaboration, Charged particle multiplicities in pp interactions at sqrt(s) = 0.9 and 7 TeV in a diffractive limited phase-space measured with the ATLAS detector at the LHC and new PYTHIA6 tune, ATL-CONF-2010-031
[3] T. Sj¨ostrand, S. Mrenna, P. Skands, P6.4 Physics and Manual, JHEP 05, 026 (2006), Comput.
Phys. Comm. 178 (2008) 852.
[4] T. Sj¨ostrand, S. Mrenna, P. Skands, A Brief Introduction to PYTHIA 8.1, Comput. Phys. Commun.
178 852-867,2008.
η -2.5 -2 -1.5 -1 -0.5 0 0.5 1 1.5 2 2.5
ηd
trkn
d
evN1
0 0.1 0.2 0.3 0.4 0.5 0.6 0.7
Phojet = 7 TeV s
Not corrected for detector effects
Preliminary
ATLAS Data
MC Sum ND SD DD
η -2.5 -2 -1.5 -1 -0.5 0 0.5 1 1.5 2 2.5
ηd
trkn
d
evN1
0 0.1 0.2 0.3 0.4 0.5 0.6 0.7
Pythia 8 = 7 TeV s
Not corrected for detector effects
Preliminary
ATLAS Data
MC Sum ND SD DD
η -2.5 -2 -1.5 -1 -0.5 0 0.5 1 1.5 2 2.5
ηd
trkn
d
evN1
0 0.1 0.2 0.3 0.4 0.5 0.6 0.7
Pythia 6 = 7 TeV s
Not corrected for detector effects
Preliminary
ATLAS Data
MC Sum ND SD DD
Figure 5: N1
ev
dNtrk
dη for the single sided MBTS requirement. Data are shown in comparison with P
(top left), P8 (top right) and P6 (bottom). The non-diffractive contribution is shown in green diamonds, the single diffractive in red inverted triangles and the double diffractive is shown in blue triangles. The three processes are normalized relative to each other according to the individual MC model predictions. The data are the black points and the summed MC (ND+SD+DD) are the open black circles.
[5] R. Engel, Z. Phys. C 66, 203-214 (1995); R. Engel, J. Ranft, Phys. Rev. D 54, 4246-4262 (1996).
[6] ATLAS Collaboration, G. Aad et al., The ATLAS Experiment at the Large Hadron Collider, JINST 3 (2008) S08003.
[7] ATLAS Collaboration, G. Aad et al., Charged-particle multiplicities in pp interactions at sqrt(s)= 900 GeV measured with the ATLAS detector at the LHC, Phys. Lett. B 688, 21-42 (2010).
[8] ATLAS Collaboration, Charged particle multiplicities in pp interactions at sqrt(s) =7 TeV mea- sured with the ATLAS detector at the LHC, ATL-CONF-2010-024
[9] ATLAS Collaboration, ATLAS Monte Carlo tunes for MC09, ATL-PHYS-PUB-2010-002
[10] G. Schuler and T. Sj¨ostrand, Hadronic diffractive cross-sections and the rise of the total cross- section, Phys. Rev. D 49, 2257-2267, 1994.
ntrk
2 4 6 8 10 12 14 16 18 20
trknd
evN
d
evN1
10-5
10-4
10-3
10-2
10-1
1 10
Phojet = 7 TeV s
Not corrected for detector effects
Preliminary
ATLAS Data
MC Sum ND SD DD
ntrk
2 4 6 8 10 12 14 16 18 20
trknd
evN
d
evN1
10-5
10-4
10-3
10-2
10-1
1 10
Pythia 8 = 7 TeV s
Not corrected for detector effects
Preliminary
ATLAS Data
MC Sum ND SD DD
ntrk
2 4 6 8 10 12 14 16 18 20
trknd
evN
d
evN1
10-5
10-4
10-3
10-2
10-1
1 10
Pythia 6 = 7 TeV s
Not corrected for detector effects
Preliminary
ATLAS Data
MC Sum ND SD DD
Figure 6: N1
ev
dNev
dntrk for the single sided MBTS requirement. Data are shown in comparison with P
(top left), P8 (top right) and P6 (bottom). The non-diffractive contribution is shown in green diamonds, the single diffractive in red inverted triangles and the double diffractive is shown in blue triangles. The three processes are normalized relative to each other according to the individual MC model predictions. The data are the black points and the summed MC (ND+SD+DD) are the open black circles.
[GeV]
pT
1 2 3 4 5 6
]-2 [GeV Tp d ηd
trkn 2d Tp π2 1 evN1
10-6
10-5
10-4
10-3
10-2
10-1
1 10
Phojet = 7 TeV s
Not corrected for detector effects
Preliminary
ATLAS Data
MC Sum ND SD DD
[GeV]
pT
1 2 3 4 5 6
]-2 [GeV Tp d ηd
trkn 2d Tp π2 1 evN1
10-6
10-5
10-4
10-3
10-2
10-1
1 10
Pythia 8 = 7 TeV s
Not corrected for detector effects
Preliminary
ATLAS Data
MC Sum ND SD DD
[GeV]
pT
1 2 3 4 5 6
]-2 [GeV Tp d ηd
trkn 2d Tp π2 1 evN1
10-6
10-5
10-4
10-3
10-2
10-1
1 10
Pythia 6 = 7 TeV s
Not corrected for detector effects
Preliminary
ATLAS Data
MC Sum ND SD DD
Figure 7: N1
ev
1 2πpT
d2ntrk
dηdpT for the single sided MBTS requirement. Data are shown in comparison with P(top left), P8 (top right) and P6 (bottom). The non-diffractive contribution is shown in green diamonds, the single diffractive in red inverted triangles and the double diffractive is shown in blue triangles. The three processes are normalized relative to each other according to the individual MC model predictions. The data are the black points and the summed MC (ND+SD+DD) are the open black circles.
η
∆ 0 0.5 1 1.5 2 2.5 3 3.5 4 4.5
η∆d
trk
d N
evN1
0 0.2 0.4 0.6 0.8 1 1.2
Phojet = 7 TeV s
Not corrected for detector effects
Preliminary
ATLAS Data
MC Sum ND SD DD
η
∆ 0 0.5 1 1.5 2 2.5 3 3.5 4 4.5
η∆d
trkN
d
evN1
0 0.2 0.4 0.6 0.8 1 1.2
Pythia 8 = 7 TeV s
Not corrected for detector effects
Preliminary
ATLAS Data
MC Sum ND SD DD
η
∆ 0 0.5 1 1.5 2 2.5 3 3.5 4 4.5
η∆d
trkN
d
evN1
0 0.2 0.4 0.6 0.8 1 1.2
Pythia 6 = 7 TeV s
Not corrected for detector effects
Preliminary
ATLAS Data
MC Sum ND SD DD
Figure 8: N1
ev
dNtrk
d∆η for the single sided MBTS requirement. Data are shown in comparison with P
(top left), P8 (top right) and P6 (bottom). The non-diffractive contribution is shown in green diamonds, the single diffractive in red inverted triangles and the double diffractive is shown in blue triangles. The three processes are normalized relative to each other according to the individual MC model predictions. The data are the black points and the summed MC (ND+SD+DD) are the open black circles.