ATLAS-CONF-2010-079 11October2010
ATLAS NOTE
ATLAS-CONF-2010-079
20th August, 2010
Early supersymmetry searches in events with missing transverse energy and b-jets with the ATLAS detector
ATLAS collaboration
Abstract
This note describes a first set of measurements of supersymmetry-sensitive vari- ables in heavy-flavour enriched final state events with jets and missing transverse energy, from initial √s=7 TeV proton-proton collisions at the LHC. Events may contain identified leptons (electron, muon) while separate analyses are carried out considering the no-lepton case and the case with additional leptons. The measure- ments are based on 305 nb−1 of data collected with the ATLAS detector. General good agreement is found between data and Standard Model expectations estimated with Monte Carlo simulations.
1 Introduction
Supersymmetry (SUSY) [1] is one of the most compelling theories to describe physics beyond the Standard Model. If supersymmetric particles are present at the TeV-scale, the production of squarks (q) and gluinos (˜ g), superpartners of quarks and gluons and therefore strongly in-˜ teracting particles, constitutes one of the most promising channels for SUSY discovery at the Large Hadron Collider (LHC) [2]. In the framework of minimal supersymmetry (MSSM), the production of third generation squarks could be favoured, as the large mixing between the chiral states of the super-partners of the Standard Model fermions might yield low masses for the lightest scalar bottom and scalar top states. In R-parity conserving SUSY scenarios, the cascade decay of pair-produced gluinos and squarks into quarks and gluons will result in a fi- nal state consisting of several jets plus missing transverse energy, coming from the undetected neutralinos, which are the lightest supersymmetric particles (LSP) in a large variety of models.
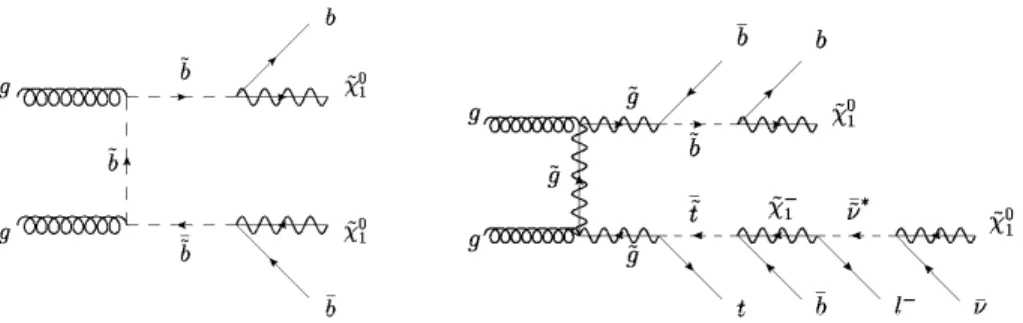
At the LHC, SUSY sparticles such as scalar bottom and scalar top are expected to be pro- duced in pairs (direct production), or through g˜ → ˜bb(˜tt) decays if mg˜ >mq˜+mq. Figure 1 illustrates two possible production mechanisms. Direct pair production of sbottom quarks can lead to a final state consisting of a pair of acoplanar bottom-quark jets (b-jets) and significant ETmiss; in case of gluino pair production, multi-jet final states are expected andb-jets would be copiously produced in the decay chain. Depending on the sparticle mass spectrum, leptons might also be present.
Figure 1: Feynman diagrams of two possible production mechanisms and subsequent decay chain involving third generation squarks: sbottom pair production and sbottom decay into b-quark and neutralinos (left); gluino pair production and decay into˜bband˜tt(right).
The ATLAS collaboration has already reported the observation of theW±andZbosons [3]
and of high transverse-momentum jets [4]. With increasing integrated luminosities it is ex- pected that the LHC experiments should soon be reaching sensitivity for the discovery of su- persymmetric particles [5] exceeding that of experiments at the Tevatron [6] [7] [8]. First com- parisons of data to Monte Carlo simulations for some of the most important kinematic vari- ables for supersymmetry searches involving jets, leptons and missing transverse momentum have already been reported [9] [10].
This note presents a first comparison of data to Monte Carlo simulations for some of the most important kinematic variables for supersymmetry searches involvingb-jets and missing transverse energy, with and without leptons. The identification of jets which originated fromb- quarks (b-tagging) is based on the presence of a displaced vertex due to the decay of abhadron inside the jet. At least oneb-jet candidate is required in the event selection. The measurements in this note are based on data collected in proton-proton collisions at √
s=7TeV at the LHC from March to July 2010. They correspond to a total integrated luminosity of 305 nb−1.
2 The ATLAS Detector
A detailed description of the ATLAS detector can be found in [11]. This analysis uses almost all detector components and the following provides a brief summary.
At the core of the ATLAS detector is the inner tracking detector, which is immersed in a2 T axial field. Silicon pixel and micro-strip detectors provide measurements of charged particle trajectories in the pseudo-rapidity1range|η|<2.5, complemented by a straw tube tracker for
|η|<2.0which enhances electron identification through detection of transition radiation.
Surrounding the solenoidal magnet is the ATLAS calorimetry, covering|η|<4.9. The liquid argon (LAr) electromagnetic calorimeter is divided into a barrel (|η|<1.475) and two endcaps (1.375<|η|<3.2). The surrounding hadronic tile calorimeter is similarly divided into a barrel (|η|<1.0) and two extended barrels (0.8<|η|<1.7). This is complemented by a LAr hadronic endcap calorimeter consisting of two independent wheels per endcap, located behind the elec- tromagnetic endcaps at1.5<|η|<3.2. Forward calorimeters cover the region3.1<|η|<4.9.
They consist of three modules: the first is made of copper-LAr and is optimized for electro- magnetic measurements; the other two are made of tungsten-LAr and measure primarily the energy of hadronic interactions.
The muon spectrometer is composed of separate trigger and high-precision tracking detec- tors immersed in a toroidal field provided by three air-core super-conducting magnets. Re- sistive plate chambers (|η|<1.05) and thin-gap chambers (1.05<|η|<2.4) provide trigger information in the barrel and endcap regions, respectively. Monitored drift tubes provide pre- cision measurements of muon tracks over|η|<2.0, with the cathode strip chambers covering 2<|η|<2.7.
3 Data Sample and Trigger Selection
The data sample presented in this paper was recorded during LHC stable-beam conditions.
Only periods when all detector components relevant for this analysis were fully operational and with their nominal settings are considered. After the application of basic data-quality criteria the selected data sample corresponds to an integrated luminosity of 305 nb−1. The uncertainties on the luminosity have been estimated to be±11% [12].
3.1 Trigger Selection
Different trigger selections are used for each of the channels and efficiencies have been studied.
Here, a brief description of the trigger performance in each case is given.
0-lepton channel In the 0-lepton channel, calorimeter-based triggers are used to select events with high transverse momentum jets. To maximize the number of selected events (and thereby reduce statistical uncertainties), the lowest unprescaled transverse momentum trigger is used.
In this period of data-taking it is achieved with the pT >15 GeV level-1 (L1) trigger, where the jet transverse momentum is measured at the electromagnetic (EM) scale, as described in
1The right-handed coordinate system employed by ATLAS has the nominal interaction point as its origin. The anti-clockwise beam direction defines the positivez-axis, with the polar angleθbeing measured with respect to this axis; pseudo-rapidity is defined asη=−ln tan(θ/2). Thex-axis points towards the centre of the LHC ring,ypoints vertically upwards and the azimuthal angleφin thex−yplane is positive for positivey. Transverse components of momentum (pT), energy (ET) and missing energy (EmissT ) are defined in this plane.
Section 5.1. Higher level triggers, at level-2 (L2) and event filter (EF), were operated in pass- through mode, i.e. all events selected by the L1 trigger were accepted. The efficiency has been measured with data relative to the minimum bias trigger and compared to the Monte Carlo trigger simulation [13]. For the kinematic range in jet transverse momentum considered in this analysis, the trigger selection efficiency is above 99%. The trigger efficiencies in data and simulation agree to better than 1%.
Electron channel The electron channel uses events selected primarily by the L1 calorime- ter trigger requiring electromagnetic objects with pT >5 GeV (L1_EM5), which uses the in- formation provided by the trigger towers in the electromagnetic calorimeter of dimension
∆φ×∆η=0.1×0.1. In order to further reduce the rate, events are also required to pass a high- level trigger chain (EF_g10_loose) selecting electromagnetic objects with transverse energy above 10 GeV at the EM scale in the region of interest indicated by the L1 trigger. The com- bined efficiency of the trigger chain has been measured from independently triggered events.
This efficiency is found to be constant within uncertainties for electrons with pT>15 GeVand equal to(100+0−10)%. The corresponding efficiency from Monte Carlo simulation was found to be(96±3)%, in good agreement with data.
Muon channel The muon channel uses events selected by the L1 triggerL1_MU6, which se- lects events with a hit pattern in the muon chambers consistent with a track with transverse momentum above6 GeVin the region|η|<2.4. The trigger efficiency has been measured [10]
using independently triggered events containing one muon with pT >20 GeV, as for the se- lection used in this analysis described in Section 5.3. For pT >10 GeV, it is measured to be (73±5)% in the region|η|<1.05 and (82±4)% in the region 1.05<|η|<2.4, in agreement with Monte Carlo predictions. The efficiency becomes constant within statistical uncertainties for muons with pTabove 10 GeV.
4 Monte Carlo Simulation
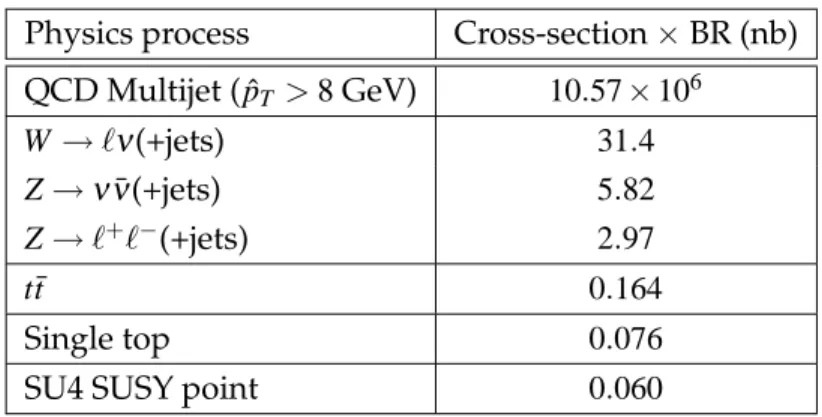
The data analyzed in this paper are compared with the expectations from Monte Carlo sim- ulations of signal and background processes. Generated events are passed through a full GEANT4 [14] simulation of the ATLAS detector and are reconstructed using the same anal- ysis chain as the data [15]. The Monte Carlo samples considered in this study are listed in Table 1, together with the corresponding cross sections of the processes. A detailed description of the samples is given in the following.
QCD multijet production Large samples of QCD multijet events have been generated using the PYTHIA6.4.21 [16] program, which calculates 2→2 matrix elements at leading order in the strong coupling constant. The ATLAS MC09 tune settings described in [17] have been em- ployed. Additional initial and final state radiations are generated by a parton shower algorithm in the leading logarithm approximation. The modified MRST 2007 LO* parton densities [18]
are used as input and five flavours are included, with top quarks being modelled via a ded- icated generator (see below). The simulated QCD multijet samples are normalized to data in dijet control regions as described in Section 7.2. For the single-muon channel, special muon- filtered QCD Monte Carlo samples have been used to reduce the statistical uncertainties. These samples are equivalent to the generic QCD multijet samples but with a filter applied requiring a muon with pT>10 GeV and|η|<2.8 in the event record before detector simulation.
Physics process Cross-section×BR (nb) QCD Multijet (pˆT >8GeV) 10.57×10⁶
W →ℓν(+jets) 31.4
Z→νν(+jets)¯ 5.82
Z→ℓ+ℓ−(+jets) 2.97
t ¯t 0.164
Single top 0.076
SU4 SUSY point 0.060
Table 1: Cross sections of the Standard Model and SUSY benchmark Monte Carlo samples used in this analysis. pˆT is the transverse momentum of the two partons involved in the hard- scattering. The cross sections reported are given at NNLO forW→ℓν,Z→ℓ+ℓ−andZ→νν,¯ at NLO+NLL for t ¯t, at NLO for single top and at leading order for QCD multijet. The cross section for the SU4 point is given at NLO.
Additional samples for QCD multijet processes, simulated with the leading orderALPGEN Monte Carlo program [19], have been used to verify the PYTHIA modeling. The generated events are interfaced with theHERWIG[20] model of hadronisation and theJIMMY[21] model of the underlying event. The CTEQ6L1 [22] parton distribution functions (PDF) are used. At this stage of the analysis, differences between PYTHIA and ALPGEN simulations are within experimental uncertainties, andPYTHIAis adopted as default.
W / Z + jets production The production ofWorZbosons in association with jets is simulated with the ALPGENMonte Carlo program, chosen because of its ability to model multi-parton final states, with CTEQ6L1 PDFs. Up to five partons are generated in slices ofpˆT, the transverse momentum of the hard process. The generated events are interfaced to HERWIGandJIMMY for final state parton showers and underlying event simulation, respectively. The samples are normalized to the integrated luminosity using the cross sections shown in Table 1, based on Next-to-Next-to-Leading Order (NNLO) QCD calculations from the FEWZ program [23].
Top production Top production includes pair and single top processes. In both cases, events are generated using theMC@NLO program [24] which includes full next-to-leading order cor- rections to the matrix element for the hard process. Final state parton showers and the un- derlying event are simulated via interfaces toHERWIGandJIMMY, respectively. A top mass of 172.5 GeV is assumed. Thet ¯tcross section is normalized to the Next-to-Leading Order (NLO) result including next-to-leading-log resummation corrections (NLO+NLL) [25]. The CTEQ6.6 NLO parton set is used in both single and pair top samples for the matrix element, the parton shower and the underlying event.
SUSY signal Expected events and kinematic distributions are compared for illustrative pur- poses to the prediction from a supersymmetric benchmark scenario in the minimal model of supergravity (mSUGRA). Events are generated using HERWIG++[26] according to the mass spectrum and branching ratios calculated byISAJET[27] for the parameters of this point in
mSUGRA space (referred to as SU4). The parameters2at the grand unification (GUT) scale are m0=200GeV,m1/2=160GeV,A0=−400GeV,tanβ=10andµ>0. This point lies in a region of parameter space that is just outside the exclusion of the Tevatron experiments [6]. The squark masses are degenerate for the first and second generation and are predicted to be 410 GeV. The gluino mass is 420 GeV. The lightest squarks are predicted to be the lightest scalar bottom and scalar top quarks (b˜1 andt˜1) with masses of 361 GeV and 196 GeV, respectively. The MRST 2007 LO* parton densities are used. The inclusive SUSY production cross section is calculated at leading order byHERWIG++to be 42.3 pb, and usingPROSPINO[28] at next-to-leading order to be 59.9 pb.
5 Lepton, Jet, b-jet and E
TmissReconstruction
The final state topologies expected from the production of squarks and gluinos and their subse- quent decays are dominated by jets and missing transverse energy. In addition, depending on the SUSY parameters, the presence of leptons in the final state due to intermediate charginos and neutralinos in the cascade decay processes is also possible. To select b-jets final states, the Secondary Vertex SV0 [29] b-tagging algorithm based on the reconstruction of secondary vertices within the jet cone is employed. In order to classify events in different exclusive chan- nels, the same object definition and identification criteria are used in the 0-lepton and 1-lepton channel analyses.
5.1 Object Selection
The following object selections define the particle candidates used in the analyses. These crite- ria are similar to those used in Ref. [5] but have been further refined to improve the rejection of non-collision backgrounds and to reduce possible undesired detector effects.
Jets are reconstructed using the anti-kt algorithm [30] with four-momentum recombination and distance parameterR=0.4(inη–φ space) which is appropriate for the typical large jet multiplicity of supersymmetric events. Inputs to the jet algorithm are topological clus- ters in the calorimeters, measured at the electromagnetic scale. The EM scale does not account for instrumental (detector) effects, such as calorimeter non-compensation and energy losses in inactive regions of the detector, and for inefficiencies in clustering and jet reconstruction. Jets are therefore calibrated to the hadronic energy scale using pT andη dependent correction factors obtained from simulation [31].
A small fraction of jets result from calorimeter noise, out-of-time energy depositions in the calorimeters, or from cosmic ray energy deposits. These misidentified jets have different properties compared to real jets arising from parton fragmentation. A set of requirements (referred to as ’clean up cuts’) has been identified in dedicated studies [32] to ensure a good quality of the reconstructed jets. Jets are considered to be misidentified (or low quality) if at least one of the following criteria is fulfilled.
• The fraction of jet energy in the hadronic endcap calorimeter is larger than 0.8 and the number of calorimeter cells containing 90% of the jet energy is less than 6.
2In mSUGRA, the mass spectrum of sparticles is determined by five parameters: the common scalar and gaugino masses at the GUT scale, m0and m1/2, respectively; the common trilinear coupling at the GUT scale, A0; the sign of the Higgsino mixing parameter,µ; and the ratio of the Higgs vacuum expectation values, tanβ.
• The fraction of the energy in the hadronic endcap is greater than1−Q, whereQis a quality factor based on the signal pulse shape.
• The electromagnetic energy fraction is larger than 0.95 and the pulse shape is very inconsistent with the reference shape (Q>0.8).
• The jet timing differs by more than 50 ns from the expected value for particles from collisions.
The fraction of events containing at least one misidentified jet with pEMT >10 GeV and
|η|<4.9is 5×10⁻⁵. These events are removed from the analyses. No additional cuts are applied to remove possible remaining non-collision backgrounds, as these are suppressed by the event selections described in Section 6.
The event pre-selection requires two jets withpT>20 GeV and|η|<2.5. Any jets passing this loose selection are considered when applying the object identification described in Section 5.2. Higher pT cuts are required for jets entering the final selections described in Section 6.
Electrons are reconstructed by algorithms that provide good discrimination between isolated electrons and misidentified hadronic jets. Medium-purity selections based on calorimeter shower shape variables combined with track information are used. Electrons are required to have pT >10 GeV and |η|<2.47. Events with electron candidates pointing to the calorimetric regions around the transition between the barrel and the endcap (1.37<|η|<
1.52) are removed. In the following, this selection is referred to as ’electron fiducial cut’.
In addition, electrons are required to be isolated, that is the calorimeter transverse energy around the electron within a cone of∆R= p
∆φ2+∆η2=0.2should be less than 10 GeV.
Muons are reconstructed by an algorithm which performs a statistical combination of a stand- alone track reconstructed in the muon spectrometer with a matched track in the inner detector. Muons are required to havepT>10GeV and|η|<2.4. The association between the stand-alone and inner-detector tracks is performed using a χ2-test defined from the difference between the respective track parameters weighted by their combined covari- ance matrices. A χ2 less than 100 is required for muon candidates in this analysis. To ensure isolation, the energy deposition in the calorimeter in a cone of radius ∆R=0.2 around the muon track is required to be less than 10 GeV.
Missing Transverse Energy (ETmiss) , also referred to as missing transverse momentum, is com- puted from calorimeter cells belonging to topological clusters at the electromagnetic en- ergy scale [33]. The transverse missing momentum(x,y) components andETmiss are de- fined by
Exmiss≡ −
Ncell i=1
∑
Eisinθicosφi, Eymiss≡ −
Ncell i=1
∑
Eisinθisinφi
ETmiss≡ q
(Exmiss)2+ Eymiss2
,
where the sum is over topological cluster cells within the pseudo-rapidity range|η|<4.5.
In the muon channel, the transverse momentum of the well-isolated muon selected in the analysis (pT >20 GeV, see Section 6) is added – vectorially – to the(x,y) components of the missing transverse energy3.
3Using the EM scale signals for all cells to reconstructETmissdoes not yield an optimal measure for the real missing transverse energy, in particular in the presence of jets. A more refined measurement ofETmiss, based on dedicated calibration factors for the various physics objects, is now available and will be used in the next stage of the analysis.
Missing Transverse Energy Significance (MetSig) is defined as the ratio of theETmissdescribed above and the square root of the sum of the transverse energy deposited in the calorimeter cells at the electromagnetic energy scale. For the muon channel, the transverse momen- tum of the selected muons is consistently included in theMetSigcalculation.
MetSig≡ETmiss/
q
∑
ETEffective Mass (Meff) is constructed from the highest pT jets in the event (njet, up to a maxi- mum of four jets), theETmissand thepTof leptons (nlep) withpT>20 GeV.
Meff≡ETmiss+
njet
∑
i=1
|p(i)T |+
nlep
∑
j=1
|q(Tj)|
Transverse Mass (MT) is used in the lepton channels and is constructed from the highest pT
lepton, withpT>20 GeV, and theETmissas follows:
M2T≡2|pℓT||ETmiss| −2pℓT·E~Tmiss.
5.2 Overlap Removal
In the process of identifying physical objects, a classification is needed to resolve ambiguities.
Based on previous studies [34], the criteria to remove the overlap use the radial distance ∆R and are applied in the following order:
1. If an electron and a jet are found within∆R<0.2, the object is interpreted as an electron and the overlapping jet is ignored.
2. If a muon and a jet are found within∆R<0.4, the object is treated as a jet and the muon is ignored.
3. If an electron and a jet are found within0.2<∆R<0.4, the object is interpreted as a jet and the nearby electron is ignored.
5.3 b-tagging
The identification of jets which originated fromb-quarks (b-tagging) is based on the presence of a displaced vertex due to the decay of a b hadron inside the jet. The secondary vertex based SV0 tagger, whose performance on data has been reported in [29], is employed. SV0 is a lifetime-based b-tagger algorithm which explicitly reconstructs secondary vertices from tracks associated with a jet. The definition of an ’operating’ point for the algorithm involves placing a threshold on the signed decay length significance of the reconstructed secondary ver- tex (L/σ(L), whereL is the decay length andσ(L)the resolution). This quantity is sometimes referred to as “weight” (w). The sign ofL/σ(L)is given by the projection of the decay length on the jet axis. A list of tracks associated to the calorimeter jet is provided as input to the algorithm, which starts by reconstructing two-track vertices significantly displaced from the primary vertex in three dimensions. Input tracks are not allowed to be associated to multiple jets but only to the closest one (∆R(jet−track)<0.4).
Candidate jets forb-tagging considered in this analysis are required to have pT>30 GeV and |η|<2.5. To achieve a good rejection against charm- and light-quark (u,d,s) or gluon- originated jets and, at the same time, keep a reasonable efficiency for b-quark jets, a signed
L/σ(L)value greater than 6 has been chosen to identifyb-jets. Based on Monte Carlo simulation studies of QCD multijet and top pair production samples, this value corresponds to an average b-tagging efficiency of 45-50%. Due to the dependence of the tagging algorithm on the pT andηof the jet candidates, different average performances are expected for physical processes leading to different event topologies. Figure 2 shows theb-tagging efficiency and the tagging efficiency foru,d,s-quark or gluon jets (light-jet tagging efficiency) as a function of jets pT and
|η| for QCD multijet andt ¯tproduction processes. Efficiencies for SU4 signal samples are also shown for illustration. Theb-tagging efficiency varies from40%at low pTto65%at higherpT, with a light-jet tagging efficiency at the level of1%−2%.
[GeV]
jet pT
0 50 100 150 200
b-jet tagging efficiency
0 0.2 0.4 0.6 0.8 1
t t
SUSY(SU4) QCD SV0 algorithm
(L) > 6.0) σ (Signed L/
ATLAS Preliminary
(a)b-tagging efficiency as a function of jetpT.
η| jet |
0 1 2
b-jet tagging efficiency
0 0.2 0.4 0.6 0.8 1
t t
SUSY(SU4) QCD SV0 algorithm
(L) > 6.0) σ (Signed L/
ATLAS Preliminary
(b) b-tagging efficiency as a function of jet|η|.
[GeV]
T
jet p
0 50 100 150 200
light-jet tagging efficiency
0 0.01 0.02 0.03 0.04 0.05
t t
SUSY(SU4) QCD SV0 algorithm
(L) > 6.0) σ (Signed L/
ATLAS Preliminary
(c) Light-jet efficiency as a function ofpT
η| jet |
0 1 2
light-jet tagging efficiency
0 0.01 0.02 0.03 0.04 0.05
t t
SUSY(SU4) QCD SV0 algorithm
(L) > 6.0) σ (Signed L/
ATLAS Preliminary
(d) Light-jet efficiency as a function of|η|
Figure 2: Monte Carlo efficiencies of b-tagging (top) and light-jet tagging (bottom) for pT >
30 GeV jets, as obtained with SV0 tagger with threshold greater than 6, as a function of pT
(left) and|η| (right) fort ¯t, SU4 and QCD multijet samples.
6 Event Selection
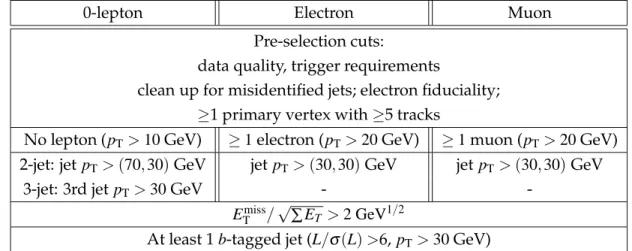
Typical event selection requirements for SUSY searches have been extensively discussed in previous studies [35] based on Monte Carlo simulations. For the purpose of this analysis, in which a first comparison of data to Monte Carlo is made for key observables, a looser set of selections, as defined in Table 2, is employed. Pre-selection requirements are similar for no
lepton, electron and muon final states and include: rejection of events with misidentified jets (’clean up cuts’); rejection of events with reconstructed electrons pointing to the calorimeter barrel–endcap transition region1.37<|η|<1.52(’electron fiducial cut’); and rejection of events with no primary reconstructed vertex with at least five associated tracks. The selections specific to the different channels are reported in the following.
0-lepton Electron Muon
Pre-selection cuts:
data quality, trigger requirements
clean up for misidentified jets; electron fiduciality;
≥1 primary vertex with≥5 tracks
No lepton (pT>10GeV) ≥1electron (pT>20GeV) ≥1muon (pT>20GeV) 2-jet: jet pT>(70,30)GeV jetpT>(30,30)GeV jetpT>(30,30)GeV
3-jet: 3rd jetpT>30GeV - -
ETmiss/√∑ET >2 GeV1/2
At least 1b-tagged jet (L/σ(L)>6,pT>30GeV)
Table 2: Event selection for the different final states considered: 0-lepton (2- and 3-jet selec- tions),≥1 electron and≥1 muon.
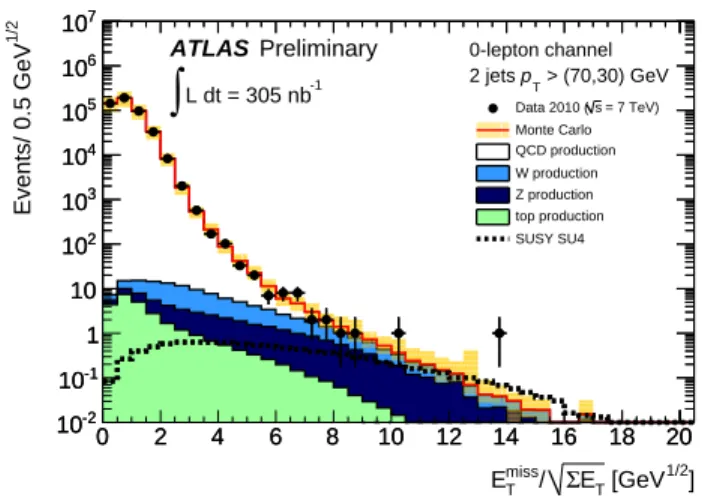
Final states with no leptons (0-lepton channel) Events are selected to have a leading jet of pT>70GeV in order to reduce uncertainties due to trigger threshold effects, and at least one additional jet with pT>30 GeV. All jets are required to have|η|<2.5. In order to define ex- clusive channels, events with electrons (muons) with pT>10GeV and|η|<2.47(|η|<2.4) are rejected. For the 3-jet topology, thepTof the third leading jet is required to be above 30 GeV. The sample of interest (’signal’ region) is defined by selecting events withMetSig>2 GeV1/2, imple- mented to reject part of the Standard Model background. An event selection based onMetSig rather than onETmissreduces the dependence on the energy scale. At the moment, this choice is preferred since ETmiss is calibrated at EM scale whilst the jets are corrected to the hadronic energy scale. The correlation between theMetSigandETmissis such that a threshold onMetSig of 2 GeV1/2approximately corresponds to a cut onETmissof about 30 GeV.
The lowMetSigregion is considered as ’control’ sample and used to estimate the normaliza- tion of the QCD multijet predictions from Monte Carlo simulation, as described in Section 7.2.
Finally, at least one b-tagged jet, defined as in Section 5.3, is required among all jets with pT
above 30 GeV.
Final states with at least one lepton (electron/muon channel) These events are defined by the presence of at least one electron (muon) with pT>20GeV. Electron candidates are required to have|η|<2.47, muon candidates to have|η|<2.4. In both cases, the transverse momentum cuts are chosen to minimize possible trigger threshold effects. In addition, two jets of pT >
30GeV andMetSig>2 GeV1/2are required, together with the presence of at least 1b-tagged jet.
If the event includes a muon with pT >20 GeV, the transverse momentum is added to the ETmiss andMetSigcalculations, as described in Section 5.1.
7 Normalization of QCD Background
QCD multijet processes constitute the dominant background for this analysis. These processes are estimated with thePYTHIAQCD Monte Carlo, which is only leading order in the strong coupling constant and therefore not expected to correctly describe the absolute normalization of the QCD cross section. Thus, dedicated control regions are defined for each of the channels to determine the QCD normalization from data.
7.1 No-Lepton Final States
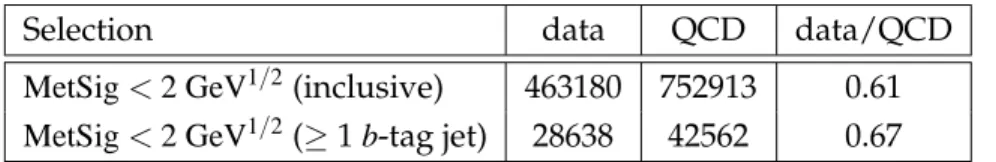
The control region for the 0-lepton channel is identified by requiring all the events to pass the dijet selection and to have MetSig<2 GeV1/2. This region is dominated by QCD multi- jet production and negligible contributions from other processes such as top andW/Zbosons plus jets production are expected. The ratio between data and QCD Monte Carlo estimation is found to be 0.61, with negligible statistical uncertainties. Figure 3 shows the MetSigdistri- bution for events with two jets of pT >70 GeV and pT >30 GeV after the preselection cuts, once the normalization factor is applied. Good agreement between data and Standard Model expectation is found over the entire range. The band includes the statistical and systematic uncertainties.The data/QCD Monte Carlo ratio can be determined before and after requiring at least one b-tagged jet in the events. The normalization values obtained with the two sam- ples – in the following, referred to as “inclusive” and “b-tag”, respectively – are compared and the difference is accounted for as a systematic uncertainty. Such differences might arise from discrepancies in terms ofb-tagging performance between data and Monte Carlo and from an imperfect modelling of heavy-flavour production in the QCD multijet Monte Carlo simulation (see Section 8). Table 3 summarizes the number of events from the data and thePYTHIAQCD Monte Carlo prediction before and after requiring at least 1b-tag jet withpTabove 30 GeV and
|η|<2.5.
Selection data QCD data/QCD
MetSig<2 GeV1/2(inclusive) 463180 752913 0.61 MetSig<2 GeV1/2(≥1b-tag jet) 28638 42562 0.67
Table 3: Number of events observed in the data and thePYTHIAprediction in QCD-dominated control samples.
7.2 One-Lepton Final States
The strategy used to obtain the absolute normalization of the QCD multijet PYTHIA sample to data is similar to the procedure applied for the 0-lepton channel. However, in this case the presence of electroweak and top production contributions is non-negligible. Thus, the con- trol region has been defined to be orthogonal to the signal regions by reversing the MetSig requirement, and applying an extra cut on the transverse mass,MT, between the lepton and the ETmiss.The resulting control sample contains events with at least one lepton, 2 jets with pT>30 GeV,MT<40GeV andMetSig<2 GeV1/2. The selected samples in the electron and muon case are expected to be dominated by QCD multijet production. The remaining non-QCD back- ground contributions estimated from Monte Carlo are of the order of a few percent and are subtracted from the number of data events when normalizing the QCD sample. The normal- ization factors obtained in this way are shown in Table 4. Since the normalization is meant to
1/2] [GeV ET
Σ
miss/ ET
0 2 4 6 8 10 12 14 16 18 20
1/2 Events/ 0.5 GeV
10-2
10-1
1 10 102
103
104
105
106
107
0-lepton channel > (70,30) GeV pT
2 jets
= 7 TeV) s Data 2010 ( Monte Carlo QCD production W production Z production top production SUSY SU4
L dt = 305 nb-1
∫
0 2 4 6 8 10 12 14 16 18 20
10-2
10-1
1 10 102
103
104
105
106
107
ATLAS Preliminary
Figure 3: Missing Transverse Energy Significance (MetSig) distribution for events passing dijet selection. The data are compared to Standard Model expectations obtained from Monte Carlo samples after applying the normalization factor for the QCD background. No b-tagging re- quirement is implemented at this stage. The yellow band indicates the total systematic uncer- tainty (see Section 8). For illustration, the SU4 supersymmetry benchmark point is also shown:
negligible contribution in the control region is expected.
Selection data QCD non-QCD (data – non-QCD) /QCD
Electron channel 353 1070±170 7.23±0.07 0.32±0.05
Electron channel afterb-tagging 15 70±20 0.65±0.01 0.21±0.08
Muon channel 70 143±5 5.07±0.06 0.45±0.05
Muon channel afterb-tagging 9 29±2 0.55±0.01 0.30±0.10
Table 4: Number of events in data and Monte Carlo predictions for the control region used to normalize the QCD multijet background. The control region is defined by MT<40 GeVand MetSig<2GeV1/2. Results are also given with the extra requirement of at least oneb-tagged jet with pT>30GeV and|η|<2.5. The normalization factors are calculated after subtracting from the data the non-QCD background predicted by the Monte Carlo.
include possible effects due to electron and muon misidentification, the factors are derived sep- arately for each lepton species, and are different from those obtained in the 0-lepton channel.
In the case of the muon channel, the QCD muon-filtered Monte Carlo samples, described in Section 4, have been considered. Normalization values have been also compared after the re- quirement of at least oneb-tagged jet withpT>30GeV and|η|<2.5. In this case, the statistical fluctuations are higher and the resulting factors for the two samples are compatible.
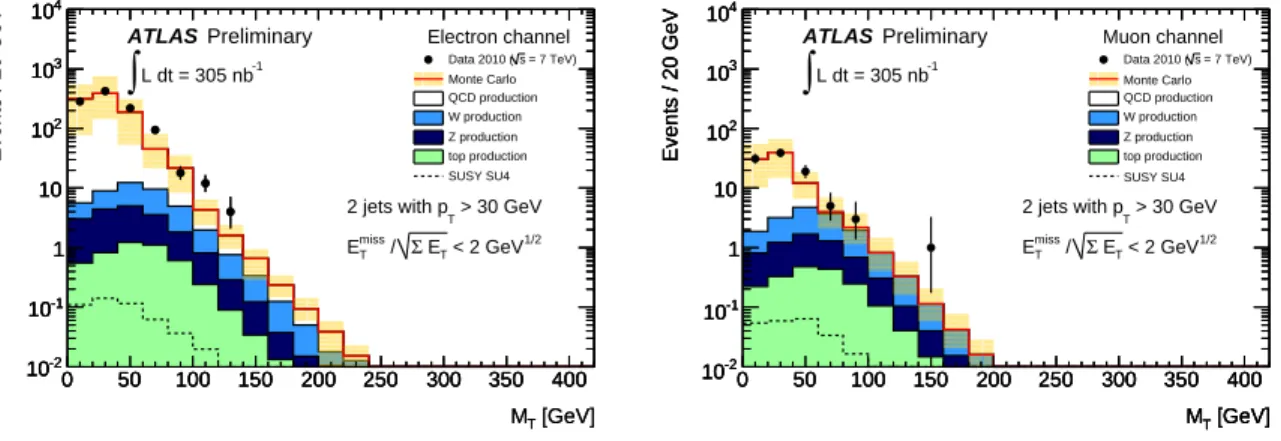
Figure 4 shows the transverse mass for electron and muon final states in the control samples defined byMetSig<2GeV1/2and after the corresponding QCD Monte Carlo normalization fac- tors from inclusive control regions have been applied. Agreement between data and Standard Model expectation is observed in the entire range.
[GeV]
MT
0 50 100 150 200 250 300 350 400
Events / 20 GeV
10-2
10-1
1 10 102
103
104
= 7 TeV) s Data 2010 ( Monte Carlo QCD production W production Z production top production SUSY SU4
L dt = 305 nb-1
∫
Electron channel> 30 GeV 2 jets with pT
< 2 GeV1/2
ET
Σ
miss / ET
ATLAS Preliminary
0 50 100 150 200 250 300 350 400 10-2
10-1
1 10 102
103
104
[GeV]
MT
0 50 100 150 200 250 300 350 400
Events / 20 GeV
10-2
10-1
1 10 102
103
104
[GeV]
MT
0 50 100 150 200 250 300 350 400
Events / 20 GeV
10-2
10-1
1 10 102
103
104
= 7 TeV) s Data 2010 ( Monte Carlo QCD production W production Z production top production SUSY SU4
Muon channel L dt = 305 nb-1
∫
> 30 GeV 2 jets with pT
< 2 GeV1/2
ET
Σ
miss / ET
ATLAS Preliminary
[GeV]
MT
0 50 100 150 200 250 300 350 400
Events / 20 GeV
10-2
10-1
1 10 102
103
104
[GeV]
MT
0 50 100 150 200 250 300 350 400
Events / 20 GeV
10-2
10-1
1 10 102
103
104
Figure 4: MT distribution for events in electron (left) and muon (right) samples, for MetSig
<2GeV1/2. The data are compared to Standard Model expectations obtained from Monte Carlo samples after applying the normalization factors for the QCD background. Nob-tagging re- quirement is implemented at this stage. The yellow band indicates the total systematic uncer- tainty (see Section 8). For illustration, the SU4 supersymmetry benchmark point is also shown:
negligible contribution in the control regions is expected.
8 Systematic Uncertainties
Several sources of systematic uncertainties on the Standard Model prediction have been stud- ied, and are added in quadrature for the estimation of the total uncertainty.
Jet Energy Scale The uncertainty associated with the jet energy scale has been estimated us- ing a parametrization of this scale as a function of jet pTandη[31]. The jet energy scale uncer- tainties vary between10%for jets in the range20 GeV<pT<60 GeVand7%for jets at higher pT. The effects of energy scale changes have been determined by rescaling jet energies and momenta in all Monte Carlo simulated samples. A coherent recalculation of theETmisswith the rescaled energies of the clusters associated with the jets is also performed.
The resulting systematic uncertainty on the number of expected events from Standard Model processes is approximately 30% for both 0-lepton and 1-lepton channels after all se- lections. However, the current estimate of the jet energy scale uncertainty is conservative, and will soon be reduced by using in−situ methods. An additional uncertainty of about 1% is considered to account for the uncertainties due to extra proton-proton interactions in the same bunch crossing (in-time pile-up). No specific corrections or additional uncertainties on theb- jets energy scale are applied at this stage, since the effects are expected to be small compared to the jet energy scale uncertainties.
Unclustered energy A 20% fully correlated uncertainty is applied to take into account the MetSigsensitivity to the underlying event and to the energy of calorimeter cells not contained within the jets. The uncertainty is estimated in the large statistics 0-lepton channel sample, comparing the predictions of the nominal QCD multijet Monte Carlo with those obtained with aPYTHIAsample with increased activity from multiple parton interactions (ATLAS MC08 tun- ing, see [17]). The 20% uncertainty is applied to the 0- and 1-lepton channels.
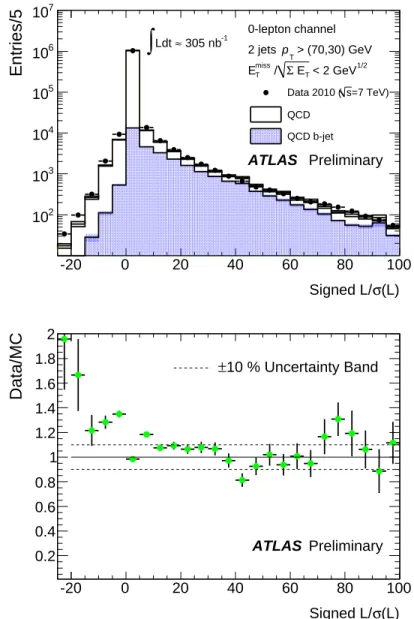
Tagging performance The differences between the tagging algorithm performance in data and in Monte Carlo simulation are taken as systematic uncertainties, using the large statistics of “inclusive” and “b-tag” control samples for the 0-lepton channel (see Section 7.2). These differences are quantified using the signedL/σ(L)distribution. Figure 5 shows the distribution of L/σ(L) for all jets with pT >30 GeV after the inclusive dijets selection for data and Monte Carlo in the lowMetSigcontrol sample and after applying the global normalization factor 0.61.
For illustration, theb-jet content of the QCD multijet Monte Carlo is also reported. Deviations of∼30%are observed in the negativeL/σ(L)region, which is mostly dominated by light-quark jets. However, in the positiveL/σ(L)region this effect is mitigated by the larger presence of real b-jets. Thus, deviations from unity for the ratio between data and Monte Carlo are estimated in the region withL/σ(L)>6 (b-tag candidates) and are found to be of the order of 10%.
This estimation of the uncertainties does not take into account possible differences between control and signal regions in terms of realb-jet content and in terms of light-jets tagging effi- ciency. The latter is estimated as the fraction of events with at least one jet with negative signed L/σ(L). Such fraction is found to be larger in the signal region with respect to the control region by a factor 1.16. This value is smaller than the difference between the realb-jet content in the control and in the signal regions, which is found to be a factor of 2. Thus, assuming that the uncertainty on the deviation between data and Monte Carlo is driven by the efficiency of tag- ging realb-jets, the 10% uncertainty has been conservatively enlarged by this factor, providing an overall 20% uncertainty on the tagging performance.
Further checks in the control sample show that the QCD Monte Carlo prediction is in gen- eral agreement with data for the kinematic range explored in this analysis within uncertainty.
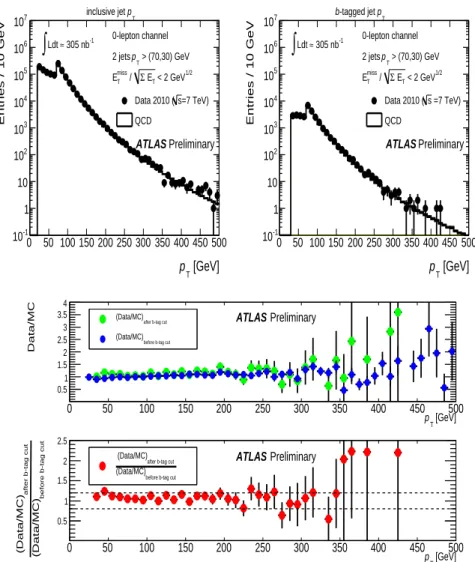
As an example, Figure 6 shows the inclusive jet pTdistribution in data and QCD Monte Carlo before and afterb-tagging requirements, for events in the control sample after applying the nor- malization factor, as well as their ratios. At highpT(>200 GeV) the jet spectrum shows a slight underestimation of PYTHIA predictions with respect to data, as expected from a LO Monte Carlo. The double ratio shows that differences in tagging performance in data and simulated events are within 20% uncertainty.
The 20% uncertainty is consistently applied to all the Standard Model Monte Carlo contri- butions in the 0- and the 1-lepton channels.
Normalization of the QCD background For the 0-lepton channel, the uncertainty on tagging performance is dominant, therefore no additional uncertainties have been applied. For the 1- lepton channels, a total uncertainty of 50% is applied to the QCD normalization factors, to take into account also possible differences between data and Monte Carlo in terms of lepton identification efficiency [10].
Luminosity As the QCD multijet Monte Carlo predictions are normalized to data, there is no need to apply any luminosity systematics to this contribution. For all other backgrounds a luminosity uncertainty of±11% is assigned.
Non-QCD backgrounds The uncertainties on the normalization of associated production of W/Z boson and jets and top production backgrounds will be determined with data-driven techniques when more data are acquired. At this stage, a conservative uncertainty of 60%is assumed for associated production of boson and jets, to take into account uncertainties on the predicted cross sections, on the modeling of the initial- and final-state soft gluon radiation, and on the PDFs. No additional systematics are assigned to the top production, since they are neg-
ligible compared to the jet energy scale, tagging and luminosity uncertainties.
PYTHIAMonte Carlo predictions for QCD multijet processes have been compared to those from ALPGENsamples. Differences in shape for distributions measured in this analysis have been found to be small compared to the total experimental uncertainties. Thus, no attempt has been made to assign uncertainties on the normalization factor related to the predictions of different QCD Monte Carlo generators.
The resulting relative systematic uncertainties on the Standard Model expectations after applying all selections are collected in Table 5 for the 0-lepton and 1-lepton channels.
σ(L) Signed L/
-20 0 20 40 60 80 100
Entries/5
102
103
104
105
106
107
=7 TeV) s Data 2010 ( QCD QCD b-jet 305 nb-1
≈
∫
Ldt 0-lepton channel > (70,30) GeV pT2 jets
< 2 GeV1/2
ET
Σ
miss / ET
ATLAS Preliminary
σ(L) Signed L/
-20 0 20 40 60 80 100
Data/MC
0.2 0.4 0.6 0.8 1 1.2 1.4 1.6 1.8 2
10 % Uncertainty Band
±
ATLAS Preliminary
Figure 5: Signed decay length significanceL/σ(L)of the reconstructed secondary vertex for all jets in events passing the dijet event selection cuts andMetSig<2 GeV1/2, for data and Monte Carlo (MC) expectations. The ratio data/MC is also shown on the bottom.
[GeV]
pT
0 50 100 150 200 250 300 350 400 450 500
Entries / 10 GeV
10-1
1 10 102
103
104
105
106
107
=7 TeV) s Data 2010 ( QCD 0-lepton channel
> (70,30) GeV pT
2 jets
< 2 GeV1/2
ET
Σ /
miss
ET
305 nb-1
≈
∫
LdtpT
inclusive jet
ATLAS Preliminary
[GeV]
pT
0 50 100 150 200 250 300 350 400 450 500
Entries / 10 GeV
10-1
1 10 102
103
104
105
106
107
=7 TeV) s Data 2010 ( QCD 0-lepton channel
> (70,30) GeV pT
2 jets
< 2 GeV1/2
ET
Σ /
miss
ET
305 nb-1
≈
∫
LdtpT
-tagged jet b
ATLAS Preliminary
[GeV]
pT
0 50 100 150 200 250 300 350 400 450 500
Data/MC
0.5 1 1.5 2 2.5 3 3.5 4
after b-tag cut
(Data/MC)
before b-tag cut
(Data/MC)
ATLAS Preliminary
[GeV]
pT
0 50 100 150 200 250 300 350 400 450 500
before b-tag cut(Data/MC)
after b-tag cut(Data/MC)
0.5 1 1.5 2 2.5
before b-tag cut
(Data/MC)
after b-tag cut
(Data/MC) ATLAS Preliminary
Figure 6: Inclusive jet pT distribution (left) andb-tagged jet pT distribution (right) for events in the lowMetSig0-lepton control sample. The middle plot shows the ratio between data and QCD dijet Monte Carlo (MC) expectations and the bottom plot shows the double ratio. The dashed band indicates the final 20% systematic uncertainty assigned to tagging performance.
Source of uncertainty 0-lepton 1-lepton Jet Energy Scale (including pile-up) ∼ ±30% ∼ ±25%
Unclustered Energy ±20% ±20%
Tagging Performance ±20% ±20%
Lepton Identification Performance – ±50%
Luminosity ±11% ±11%
Theory ±60% ±60%
Table 5: Relative systematic uncertainties on the Standard Model expected number of events after all selections are applied for the 0-lepton and 1-lepton channels. Uncertainties on lepton identification performance are applied to QCD background only via normalization factors. Un- certainties on the luminosity are applied on non-QCD backgrounds only. Uncertainties on the theory refer to W/Z boson plus jets production as explained in the text.
9 Results and Distributions for the 0-Lepton Channel
In this section, events observed in data are compared to the number of events expected from Standard Model and SU4 SUSY processes as estimated in Monte Carlo simulation, for the 0- lepton selection. Distributions of most relevant quantities are shown after the final event selec- tion is applied, for 2-jet and 3-jet topologies.
9.1 2-jet Selection
The number of events in the data and the overall expectation from Standard Model processes are shown in Table 6 after each event selection step for the dijet selection of the 0-lepton chan- nel. The corresponding expectations from the supersymmetry scenario chosen as reference are also given. The statistical and systematic uncertainties described in Section 8 are added in quadrature. Systematic uncertainties might be asymmetric due to the propagation of the jet energy scale uncertainties. The percentage of reconstructed events that fulfill theb-tagging requirements after theMetSig>2 GeV1/2cut is12%. The percentage of the Monte Carlo events with ab-tagged jet matched to a trueb-quark4is 75%.
The breakdown of the different Standard Model contributions is presented in Table 7. As expected because of the relatively low ETmiss selection (≃30 GeV), QCD multijet production processes dominate 0-lepton final states.
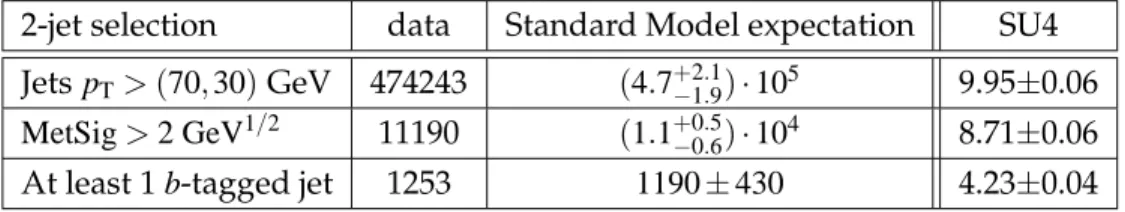
2-jet selection data Standard Model expectation SU4 JetspT>(70,30)GeV 474243 (4.7+2.1−1.9)·105 9.95±0.06 MetSig>2 GeV1/2 11190 (1.1+0.5−0.6)·104 8.71±0.06 At least 1b-tagged jet 1253 1190±430 4.23±0.04
Table 6: Number of events observed in the data and expected contributions of the different Standard Model processes for the 2-jet 0-lepton event selection. The expectations for the refer- ence SU4 supersymmetry scenario are also given. The quoted uncertainties include statistical and systematic contributions, except for the SU4 results, for which only the statistical uncer- tainties are given.
2-jet selection QCD W+jets Z+jets top
JetspT>(70,30)GeV ( 4.72±0.01 )·105 71.1±0.3 28.6±0.2 26.4±0.07 MetSig>2 GeV1/2 ( 1.11±0.02 )·104 47.4±0.2 19.3±0.2 6.73±0.02 At least 1b-tagged jet 1181±36 2.18±0.04 0.74±0.03 4.51±0.02 Table 7: Breakdown of the different processes contributing to the Standard Model expectation for the 2-jet 0-lepton event selection. Only statistical uncertainties are given.
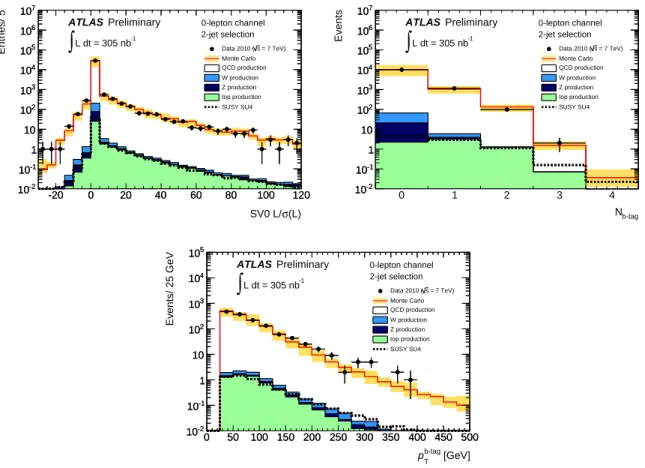
Relevantb-tagging-related quantities, such as the SV0 L/σ(L), theb-tagged jet multiplic- ity and the pT of the highest SV0L/σ(L)>6 b-tagged jet are shown in Figure 7 for data, the main Standard Model contributions and the SU4 reference supersymmetry scenario. Gener- ally, good agreement is found between data and Standard Model expectations estimated from Monte Carlo, for all these quantities. At high pT(>200 GeV), theb-tagged jet spectrum shows
4In Monte Carlo simulated events, a jet is labelled as trueb-jet if ab-quark is found at maximum distance∆R=0.3 with respect to the jet axis.
that thePYTHIAQCD multijet prediction slightly underestimates the data, as it is expected for a2→2LO generator [36].
Data and Monte Carlo expectations are also in good agreement for complex variables like ETmiss significance and effective mass Meff, as shown in Figure 8. Figure 9 shows other key observables for SUSY searches such as the azimuthal distance between theb-tagged jet with the highest SV0L/σ(L)and theETmissdirection, and theETmiss/Mefffraction.
QCD multijet background with largeETmissoriginates from misreconstruction of the jet en- ergies in the calorimeters. In such events theETmiss direction tends to be aligned, in the trans- verse plane, with one of the leading jets in the event. Previous studies [35] based on Monte Carlo simulations have shown that high suppression of QCD multijet background is achieved by requiring a minimum azimuthal distance between the leading jets and theETmiss direction,
∆φmin(ETmiss,jet). Figure 10 shows the∆φmin(ETmiss,jet)distribution, where the first three leading jets with pT >20 GeV are considered, and theMeffdistribution for events passing the require-
ment∆φmin(ETmiss,jet)>0.2: 446 events are found in data, in good agreement with the expecta-
tion of 410+150−180. About 65% of the events are rejected by this selection.
σ(L) SV0 L/
-20 0 20 40 60 80 100 120
Entries/ 5
10-2
10-1
1 10 102
103
104
105
106
107
0-lepton channel 2-jet selection
= 7 TeV) s Data 2010 ( Monte Carlo QCD production W production Z production top production SUSY SU4
L dt = 305 nb-1
∫
-20 0 20 40 60 80 100 120
10-2
10-1
1 10 102
103
104
105
106
107
ATLAS Preliminary
b-tag
N
0 1 2 3 4
Events
10-2
10-1
1 10 102
103
104
105
106
107
0-lepton channel 2-jet selection
= 7 TeV) s Data 2010 ( Monte Carlo QCD production W production Z production top production SUSY SU4
L dt = 305 nb-1
∫
10-2
10-1
1 10 102
103
104
105
106
107
ATLAS Preliminary
[GeV]
b-tag
pT
0 50 100 150 200 250 300 350 400 450 500
Events/ 25 GeV
10-2
10-1
1 10 102
103
104
105
0-lepton channel 2-jet selection
= 7 TeV) s Data 2010 ( Monte Carlo QCD production W production Z production top production SUSY SU4
L dt = 305 nb-1
∫
0 50 100 150 200 250 300 350 400 450 500 10-2
10-1
1 10 102
103
104
105
ATLAS Preliminary
Figure 7: b-tag SV0L/σ(L)distribution (left), multiplicity ofb-tagged jets (right) and pT distri- bution for the highest SV0L/σ(L)>6 b-tagged jet (bottom) for data and the different Standard Model contributions before theb-tagged jet requirement for the 0-lepton 2-jet event selection.
The uncertainty band includes statistical and systematic uncertainties. The SU4 supersymme- try benchmark point is also shown.