ATLAS-CONF-2010-080 11October2010
ATLAS NOTE
ATLAS-CONF-2010-080
July 24, 2010
Search for new particles decaying into dijets in proton-proton collisions at
√ s = 7 TeV with the ATLAS detector
The ATLAS Collaboration
Abstract
A search for new heavy particles manifested as narrow dijet (two-jet) invariant mass resonances is presented, using the ATLAS detector to study proton-proton collisions at a centre-of-mass energy of√
s=7 TeV. The data were collected during the April−July 2010 period of Large Hadron Collider (LHC) operations and correspond to a time-integrated lu- minosity of 296 nb−1. No significant evidence of new particles was found in this sample.
Upper limits were set on the products of cross section and detector acceptance for hypo- thetical new particles expected to decay into dijets, for which each jet was reconstructed with a pseudorapidity |η|<2.5. These limits were used with a theoretical prediction for excited-quark production to determine a 95% credibility-level q∗ mass exclusion region of 400<mq∗ <1290 GeV for the case where MRST2007 parton distribution functions were considered.
1 Introduction
Two-jet (dijet) events arising in high-energy proton-proton (pp) collisions are well described in the stan- dard model in terms of the quantum chromodynamics (QCD) of pairs of beam-constituent partons inter- acting at high energies. Several extensions beyond the standard model predict the presence of new parti- cle states with heavy masses accessible to LHC energies and with a propensity to decay into two energetic partons. Such states include an excited composite quarkq∗, exemplifying quark substructure [1, 2, 3];
an axigluon predicted by chiral color models [4, 5]; a flavour-universal color-octet coloron [6, 7]; a color-octet techni-ρ mesonρT8predicted by models of extended technicolor and topcolor-assisted tech- nicolor [8, 9]; a graviton predicted by theories of Large Extra Dimensions [10, 11, 12, 13, 14]; a gravi- ton,G∗, predicted by the Randall-Sundrum (RS) model with a warped extra spatial dimension [15, 16];
additional gauge bosons, W′ and Z′, predicted in grand unified theories (GUT) that invoke higher di- mensional gauge groups or left-right symmetric models [17, 18, 19, 20, 21]; and a diquark predicted by the superstring-inspired E6GUT model [22]. By virtue of its higher predicted cross section [2, 3], only the excited-quark model in the above list was used initially by this analysis to set preliminary limits on excluded mass ranges for new particles that decay to dijets.
The dijet invariant mass (mj j) observable is particularly sensitive to such new particles, but studies of pp¯collisions at the Fermilab Tevatron have indicated good agreement with next-to-leading-order (NLO) QCD in the region mj j<1.2 TeV [23, 24]. Employing leading-order (LO) PYTHIA [25] calculations to simulate several models, the CDF experiment has used 1.13 fb−1 of 1.96 TeV pp¯data to report 95%
confidence-level mass exclusion intervals for several predicted new particles decaying into dijets with rapidity1 |y|<1, including an excited quark q∗ mass exclusion of 260<mq∗ <870 GeV [23]. The present study represents an early search for new particle resonances in a sample of ppcollisions with a centre-of-mass energy of √
s=7 TeV and a time-integrated luminosity of 296 nb−1. The analysis technique was data-driven and consisted of scanning the observed mj j distribution for resonances that would signal a departure from a smooth and rapidly falling parametrization of the spectrum. In the absence of observed new physics signals, upper limits were determined for new phenomena in terms of the products of cross section (σ) and detector acceptance2(A).
2 The ATLAS detector
The ATLAS detector is a multipurpose apparatus with a nominally forward-backward symmetric cylin- drical geometry and near 4π coverage in solid angle [26]. The overall layout of the detector is driven by its four magnet systems: a thin superconducting solenoid surrounding an inner tracking cavity and three large superconducting toroids (one barrel and two end caps) surrounding the calorimeters with an eightfold azimuthal symmetry. The calorimeters, which are surrounded by an extensive muon system, are of particular importance to this analysis. In the pseudorapidity region |η|<3.2, high-granularity liquid-argon (LAr) electromagnetic sampling calorimeters with very good energy resolution [26] are used. A scintillator-tile calorimeter provides hadronic coverage in the range|η|<1.7 and comprises a large central barrel and two smaller extended barrel cylinders, one on each side. The end-cap and forward regions, spanning 1.5<|η|<4.9, are again instrumented with LAr calorimetry for both electromagnetic and hadronic energy measurements.
1The ATLAS reference system is a Cartesian right-handed coordinate system, with a nominal collision point at the origin.
The anticlockwise beam direction defines the positivez-axis, while the positivex-axis is defined as pointing from the collision point to the centre of the LHC ring and the positivey-axis points upwards. The azimuthal angleφis measured around the beam axis in the transverse (xy)-plane, and the polar angleθis measured with respect to thez-axis. The pseudorapidity is defined as η=−ln[tan(θ/2)]. The rapidity is defined asy= 12ln[(E+pz)/(E−pz)], whereEis the energy andpzis the component of the momentum along the beam direction.
2Kinematic and reconstruction efficiencies were included in the detector acceptanceA.
ηj1
-2 0 2
j2
η
-2 0 2
-1QCD events in 1 pb
10-1 1 10 102
ATLASPreliminary
ηj1
-2 0 2
j2
η
-2 0 2
-1Signal events in 1 pb
10-3 10-2 10-1 1
ATLASPreliminary
Figure 1: Surface plots describing the expected distributions of event yields in the observables ηj1 and ηj2 for dijets with 875≤mj j≤1020 GeV, a range defined by the predicted ±1σ region of a 1 TeV excited quarkq∗, identified in MC [left] QCD background and [right] 1 TeVq∗signal samples.
3 Data sample, jet reconstruction, and event selection
The 296 nb−1sample ofppcollisions was collected online using a simplified configuration that required an unprescaled lowest-level (L1) hardware-based calorimeter jet trigger to be fired with a nominal energy threshold3of 15 GeV [27]. Offline, jets were reconstructed using the infrared- and collinear-safe anti-kT
jet clustering algorithm [28] with a radius parameter R=0.6. The jet reconstruction performance was studied using PYTHIA[25] Monte Carlo (MC) samples and a GEANT4 [29] based ATLAS detector sim- ulation to find that the jet angular variablesηjetandφjetwere reconstructed with no offset and resolutions under 0.05 units [30]. Jet transverse momenta (pT) were directly measured at the electromagnetic scale, resulting in a systematic underestimation of the hadronic response for jets, due to the non-compensating character of the calorimeters. The measured jet pT values were subsequently calibrated as a function of ηjetand pT using a MC-determined numerical inversion technique [30].
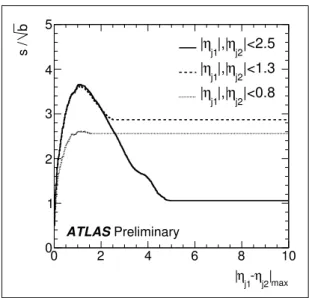
The data were collected during periods of stable 7 TeV proton-proton collisions using the standard ATLAS detector configuration [31]. Events were required to contain at least one primary collision vertex, defined by at least five reconstructed tracks, each with a position|z|<10 cm to suppress cosmic-ray and beam-related backgrounds. Only jets in the region |η|<2.8 were considered, to avoid regions where the calibration had unknown systematic uncertainty. Events with at least two jets were retained if the leading (in pT) jet satisfied pTj1 >80 GeV and the next-to-leading jet satisfied pTj2 >30 GeV in order to ensure high and unbiased trigger and reconstruction efficiencies, respectively; however, those events containing any poorly measured [31] jets with pT >15 GeV were vetoed so as to avoid accidental swapping between j2and the next-to-next-to-leading jet, j3. Jets j1 and j2were also required to satisfy several additional quality criteria to avoid problematic detector regions, including the 1.3≤ |η| ≤1.8 crack region, and fakes from noisy calorimeter cells [31]. Finally, the pseudorapidity regions for the two jets were required, motivated by an optimization study that maximizeds/√
bfors-channel signal (s) production over a QCD background (b), to be
ηj1
<2.5, ηj2
<2.5, and
ηj1−ηj2
<1.3. Refer to Figs. 1 and 2 for illustrations of the variables and their optimization.
3The nominal trigger energy threshold refers to energy calibrations involving the electromagnetic scale only; there was therefore no compensation for the hadronic calorimeter response.
|max
ηj2 j1- η
|
0 2 4 6 8 10
bs /
0 1 2 3 4 5
|<2.5 ηj2 j1|,|
η
|
|<1.3 ηj2 j1|,|
η
|
|<0.8 ηj2 j1|,|
|η
ATLASPreliminary
Figure 2: The ratios/√
bfrom the backgroundband the expected 1 TeV excited quark signalsin a dijet mass range with±1σ signal coverage is shown as a function of the absolute value of the maximumη difference between the two leading jets.
The principal observable in this analysis, the dijet invariant massmj j, was defined as mj j=
q
(E1+E2)2−(~p1+~p2)2, (1) whereEand~pwere the jet energy and momentum, respectively, and was examined in the regionmj j>
200 GeV in order to reduce kinematic bias and to facilitate fitting.
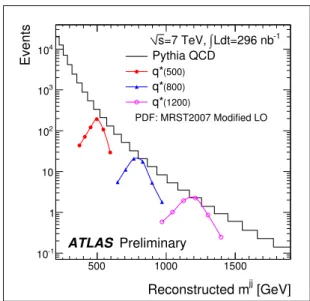
For this analysis, any studies requiring beyond-the-Standard-Model MC signal generation used the excited quark4(qg→q∗) production model [2, 3], which was predicted to have the highest cross section out of the various models considered in the mass region mj j <3 TeV. All of the default MC samples were prepared using the standard ATLAS MC09 parameter tune [35] and MRST2007 Modified LO parton distribution functions [32]. Figure 3 shows the MC-predicted [25, 29] QCD distribution withq∗ predictions overlaid for selected excited-quark masses. The signal acceptances were found to range from
∼13% at 200 GeV to∼44% at 1 TeV. The choice of dijet mass binning was motivated by the absolute resolution of the signal in the dijet mass distribution. The resolution was found to improve from∼13%
at 200 GeV to∼6% at 1 TeV.
4 Background determination and search for dijet mass resonances
The background was extracted from the observed spectrum by fitting the smooth function [23]
f(x) =p0(1−x)p1
xp2+p3lnx, (2)
4The excited quark q∗was assumed to have couplings to the standard modelSU(2),U(1), andSU(3)gauge groups of f = f′= fs=1, respectively [2, 3], and was simulated using the leading-order PYTHIA[25] generator with the modified leading-order MRST2007 [32] parton distribution functions (PDFs) and the renormalization and factorization scales set to the mean pT of the two leading jets. Predictions using CTEQ6L1 [33] and CTEQ6.6 [34] PDFs were also studied. The compositeness scale was set to theq∗mass. Note that excited quarks were permitted to decay into a number of decay modes, including those with daughter particles that did not become jets.
[GeV]
Reconstructed mjj
500 1000 1500
Events
10-1
1 10 102
103
104
Ldt=296 nb-1
∫
=7 TeV, s
Pythia QCD (500) q*
(800) q*
(1200) q*
PDF: MRST2007 Modified LO
ATLAS Preliminary
Figure 3: The PYTHIAQCD prediction for the reconstructedmj jspectrum, with overlaidq∗predictions for excited-quark masses of 500, 800, and 1200 GeV. The total number of events is normalized to the time-integrated data luminosity of 296 nb−1.
wherex≡mj j/√
s, and p{0,1,2,3} are free parameters constrained such that f(1) =0 and f(0)→+∞.
The x−p3lnx factor was included to describe the high-mj j part of the QCD spectrum. The function in Eqn. 2 has been shown to fit themj jobservable well in PYTHIA, HERWIG, and NLO pQCD predictions for pp¯collisions at√
s=1.96 TeV [23]. MC studies using PYTHIA[25] and the ATLAS GEANT4 [29]
based detector simulation were done to demonstrate that the smooth and monotonic form of Eqn. 2 described QCD-predicted dijet mass distributions well at the detector level. Refer to Figs. 4 and 5, where the function in Eqn. 2 is shown to fit the spectrum with a χ2/NDFof 27.0/22 over the dijet mass range 200<mj j <1900 GeV, thereby justifying the use of Eqn. 2 to estimate the QCD background in the observedmj jdistribution.
Figure 6 depicts the observed datamj jdistribution with the results of a fit to Eqn. 2 overlaid. The presence or absence of new physics in the form of detectable narrow mj j resonances was established using frequentist and model-independent tests of the null hypothesis5by way of a suite of test statistics6. The goodness-of-fit to the data distribution depicted in Figs. 6 and 7 was determined, for each variety of statistic, by comparison of that statistic as determined in data with its distribution of values generated in 103pseudo-experiments seeded by the results of the fit to Eqn. 2.
For each of the six statistics employed, a distribution of its value was recomputed in 103 pseudo- experiments seeded by a fit to the observed mj jdata distribution. The p-value7 of the null hypothesis was determined by noting the fraction of pseudo-experiments that resulted in a value of the given statistic greater than the value of the same statistic found by the fit to the data.
In all the statistical tests conducted on the actual data to check for consistency of the fit, in no case was a significant discrepancy indicated. Out of the six statistical tests conducted, all produced large
5In the context of this study, the null hypothesis was the assumption that the data sample represented the fit function that was determined by fitting the data. Ref. [36] is a useful resource containing further explanation of the statistical terminology and methodology used in this analysis.
6The statistics examined for sensitivity to the null hypothesis were the BumpHunter [37], the Jeffreys divergence, the Kolmogorov-Smirnov, the−lnL, the Pearsonχ2, and the TailHunter [38] statistic.
7Assuming the null hypothesis is true, thep-value is a statistical quantity that represents the probability of obtaining a test statistic at least as extreme as the one that was observed in the data.
[GeV]
Reconstructed mjj
500 1000 1500
Events/(bin width) [Events/GeV]
10-3
10-2
10-1
1 10 102
103
ATLAS Preliminary
=7 TeV s
Pythia QCD Fit
Figure 4: The PYTHIAprediction at LO for the reconstructedmj jspectrum (after event selection). The total number of events is normalized to the time-integrated data luminosity of 296 nb−1.
[GeV]
Reconstructed mjj
500 1000 1500
[ MC - fit ] / fit
-0.10 -0.05 0.00 0.05 0.10
ATLAS Preliminary
=7 TeV s
Pythia QCD
[GeV]
Reconstructed mjj
500 1000 1500
(Pythia - fit)/(Pythia stat. uncertainty) -2
0 2 4
=7 TeV s
Ldt=296 nb-1
∫
ATLAS Preliminary
Figure 5: [left] The relative bin-by-bin difference between the simulated PYTHIAcalculations and the fit function. [right] The significance of the bin-by-bin difference between the simulated PYTHIAcalcu- lations and the fit function.
[GeV]
Reconstructed mjj
500 1000 1500
Events
1 10 102
103
104
=7 TeV s
Ldt=296 nb-1
∫ Data Fit
ATLAS Preliminary
[GeV]
Reconstructed mjj
500 1000 1500
Events
1 10 102
103
104
Ldt=296 nb-1
∫
=7 TeV, s Data Fit
(500) q*
(800) q*
(1200) q*
PDF: MRST2007 Modified LO
ATLAS Preliminary
Figure 6: [left] The measured data dijet mass distribution (points) fitted using a binned distribution described by Eqn. 2 (red histogram). The indicated uncertainties represent the data statistics alone.
[right] The same distribution with theq∗predictions from Fig. 3 overlaid.
[GeV]
Reconstructed mjj
500 1000 1500
[ data - fit ] / fit
-1 0 1 2
=7 TeV s
Ldt=296 nb-1
∫ Data
ATLAS Preliminary
[GeV]
Reconstructed mjj
500 1000 1500
data[ data - fit ] /
-2 0 2 4
=7 TeV s
Ldt=296 nb-1
∫
ATLAS Preliminary
Figure 7: [left] The relative bin-by-bin difference between the observed data distribution and the fit function. [right] The significance of the bin-by-bin difference between the observed data distribution and the fit function.
[GeV]
Reconstructed mjj
500 1000 1500
Events
10-1
1 10 102
103
104
=7 TeV s
Ldt=296 nb-1
∫ Data Pythia QCD
ATLAS Preliminary
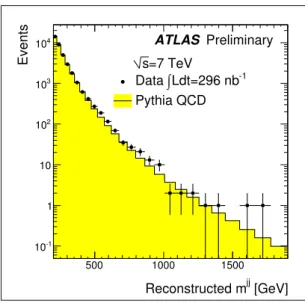
Figure 8: The measured data dijet reconstructed mass distribution (points) compared with a binned distri- bution described by the LO PYTHIAMC QCD prediction (histogram). The data and MC are normalized to the same number of events, and the indicated uncertainties represent the data statistics alone.
p-values, ranging from 43% to>99.9%. These observations were interpreted as an indication that the null hypothesis could not be ruled out by the observed datamj jdistribution. With no evidence for the existence of resonance structure observed in this data sample, preliminary limits on the production of new particle phenomena were determined, as discussed in Sect. 5.
To illustrate how the analogousp-values change when Eqn. 2 is replaced by a MC calculation known a priorito be only an approximate description of the true QCD spectrum, a comparison was also made between the observed datamj jdistribution and the LO PYTHIA [25] QCD prediction. Refer to Figs. 8 and 9. The p-values of the null hypothesis computed for the different statistics were found to be in the vicinity of 0.1%, therefore smaller than those computed from the fit of Eqn. 2 to the data. It is expected that the data agree less well with the LO PYTHIAQCD prediction than with the fit. The approach used in this study did not rely on any comparison between data and MC to set limits on new particle production, described in Sect. 5.
5 Limits on the production of new particles
In the absence of any observed significant discrepancy with the zero-signal hypothesis, a Bayesian ap- proach was used to set 95% credibility-level (CL) upper limits onσ·A, the product of the production cross section and detector acceptance, respectively, for a hypothetical new particle decaying into dijets with
ηjet <2.5.
A likelihood function Lν was defined generally, for each of the test masses (indexed by ν) corre- sponding to the excited-quark q∗ predictions, to be a product of Poisson factors computed for each bin (i) of the distribution:
Lν(d|bν,s)≡
∏
i
(bνi+si)di
di! e−(bνi+si), (3)
where di is the observed data value in bini, bνi is the background in biniobtained from the fit with Eqn. 2 and bins spanning 68% of the predicted relevant (νth)q∗signal excluded8, andsi is the predicted
8In this data-driven technique, the function in Eqn. 2 was thus effectively employed to fit the sidebands of each of theνtest
[GeV]
Reconstructed mjj
500 1000 1500
[ data - MC ] / MC
0 5 10 15
=7 TeV s
Ldt=296 nb-1
∫ Data
ATLAS Preliminary
[GeV]
Reconstructed mjj
500 1000 1500
MC,stat2σdata+(data - MC) /
-2 0 2 4 6
=7 TeV s
Ldt=296 nb-1
∫
ATLAS Preliminary
Figure 9: [left] The relative bin-by-bin difference between the data and simulated PYTHIAcalculations.
[right] The significance of the bin-by-bin difference between the data and simulated PYTHIA calcula- tions.
signal added to biniby the signal template, when the latter is normalized to the total number of signal eventss=∑isi. Equation 3 was computed for several different numbers of hypothetical signal events.
For eachνindex corresponding to a given value ofmj jin the region of interest, the resulting likelihood function was normalized, assuming a flat prior ins, to yield a posterior probability density ins. The 95%
quantile was then determined by integration of the posterior probability distribution computed for each respectivemj jvalue.
This Bayesian technique was found to correspond well with frequentist coverage probabilities. To check the 95% CL Bayesian limits set in the analysis, a frequentist examination of the coverage prob- ability was employed to determine the fraction of pseudo-experiments for which the actual signal yield was included in the confidence interval described by the Bayesian limit. Figure 10 displays the coverage probability versus signal yield for a hypothetical excited-quark mass of 900 GeV. Consistent results were obtained for other mass values.
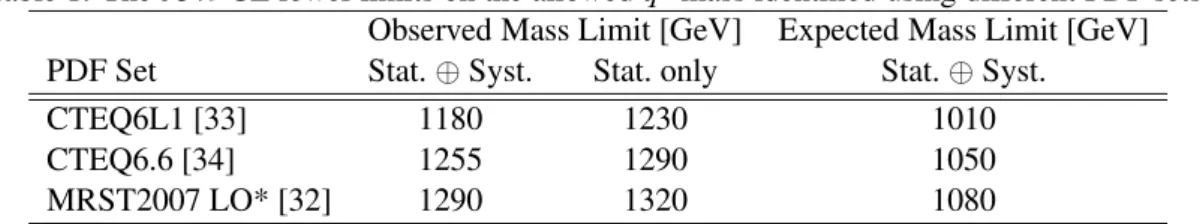
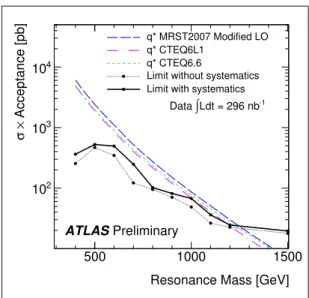
Before taking into account systematic uncertainties, an observed statistics-only 95% CL excited- quark mass exclusion region was computed by noting the intersection of aq∗ excited quark prediction with a curve comprising multiple 95% CL upper limits on σ·A as a function of the corresponding resonant dijet masses mj j. Refer to Fig. 12. Table 1 contains the observed statistics-only intersection points for the CTEQ6L1, CTEQ6.6, and MRST2007 PDFs. The 400 GeVq∗ predicted test mass was taken to describe the low end of the 95% CL mass exclusion region because its low-mass tail was less affected by the minimummj jselection criterion and because it was the lowest generatedq∗ mass point with a low-mass sideband that could be used, in conjunction with the high-mass sideband, to fit the background function with precision. Taking the MRST2007 PDF as an example9, the 95% CL exclusion region was therefore 400<mq∗<1320 GeV, prior to accounting for systematic uncertainties.
The dominant sources of systematic uncertainty encountered in this analysis consisted of the jet- energy scale (JES), the time-integrated luminosity, the background fit parameters, and the jet-energy resolution (JER). The integrated-luminosity uncertainty onσ·A was estimated to be±11% [39]. The
q∗masses in order to estimate the relevant backgrounds,bνi, for every bini.
9The exclusion regions for each of the PDFs studied can be inferred to lie between the low value of 400 GeV and the relevant values in Table 1. The MRST2007 PDF set is currently the ATLAS MC default.
Number of Signal Events
0 50 100
Coverage of 95% Bayesian limit
0.96 0.98
1.00 ATLAS Preliminary
Figure 10: The coverage probability, or the fraction of times that the confidence interval defined by the Bayesian limit contains the true number of signal events, as a function of signal yield for a hypothetical q∗ mass of 900 GeV. In this study, the coverage probabilities were found to lie in the vicinity of 95%, indicating compatibility between Bayesian and frequentist approaches.
Table 1: The 95% CL lower limits on the allowedq∗mass identified using different PDF sets.
Observed Mass Limit [GeV] Expected Mass Limit [GeV]
PDF Set Stat.⊕Syst. Stat. only Stat.⊕Syst.
CTEQ6L1 [33] 1180 1230 1010
CTEQ6.6 [34] 1255 1290 1050
MRST2007 LO* [32] 1290 1320 1080
Number of Signal Events
0 100 200
P(signal | data) for flat prior
0.00 0.02 0.04
-1) Ldt=296 nb
∫
=7 TeV Data ( s
Posterior p.d.f. for q*(400) No systematic uncertainty
Ldt uncertainty
∫ ∫Ldt uncertainty JES and
Ldt and fit uncertainty
∫
JES and
ATLAS Preliminary
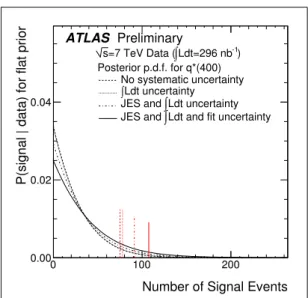
Figure 11: Posterior probability distributions computed, assuming a flat prior, for an excited quark mass of 400 GeV. The four curves represent cases without convolution; with convolution of the integrated- luminosity uncertainty; with convolution of both the integrated-luminosity and JES uncertainties; and with convolution of the JES, integrated-luminosity, and background-fit uncertainties. The JER uncer- tainty was found to have negligible consequence. The effect of the systematics convolution technique is indicated by the shifts in the extracted 95% quantile signal values, represented by the vertical red lines.
Analogous posterior probability distributions were computed for all of the differentq∗masses studied.
JES uncertainty was quantified as varying with pT andηjet[40, 41]. The background fit uncertainty was taken to reflect the effect of finite statistics on the determination of the fit parameters in Eqn. 2 using the data sample. The JER uncertainty was treated as uniform in pT andηjet, with a value of±14% on each jet’s relative resolution, hσppT
Ti[42].
The JES, time-integrated luminosity, background fit, and JER effects were convolved into the limit determination as numerically integrated η and pT-dependent nuisance parameters. In the course of applying the convolution technique to the four principal sources of systematic uncertainty, the JER was found to make a negligible contribution to the overall systematic uncertainty. Figure 11 exemplifies the effect of systematics on the posterior probability computed for one of the mj j mass points. Identical procedures were followed for the other mass points.
Figure 12 depicts the resulting 95% CL upper limits onσ·A as a function of the dijet massmj j, compared before and after convolution of the systematic uncertainties. Table 1 lists the values of the limit-defining intersection points for each of the PDFs studied. For example, the corresponding observed 95% CL excited-quark mass exclusion region was found to be 400<mq∗<1290 GeV using MRST2007 PDFs and taking into account the systematic uncertainties.
Using an analogous approach, but substituting the actual data with pseudo-data following the LO PYTHIAQCD prediction, the expected limits were computed as shown in Fig. 13. The expected 95% CL upper limits onσ·A, taken together with theq∗ prediction, are listed in Table 1 for each of the PDFs considered in the study. Table 1 contains expected limits for the case after the systematic uncertainties were taken into account. The observed limits mentioned above were compatible with these expected limits within the applicable Poisson-distributed statistical uncertainties, indicated by the band.
Resonance Mass [GeV]
500 1000 1500
Acceptance [pb]×σ
102
103
104
q* MRST2007 Modified LO q* CTEQ6L1
q* CTEQ6.6
Limit without systematics Limit with systematics
ATLASPreliminary
Ldt = 296 nb-1
∫
Data
Figure 12: The 95% CL upper limit ofσ·A as a function of the dijet massmj j, with the JES, integrated- luminosity, and background-fit systematic uncertainties taken into account when obtaining the limits (black solid curve). Also shown is the limit curve computed using statistical uncertainties alone (black dotted curve). The dashed curves represent excited-quark σ·A predictions for different PDF scenarios, described in the text.
Resonance Mass [GeV]
500 1000 1500
Acceptance [pb]×σ
102
103
104
q* MRST2007 Modified LO q* CTEQ6L1
q* CTEQ6.6 Expected limit Observed limit
ATLASPreliminary
Ldt = 296 nb-1
∫
Data
Figure 13: The red dotted curve shows the expected 95% CL upper limit of σ·A as a function of the dijet mass mj j. The yellow band represents the RMS of the limit due to Poisson fluctuations of the pseudo-data around the LO PYTHIA QCD prediction. The corresponding observed limit is shown by the black solid curve. The dashed curves represent excited-quark σ·A predictions for different PDF scenarios, described in the text. The expected and observed limits are shown with all major systematic uncertainties included.
6 Summary
A search for new heavy particles observed as narrow mass resonances was conducted using the ATLAS detector on a 296 nb−1sample of 7 TeV proton-proton collisions. No significant evidence of a resonance structure was found in this preliminary sample. Upper limits at the 95% CL were set on the products of cross section and detector acceptance for hypothetical new particles expected to decay into dijets, for which each jet was reconstructed with a central pseudorapidity
ηjet
<2.5. Using this preliminary data sample and taking into account systematic uncertainties, a 95% CLq∗ mass exclusion region was determined to be 400<mq∗ <1290 GeV for the case when MRST2007 parton distribution functions were considered.
References
[1] E. Eichten, K. D. Lane, and M. E. Peskin,New Tests for Quark and Lepton Substructure, Phys.
Rev. Lett.50(1983) 811–814.
[2] U. Baur, I. Hinchliffe, and D. Zeppenfeld,Excited Quark Production at Hadron Colliders, Int. J.
Mod. Phys.A2(1987) 1285.
[3] U. Baur, M. Spira, and P. M. Zerwas,Excited Quark and Lepton Production at Hadron Colliders, Phys. Rev.D42(1990) 815–824.
[4] P. H. Frampton and S. L. Glashow,Chiral Color: An Alternative to the Standard Model, Phys.
Lett.B190(1987) 157.
[5] J. Bagger, C. Schmidt, and S. King,Axigluon Production in Hadronic Collisions, Phys. Rev.D37 (1988) 1188.
[6] R. S. Chivukula, A. G. Cohen, and E. H. Simmons,New strong interactions at the Tevatron?, Phys. Lett.B380(1996) 92–98,arXiv:hep-ph/9603311.
[7] E. H. Simmons,Coloron phenomenology, Phys. Rev.D55(1997) 1678–1683, arXiv:hep-ph/9608269.
[8] K. D. Lane and M. V. Ramana,Walking technicolor signatures at hadron colliders, Phys. Rev.
D44(1991) 2678–2700.
[9] K. Lane and S. Mrenna,The Collider phenomenology of technihadrons in the technicolor straw man model, Phys. Rev.D67(2003) 115011, arXiv:hep-ph/0210299.
[10] N. Arkani-Hamed, S. Dimopoulos, and G. R. Dvali,The hierarchy problem and new dimensions at a millimeter, Phys. Lett.B429(1998) 263–272,arXiv:hep-ph/9803315.
[11] A. Pomarol and M. Quiros,The standard model from extra dimensions, Phys. Lett.B438(1998) 255–260,arXiv:hep-ph/9806263.
[12] K. R. Dienes, E. Dudas, and T. Gherghetta,Grand unification at intermediate mass scales through extra dimensions, Nucl. Phys.B537(1999) 47–108,arXiv:hep-ph/9806292.
[13] D. Atwood, S. Bar-Shalom, and A. Soni,Dijet production at hadron colliders in theories with large extra dimensions, Phys. Rev.D62(2000) 056008,arXiv:hep-ph/9911231.
[14] K. Cheung and G. L. Landsberg,Kaluza-Klein states of the standard model gauge bosons:
constraints from high energy experiments, Phys. Rev.D65(2002) 076003, arXiv:hep-ph/0110346.
[15] L. Randall and R. Sundrum,A large mass hierarchy from a small extra dimension, Phys. Rev. Lett.
83(1999) 3370–3373,arXiv:hep-ph/9905221.
[16] J. Bijnens, P. Eerola, M. Maul, A. Mansson, and T. Sjostrand,QCD signatures of narrow graviton resonances in hadron colliders, Phys. Lett.B503(2001) 341–348,arXiv:hep-ph/0101316.
[17] E. Eichten, I. Hinchliffe, K. D. Lane, and C. Quigg,Super Collider Physics, Rev. Mod. Phys.56 (1984) 579–707.
[18] E. Eichten, I. Hinchliffe, K. D. Lane, and C. Quigg,Erratum, Rev. Mod. Phys.58(1986) 1065–1073.
[19] R. N. Mohapatra and J. C. Pati,Left-Right Gauge Symmetry and an Isoconjugate Model of CP Violation, Phys. Rev.D11(1975) 566–571.
[20] G. Senjanovic and R. N. Mohapatra,Exact Left-Right Symmetry and Spontaneous Violation of Parity, Phys. Rev.D12(1975) 1502.
[21] R. N. Mohapatra and G. Senjanovic,Neutrino Masses and Mixings in Gauge Models with Spontaneous Parity Violation, Phys. Rev.D23(1981) 165.
[22] J. L. Hewett and T. G. Rizzo,Low-Energy Phenomenology of Superstring Inspired E(6) Models, Phys. Rept.183(1989) 193.
[23] CDF Collaboration, T. Aaltonen et al.,Search for new particles decaying into dijets in proton-antiproton collisions at√
s=1.96TeV, Phys. Rev. D79(2009) 112002.
[24] D0 Collaboration, V. M. Abazov et al.,Measurement of the dijet invariant mass cross section in pp collisions at√
s=1.96 TeV,arXiv:1002.4594 [hep-ex].
[25] T. Sjostrand, S. Mrenna, and P. Z. Skands,PYTHIA 6.4 Physics and Manual, JHEP05(2006) 026, arXiv:hep-ph/0603175.
[26] ATLAS Collaboration, G. Aad et al.,The ATLAS Experiment at the CERN Large Hadron Collider, JINST3(2008) S08003.
[27] ATLAS Collaboration,Measurement of jet production in proton-proton collisions at 7 TeV centre-of-mass energy with the ATLAS detector, ATLAS-CONF-2010-050 .
[28] S. G. P. Cacciari and G. Soyez,The anti-kT jet clustering algorithm, JHEP04(2008) 063.
[29] GEANT4 Collaboration, S. Agostinelli et al.,GEANT4: A simulation toolkit, Nucl. Instrum. Meth.
A506(2003) 250–303.
[30] ATLAS Collaboration,Observation of Energetic Jets in pp Collisions at√
s=7TeV using the ATLAS Experiment at the LHC, ATLAS-CONF-2010-043 .
[31] ATLAS Collaboration,Data-Quality Requirements and Event Cleaning for Jets and Missing Transverse Energy Reconstruction with the ATLAS Detector in Proton-Proton Collisions at a Center-of-Mass Energy of√s=7TeV, ATLAS-CONF-2010-038 .
[32] A. Sherstnev and R. S. Thorne,Parton Distributions for LO Generators, Eur. Phys. J.C55(2008) 553–575,arXiv:0711.2473 [hep-ph].
[33] J. Pumplin et al.,New generation of parton distributions with uncertainties from global QCD analysis, JHEP07(2002) 012,arXiv:hep-ph/0201195.
[34] P. M. Nadolsky et al.,Implications of CTEQ global analysis for collider observables, Phys. Rev.
D78(2008) 013004,arXiv:0802.0007 [hep-ph].
[35] ATLAS Collaboration, G. Aad et al.,ATLAS Monte Carlo tunes for MC09, ATL-PHYS-PUB-2010-002 .
[36] Particle Data Group Collaboration, C. Amsler et al.,Review of particle physics, Phys. Lett.B667 (2008) 1.
[37] CDF Collaboration, T. Aaltonen et al.,Global Search for New Physics with 2.0 fb−1at CDF, Phys.
Rev.D79(2009) 011101,arXiv:0809.3781 [hep-ex].
[38] CDF Collaboration, T. Aaltonen et al.,Model-Independent and Quasi-Model-Independent Search for New Physics at CDF, Phys. Rev.D78(2008) 012002, arXiv:0712.1311 [hep-ex].
[39] ATLAS Collaboration,Luminosity Determination using the ATLAS Detector, ATLAS-CONF-2010-060 .
[40] ATLAS Collaboration,ATLAS Calorimeter Response to Single Isolated Hadrons and Estimation of the Calorimeter Jet Scale Uncertainty, ATLAS-CONF-2010-052 .
[41] ATLAS Collaboration,Jet energy scale and its systematic uncertainty in ATLAS for jets produced in proton-proton collisions at√
s=7TeV, ATLAS-CONF-2010-056 .
[42] ATLAS Collaboration,Jet energy resolution and reconstruction efficiencies fromin situtechniques with the ATLAS detector using proton-proton collisions at a center-of-mass energy√
s=7TeV, ATLAS-CONF-2010-054 .
![Figure 1: Surface plots describing the expected distributions of event yields in the observables η j 1 and η j 2 for dijets with 875 ≤ m j j ≤ 1020 GeV, a range defined by the predicted ± 1σ region of a 1 TeV excited quark q ∗ , identified in MC [left] QCD](https://thumb-eu.123doks.com/thumbv2/1library_info/4017025.1541487/3.892.170.740.117.384/figure-surface-describing-expected-distributions-observables-predicted-identified.webp)
![Figure 5: [left] The relative bin-by-bin difference between the simulated P YTHIA calculations and the fit function](https://thumb-eu.123doks.com/thumbv2/1library_info/4017025.1541487/6.892.135.758.655.951/figure-left-relative-difference-simulated-ythia-calculations-function.webp)
![Figure 7: [left] The relative bin-by-bin difference between the observed data distribution and the fit function](https://thumb-eu.123doks.com/thumbv2/1library_info/4017025.1541487/7.892.134.757.661.958/figure-left-relative-difference-observed-data-distribution-function.webp)
![Figure 9: [left] The relative bin-by-bin difference between the data and simulated P YTHIA calculations.](https://thumb-eu.123doks.com/thumbv2/1library_info/4017025.1541487/9.892.139.756.106.406/figure-left-relative-difference-data-simulated-ythia-calculations.webp)