ATLAS-CONF-2010-043 13July2010
ATLAS NOTE
ATLAS-CONF-2010-043 June 2, 2010
Observation of Energetic Jets in pp Collisions at √
s = 7 TeV using the ATLAS Experiment at the LHC
ATLAS Collaboration
Abstract
We report on the observation of energetic jets of particles in the final state in proton- proton collisions at √
s=7 TeV, using the ATLAS detector and based on about 1 nb−1 of total integrated luminosity. Jets are reconstructed using the anti−kT algorithm with transverse momentum pTjet >30 GeV and rapidity in the region |yjet|<2.8. The data are compared to predictions based on leading-order QCD matrix elements plus parton shower Monte Carlo simulated events.
1 Introduction
The production of energetic jets of particles in proton-proton collisions constitutes a fundamental pre- diction of QCD [1] and a distinctive signature of short-distance (“hard”) interactions between partons, leading to collimated flows of hadrons at high transverse momentum in the final state. Jets of particles in proton-proton and proton-antiproton collisions have been previously observed at different centre-of-mass energies [2]. In this note, the early observation of jets in proton-proton collisions at a centre-of-mass en- ergy of √
s=7 TeV is reported, using data collected by the ATLAS experiment and corresponding to about 1 nb−1of integrated luminosity delivered by the LHC. Different jet kinematic distributions in in- clusive jet and dijet production are presented, together with a first study of the internal jet structure and the charged particle flow in the event, with the aim to confirm the observation of collimated flows of par- ticles in the final state. No attempt is made to correct the measurements for detector effects or account for systematic uncertainties. The data are compared to Monte Carlo (MC) simulated events based on per- turbative QCD (pQCD) leading-order (LO) matrix elements plus parton shower predictions, including a full simulation of the ATLAS detector response.
2 The ATLAS Detector
The ATLAS detector [3] covers nearly the entire solid angle around the collision point with layers of tracking detectors, calorimeters, and muon chambers. For the measurements presented in this note, the tracking devices and calorimeters are of particular importance.
The ATLAS inner detector has full coverage inφ1)and covers the pseudorapidity range|η|<2.5. It consists of a silicon pixel detector, a silicon microstrip detector, and transition radiation tracker immersed in a 2 Tesla magnetic field. High granularity liquid-argon (LAr) electromagnetic sampling calorimeters, with excellent performance in terms of energy and position resolution, cover the pseudo-rapidity range
|η|<3.2. The hadronic calorimetry in the range|η|<1.7 is provided by a scintillator-tile calorimeter, which is separated into a large barrel and two smaller extended barrel cylinders, one on either side of the central barrel. In the end-caps (|η|>1.5), LAr hadronic calorimeters match the outer |η|limits of the end-cap electromagnetic calorimeters. The LAr forward calorimeters provide both electromagnetic and hadronic energy measurements, and extend the coverage to|η|<4.9.
3 Event Selection
The data were collected during the first LHC runs at√
s=7 TeV between March and April 2010, with the ATLAS tracking detectors, calorimeters, and magnets operational at nominal conditions. Events are selected online using the signals from minimum bias trigger scintillators (MBTS) [4] on either side of the interaction point, which cover the pseudorapidity range 2.09<|η|<3.84 and are located in front of the end-cap electromagnetic calorimeters. Only events in which the MBTS trigger recorded one or more counters above threshold on either side are retained. In the kinematic range for the jets considered in this study (see below) the trigger selection does not introduce any significant bias in the measured distributions. The events are required to have a reconstructed primary vertex with a z-position within 10 cm around the origin of the coordinate system, which suppresses beam-related backgrounds and
1)The ATLAS reference system is a Cartesian right-handed coordinate system, with nominal collision point at the origin.
The anti-clockwise beam direction defines the positive z-axis, with the x-axis pointing to the center of the LHC ring. The pseudorapidity is defined asη=−ln(tan(θ/2)), where the polar angleθ is taken with respect to the positive z direction. The rapidity is defined as y=0.5×ln[(E+pz)/(E−pz)], where E denotes the energy and pzis the component of the momentum along the beam direction.
cosmic rays. Additional quality criteria are also applied to ensure that jets are not produced by single noisy calorimeter cells or problematic detector regions [5].
4 Monte Carlo Simulation
Samples of MC simulated inclusive jet events in proton-proton collisions at √
s=7 TeV are produced using the PYTHIA 6.4.21 [6] event generator, which implements LO pQCD matrix elements for 2→ 2 processes plus parton shower in leading logarithmic approximation. The samples are created using a special tuned set of parameters denoted as ATLAS MC09 [7] with MRST LO∗ [8] parton density functions, and passed through a full GEANT4 [9] simulation of the ATLAS detector. Finally, the MC events are reconstructed and analyzed with the same analysis chain as for the data, and the same trigger and event selection criteria.
5 Jet Reconstruction
Jets are searched for using the anti−kTjet algorithm [10] with distance parameter (y−φspace) R=0.6, four-momentum recombination, and the energy depositions in calorimeter clusters as input. Topologi- cal clusters are built around seed calorimeter cells with |Ecell|>4σ of the noise, to which all directly neighbouring cells are added. Further neighbours of neighbours are iteratively added for all cells with signals above a secondary threshold|Ecell|>2σ, whereσis defined as the RMS of the cell energy noise distribution.
The jet reconstruction is studied using PYTHIA MC samples and matched pairs of jets at the calorime- ter and hadron 2) levels. The measured jet angular variables, yjet and φjet are reconstructed with no significant shift and a resolution better than 0.05 units, which improves as the jet transverse momen- tum increases. The measured jet transverse momentum pTjet,em, as determined at the electromagnetic scale 3), systematically underestimates that of the hadron-level jet and is mainly attributed to the non- compensating nature of the calorimeter (lower response to hadrons than electrons or photons) and the presence of dead material. An average correction C(pTjet,em,yjet), determined as a function of pTjet,emand
|yjet|and extracted from MC simulation, is applied to the measured jets to obtain the corrected transverse momentum pTjet=C×pTjet,em. As an example, for jets with pTjet,emaround 20 GeV, the jet transverse mo- mentum is corrected by a factor 1.8 to 1.4, depending on the|yjet|region considered. No attempt is made to further correct the measured jet distributions for detector effects due to the limited resolution.
In this analysis, events are required to have at least one jet with corrected transverse momentum pTjet >30 GeV and rapidity |yjet|<2.8. Preliminary studies based on data and MC simulated events indicate that, for jets with|yjet|<2.8, the relative response of the calorimeter to jets in different rapidity regions is known within a±5% uncertainty. A first determination of the energy scale for jets, using in situ isolated tracks and calorimeter (E/p)measurements and test beam results, establishes an absolute jet energy scale uncertainty of about±7%.
2)The hadron level in the Monte Carlo generator is defined using all final-state particles with a lifetime above 10−11s.
3)The electromagnetic scale is the appropriate scale for the reconstruction of the energy deposited by electrons or photons in the calorimeter.
6 Results
6.1 Inclusive Jet Production
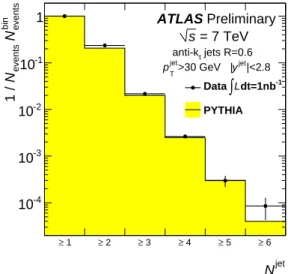
Figure 1 shows the observed inclusive jet multiplicity for jets with pTjet>30 GeV and|yjet|<2.8 com- pared to MC simulated events, where the distribution is normalized to unity. The data distribution de- creases with increasing jet multiplicity and events with six jets in the final state are observed. The shape of the observed distribution is described by the MC simulation based on pQCD LO matrix elements plus parton shower predictions. Figure 2 presents the observed pTjet and yjet distributions for all jets with
Njet
≥ 1 ≥ 2 ≥ 3 ≥ 4 ≥ 5 ≥ 6 bin eventsN eventsN1 /
10-4
10-3
10-2
10-1
1 ATLAS Preliminary
= 7 TeV s
jets R=0.6 anti-kt
>30 GeV
jet
pT |yjet|<2.8 dt=1nb-1
∫L Data PYTHIA
Figure 1: Observed inclusive jet multiplicity(≥Njet)distribution (black dots) for jets with pTjet >30 GeV and
|yjet|<2.8 compared to PYTHIA Monte Carlo prediction (yellow histogram), where Neventsbin denotes the number of events in a given jet multiplicity bin. The distribution is normalized to unity and only statistical uncertainties are included.
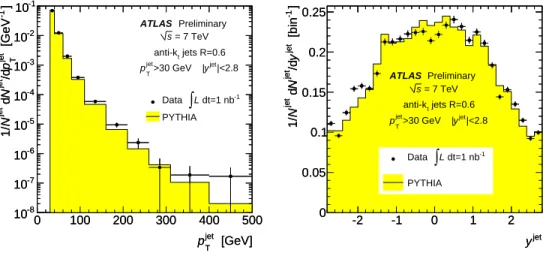
pTjet>30 GeV and |yjet|<2.8 in the final state, compared to the MC predictions, where the distribu- tions are normalized using the total number of jets Njet. The observed pTjetspectrum shows the expected falling shape with increasing pTjet, and jets with transverse momentum up to ∼500 GeV are observed.
The Monte Carlo simulated events provide a reasonable description of the data, but still show some deficiencies in the description of the observed jet rapidity distribution.
About 20% of the selected events contain at least two jets with pTjet>30 GeV and|yjet|<2.8 in the final state. The invariant mass mj jof the two leading jets and the azimuthal angular separation |∆φj j| are presented in Fig. 3, compared to PYTHIA MC predictions and normalized using the total number of dijet events Nj j. The shape of the mj jdistribution at low mj jreflects the limited phase space, as dictated by the thresholds applied on pTjet and yjet. The data show a decreasing mj j spectrum as mj j increases from 50 GeV to about 1 TeV. The shape of the dijet mass spectrum is described by the MC simulation.
The observed |∆φj j|distribution presents a prominent peak at|∆φj j| ∼π, indicating a dominant back- to-back dijet configuration in the final state, followed by contributions with smaller |∆φj j|values. The shape of the|∆φj j|distribution is followed by the MC predictions, which tend to underestimate the data at large|∆φj j|.
[GeV]
jet
pT
0 100 200 300 400 500
]-1 [GeVjet Tp/djet N djet N1/
10-8
10-7
10-6
10-5
10-4
10-3
10-2
10-1
[GeV]
jet
pT
0 100 200 300 400 500
]-1 [GeVjet Tp/djet N djet N1/
10-8
10-7
10-6
10-5
10-4
10-3
10-2
10-1
dt=1 nb-1
∫L Data PYTHIA ATLAS Preliminary
= 7 TeV s
jets R=0.6 anti-kt
|<2.8 yjet
>30 GeV |
jet
pT
yjet
-2 -1 0 1 2
]-1 [binjet y/djet N djet N1/
0 0.05 0.1 0.15 0.2 0.25
yjet
-2 -1 0 1 2
]-1 [binjet y/djet N djet N1/
0 0.05 0.1 0.15 0.2 0.25
dt=1 nb-1
∫L Data PYTHIA ATLAS Preliminary
= 7 TeV s
jets R=0.6 anti-kt
|<2.8 yjet
>30 GeV |
jet
pT
Figure 2: Observed inclusive pTjet (left) and yjet (right) distributions (black dots) for jets with pTjet>30 GeV and
|yjet|<2.8. Only statistical uncertainties are included and the distributions are normalized. The data are compared to PYTHIA Monte Carlo predictions (yellow histograms).
[GeV]
mjj
0 200 400 600 800 1000
]-1 [GeVjj m/djj N djj N1/
10-6
10-5
10-4
10-3
10-2
[GeV]
mjj
0 200 400 600 800 1000
]-1 [GeVjj m/djj N djj N1/
10-6
10-5
10-4
10-3
10-2
dt=1 nb-1
∫L Data PYTHIA ATLAS Preliminary
= 7 TeV s
jets R=0.6 anti-kt
|<2.8 yjet
>30 GeV |
jet
pT
[radians]
jj| φ
∆
|
π/2 2π/3 5π/6 π
]-1 [radiansjj φ∆/djj N djj N1/
0 1 2 3
dt=1 nb-1
∫L Data PYTHIA
ATLAS Preliminary
=7 TeV s
jets R=0.6 anti-kt
|<2.8 yjet
>30 GeV |
jet
pT
[radians]
jj| φ
∆
|
π/2 2π/3 5π/6 π
]-1 [radiansjj φ∆/djj N djj N1/
0 1 2 3
Figure 3: Observed mj j (left) and|∆φj j|(right) distributions (black dots) in inclusive dijet events for jets with pTjet>30 GeV and|yjet|<2.8. Only statistical uncertainties are included and the distributions are normalized.
The data are compared to PYTHIA Monte Carlo predictions (yellow histograms).
6.2 Jet Shapes and Charged Particle Flow
The distribution of the transverse momentum inside the jet cone and the charged particle flow in the event are studied with the aim to verify the presence of collimated flows of particles in the final state.
The differential jet shape (see Fig. 4) is defined as the average fraction of the jet transverse momentum that lies inside an annulus of inner radius r−∆r/2 and outer radius r+∆r/2 around the jet axis:
ρ(r) = 1
∆r 1 Njet
∑
jets
pT(r−∆r/2,r+∆r/2)
pT(0,R) , 0≤r≤R (1)
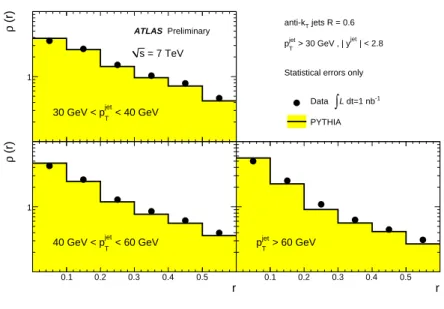
where pT denotes the scalar sum of the transverse momentum of the calorimeter clusters in a given annulus, Njet is the number of jets, and R=0.6 and ∆r=0.1 are used. The observed jet shapes in the inclusive jet sample are presented in Fig. 5 for jets with pTjet >30 GeV and|yjet|<2.8 in different
regions of jet transverse momentum. The distributions peak at low r with most of the jet momentum concentrated at r <0.3, indicating the presence of a collimated flow of particles around the jet axis.
The measurements are reasonably well described by the PYTHIA MC simulated events, which tend to produce jets slighly narrower than the data4).
Jet
R r ∆r
Figure 4: Sketch of the jet shape as a function of the distance to the jet axis.
0.1 0.2 0.3 0.4 0.5
(r)ρ
1
ATLAS Preliminary
< 40 GeV
jet
30 GeV < pT
= 7 TeV s
r
0.1 0.2 0.3 0.4 0.5
(r)ρ
1
< 60 GeV
jet
40 GeV < pT
jets R = 0.6 anti-kT
Statistical errors only | < 2.8 > 30 GeV , | yjet jet
pT
dt=1 nb-1
∫L Data PYTHIA
r
0.1 0.2 0.3 0.4 0.5
1
> 60 GeV
jet
pT
Figure 5:Observed differential jet shapesρ(r)in inclusive jet production for jets with pTjet>30 GeV and|yjet|<
2.8 in different region of jet transverse momentum. The data are compared to PYTHIA Monte Carlo predictions.
The study of the charged particle flow around the jet direction provides additional and independent information on the final state topology, and is used to confirm the calorimeter-based results. The hadronic activity out of the jet cone is studied in inclusive dijet events using tracks, for which the track selection follows that employed in [12] with ptrackT >500 MeV and |ηtrack|<2.5. The results are expressed in terms of the average transverse momentum observed as a function of the distance to the jet axis in the azimuthal direction (see Fig. 6),
< d2pT
|dφ|dy >jets= 1 2R|∆φ|
1 Njet
∑
jets
pT(|φ−∆φ/2|,|φ+∆φ/2|),with 0≤ |φ| ≤π, (2)
4)Previous results on jet profiles in proton-proton collisions at√
s=900 GeV [11] led to similar conclusions.
jet
jet
y
φ
φ
tracks
2R
∆yjj
Figure 6:Sketch of the particle flow as a function of the distance to the jet axis in the azimuthal direction.
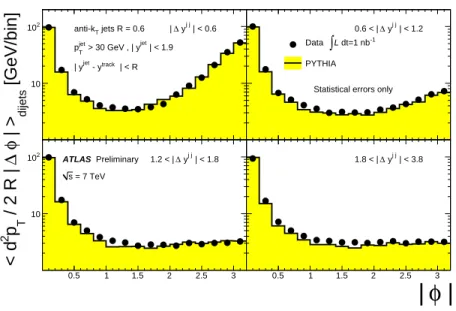
where pT(|φ−∆φ/2|,|φ+∆φ/2|)is the scalar sum of the transverse momentum of the tracks at a given distance φto the jet, and bins of∆φ=0.2 have been considered. Only tracks within the rapidity range occupied by the jet cone are employed. The measurements are carried out for jets with pTjet >30 GeV and |yjet|<1.9, as determined by a maximal tracking coverage of |ηtrack|<2.5, and performed as a function of the rapidity separation between the two leading jets |∆yj j|. Figure 7 shows the observed charged particle flow compared to Monte Carlo simulations. As expected, for|∆yj j|<0.6 the presence of two collimated jets of tracks at |φ| ∼0 and|φ| ∼π are observed. For |∆yj j|>1.2 the jet structure for|φ|<0.6 is followed by a plateau of remaining hadronic activity as|φ|increases. The Monte Carlo simulated samples provide a reasonable description of the data, although tend to slightly underestimate the hadronic activity away from the jet direction.
[GeV/bin] dijets | >φ∆ / 2 R | Tp2 < d
φ |
|
0.5 1 1.5 2 2.5 3
10
102 anti-kT jets R = 0.6 | ∆ yj j | < 0.6 | < 1.9 > 30 GeV , | yjet jet
pT
| < R
track jet - y
| y
0.5 1 1.5 2 2.5 3
10
102 ATLAS Preliminary 1.2 < | ∆ yj j | < 1.8 = 7 TeV
s
0.5 1 1.5 2 2.5 3
10
2 0.6 < | ∆ yj j | < 1.2
dt=1 nb-1
∫L Data PYTHIA
Statistical errors only
0.5 1 1.5 2 2.5 3
10
2 1.8 < | ∆ yj j | < 3.8
Figure 7: Observed charged particle flow in inclusive dijet events for jets with pTjet>30 GeV and|yjet|<1.9, as a function of|φ|with respect to the jet direction and the rapidity separation between the two leading jets. The measurements are compared to Monte Carlo simulations.
7 Summary
In summary, we report on the observation of energetic jets of particles in the final state in proton-proton collisions at √
s =7 TeV, using the ATLAS detector and based on about 1 nb−1 of total luminosity.
Jets are reconstructed using the anti−kT algorithm and calorimeter energy clusters as input. The data are compared to Monte Carlo simulated leading-order plus parton shower QCD events for jets with pTjet >30 GeV and |yjet|<2.8. The kinematic distributions of the jets in the inclusive-jet and dijet samples present the expected shapes of QCD-driven processes. The study of the jet shapes and the charged particle flow in the events confirm that the observed jet signal corresponds to collimated flows of particles in the final state.
References
[1] D. J. Gross and F. Wilczek, Phys. Rev. D 8, 3633 (1973) .
[2] M. Banner et al. (UA2 Collaboration), Phys. Lett. B 118, 203 (1982) G. Arnison et al. (UA1 Collaboration), Phys. Lett. B 123, 115 (1983) F. Abe et al. (CDF Collaboration), Phys. Rev. Lett. 62, 613 (1989) ATLAS Collaboration, ATLAS-CONF-2010-001 .
[3] G. Aad et al., (ATLAS Collaboration), JINST 3 S08003 (2008) . [4] ATLAS Collaboration, ATLAS-CONF-2010-025 .
[5] ATLAS Collaboration, Data-Quality Requirements and Event Cleaning for Jets and Missing Trans- verse Energy Reconstruction with the ATLAS Detector in Proton-Proton Collisions at a Center-of- Mass Energy of√
s=7 TeV, ATLAS-CONF-2010-038 . [6] T. Sj¨ostrand et al., JHEP 05, 026 (2006) .
[7] ATLAS Collaboration, ATLAS Monte Carlo tunes for MC09, ATL-PHYS-PUB-2010-002 (2010) . [8] A. Sherstnev and R.S. Thorne, Eur. Phys. J. C 55, 553 (2008) .
[9] S. Agostinelli et al., Nucl. Instrum. Methods A 506, 250 (2003) . [10] M. Cacciari, G. P. Salam and G. Soyez, JHEP 0804 (2008) 063 . [11] ATLAS Collaboration, ATLAS-CONF-2010-018 .
[12] ATLAS Collaboration, Charged-particle multiplicities in pp interactions at √
s=900 GeV mea- sured with the ATLAS detector at the LHC, Phys. Lett. B 688, 21 (2010) .