ATLAS-CONF-2010-081 11October2010
ATLAS NOTE
ATLAS-CONF-2010-081
August 29, 2010
Track-based underlying event measurements in pp collisions at
√ s = 900 GeV and 7 TeV with the ATLAS Detector at the LHC
The ATLAS collaboration
Abstract
Underlying event measurements with the ATLAS detector at the LHC are presented.
Data were collected using a minimum-bias trigger in December 2009 and March-April 2010
during proton-proton collisions at center of mass energies of 900 GeV and 7 TeV respec-
tively. The observables sensitive to the underlying event, e.g the charged particle density
and the sum and average charged transverse momentum are measured as a function of the
leading track transverse momentum. The angular distribution of the charged tracks and their
transverse momentum with respect to the leading track is also presented, as well as the cor-
relation between mean transverse momentum and charged particle multiplicity. The data
show a higher underlying event activity than that predicted by pre-LHC tunes of the Monte
Carlo models to which it is compared.
1 Introduction
In order to perform precise physics measurements or search for new physics phenomena at hadron col- liders, it is essential to have a good understanding not only of the QCD hard scattering process but also of the accompanying beam–beam remnants (BBR) and the multiple parton interactions (MPI), which are collectively termed the underlying event. The underlying event also receives contributions from initial and final state parton QCD radiation, and on an event-by-event basis it is impossible to separate them out.
Hard interactions can be calculated reliably using perturbative QCD while the softer
1interactions are not calculable within perturbative QCD. Since soft physics processes contributing to the underlying event can not be derived analytically, the main technique involves comparing the data to predictions from different phenomenological models implemented in Monte Carlo (MC) event generators. These programs, reflecting the current understanding of nature, contain many parameters that represent a true uncertainty in the modeling. By measuring the observables sensitive to the underlying event, a deeper insight into different contributing processes can be gained and the Monte Carlo models can be improved.
The ATLAS detector [1] at the Large Hadron Collider (LHC [2]) recorded proton-proton collisions at the center of mass energies of 900 GeV and 7 TeV in December 2009 and March-April 2010 respectively.
Using this data ATLAS has performed measurements of primary charged particle multiplicities in soft
‘minimum bias’ events [3, 4, 5]. While this minimum-bias study is an important ingredient to constrain the phenomenological models used to describe soft hadron interactions, underlying event studies allow us to take advantage of the structure of hadron-hadron collision events. Previously, the underlying event has been measured in dijet and Drell-Yan events at CDF in Run I [6] and Run II [7].
This note reports on the measurement of the underlying event observables from primary charged par- ticles with a momentum component transverse to the beam direction
2p
T> 500 MeV, in the pseudorapid- ity range | η | < 2.5. Primary charged particles are defined as particles with a mean lifetime τ > 0.3 × 10
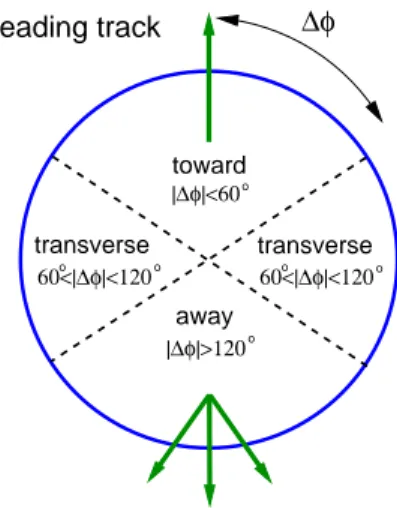
−10s directly produced in pp interactions or from subsequent decays of particles with a shorter lifetime. The track with the largest momentum component transverse to the beam direction is chosen as the direction of the hard scattering [8] which is then used to isolate regions of η–φ space that are sensitive to different aspects of the underlying event. The azimuthal angular difference between charged tracks and the leading track is given by the angular magnitude | ∆φ | = | φ − φ
leading track| , as illustrated in Figure 1, and the three regions are defined as follows,
• | ∆φ | < 60
◦is the “towards region”;
• 60
◦< | ∆φ | < 120
◦is the “transverse region”; and
• | ∆φ | > 120
◦is the “away region.”
The transverse regions are most sensitive to the underlying event, since they are perpendicular to the axis of hardest scattering. The observables examined in this analysis are described in Table 1.
This note is organized as follows. The ATLAS detector is described in Sect. 2. In Sect. 3, the QCD MC models used in this analysis are discussed. Sect 4-7 describes the event selection, background contri- butions, correcting the data back to particle level and estimating the systematic uncertainties respectively.
The results are discussed in Sect. 8 and finally in Sect. 9. the conclusions are presented.
1The term ‘soft’ is used to describe low transverse momentum transfer from initial to final state.
2The ATLAS reference system is a Cartesian right-handed coordinate system, with the nominal collision point at the origin.
The anti-clockwise beam direction defines the positive z-axis, while the positive x-axis is defined as pointing from the collision point to the center of the LHC ring and the positivey-axis points upwards. The azimuthal angleφis measured around the beam axis, and the polar angleθis the angle measured with respect to the z-axis. The pseudorapidity is given byη=−ln tan(θ/2).
∆φ
60<|∆φ|<120 60<|∆φ|<120
transverse transverse away
|∆φ|>120 toward
o
o
o o o
|∆φ|<60o
leading track
Figure 1: Dividing the azimuthal region with respect to the maximum p
Ttrack.
Table 1: Definition of the measured observables in particle and detector level. The particles and tracks are required to have p
T> 0.5 GeV and | η | < 2.5. Tracks are selected if they pass the criteria described in Sect.4. The mean charged particle momentum h p
Ti is constructed on an event-by-event basis and then averaged over the events.
Observable Particle level Detector level
p
leadTMaximum p
Tstable charged particle in the event
Maximum p
Tselected track in the event
h d
2N
ch/dη dφ i Number of stable charged particles per unit η–φ
Number of selected tracks per unit η–φ
h d
2P
p
T/dη dφ i Scalar p
Tsum of stable charged particles per unit η–φ
Scalar p
Tsum of selected tracks per unit η–φ
Std.Deviation of d
2N
ch/dη dφ
Standard deviation of number of stable charged particles per unit η–φ
Standard deviation of number of selected tracks per unit η–φ
Std.Deviation of d
2P
p
T/dη dφ
Standard deviation of scalar p
Tsum of stable charged particles per unit η–φ
Standard deviation of scalar p
Tsum of selected tracks per unit η–φ
h p
Ti
Average p
Tof stable charged particles (require at least 1 charged particle)
Average p
Tof selected tracks
(require at least 1 selected track)
2 The ATLAS detector
The ATLAS detector [1] covers almost the whole solid angle around the collision point with layers of tracking detectors, calorimeters and muon chambers. It has been designed to study a wide range of physics topics at LHC energies. For the measurements presented in this paper, the trigger system and the tracking devices were of particular importance.
The ATLAS inner detector has full coverage in φ and covers the pseudorapidity range | η | < 2.5. It consists of a silicon pixel detector (Pixel), a silicon strip detector (SCT) and a transition radiation tracker (TRT). These detectors cover a sensitive radial distance from the interaction point of 50.5 mm–150 mm, 299–560 mm and 563–1066 mm, respectively, and are immersed in a 2 Tesla axial magnetic field. The inner detector barrel (end-cap) parts consist of 3 (2 × 3) Pixel layers, 4 (2 × 9) layers of double-sided silicon strip modules, and 73 (2 × 160) layers of TRT straws. These detectors have position resolutions of typically 10, 17 and 130 µm for the r-φ coordinate and, in case of the Pixel and SCT, 115 and 580 µm for the r-z coordinate. A track traversing the barrel would typically have 11 silicon hits (3 pixel clusters, and 8 strip clusters), and more than 30 straw hits.
The ATLAS detector has a three-level trigger system: Level 1 (L1), Level 2 (L2) and the Event Fil- ter (EF). For this measurement, the trigger relies on the Beam Pickup Timing devices (BPTX) and the Minimum-Bias Trigger Scintillators (MBTS). The BPTX are composed of electrostatic beam pick-ups attached to the beam pipe ± 175 m from the center of the ATLAS detector. The MBTS are mounted at each end of the detector in front of the liquid-argon endcap-calorimeter cryostats at z = ± 3.56 m and are segmented into eight sectors in azimuth and two rings in pseudorapidity (2.09 < | η | < 2.82 and 2.82 < | η | < 3.84). Data were taken for this analysis using the single arm MBTS trigger, formed from BPTX and MBTS trigger signals. The MBTS trigger was configured to require one hit above threshold from either side of the detector. The MBTS trigger efficiency was studied with a separate prescaled L1 BPTX trigger, filtered to obtain inelastic interactions by inner detector requirements at L2 and EF.
3 QCD Monte Carlo models
Low-p
Tscattering processes may be described by lowest order perturbative QCD 2-to-2 parton scatters, where the divergence of the cross section at p
T= 0 is regulated by phenomenological models. Such models are implemented (and are being actively developed) in several Monte Carlo event generators, which we consider in the data–MC comparisons later in this note. Typically, these models resolve the di- vergent cross-section by means of multiple-parton interations (MPI), augmented with phenomenological partonic-matter distributions, scattering between the unresolved protons, color reconnection [9], and in some cases connections to elastic scattering via the optical theorem and to cut-pomeron models. These models typically contain several parameters, susceptible to tuning against data from pp and p ¯p data at several center of mass energies. This tuning activity has been very active in recent years, and the current standard tunes are being iterated again in response to first LHC data, including that presented in this note [10].
Samples of ten to twenty million MC events were produced for single-diffractive, double-diffractive and non-diffractive processes using the PYTHIA 6.4.21 generator [11] for both the collision energies.
The MC09 [12] set of optimized parameters was used, which employs the MRST LO* parton density
functions
3[13] and the p
T-ordered parton shower, and was tuned to describe underlying event and
minimum-bias data at 630 GeV and 1.8 TeV [14] at CDF in p ¯p collisions. This is the reference tune
throughout this paper, and samples generated with this tune were used to calculate detector acceptances
and efficiencies to correct the data. All events were processed through the ATLAS detector simulation
program [15], which is based on Geant4 [16]. They were then reconstructed and analyzed identically as
for the data. Particular attention was devoted to the description in the simulation of the size and position of the collision beam spot and of the detailed detector conditions during the data-taking runs.
For the purpose of comparing the present measurement to different phenomenological models de- scribing the underlying event, the following additional MC samples were generated: the Perugia0 [17]
PYTHIA tune, in which the soft-QCD part of the event is tuned using only minimum-bias data from the TeVatron and CERN p ¯p colliders; the DW [18] PYTHIA tune, which uses the virtuality-ordered showers and was derived to describe the CDF Run II underlying event and Drell-Yan data.
Finally, PHOJET [19] and HERWIG [20] were used as alternative models. PHOJET describes low p
Tphysics using the two component Dual Parton Model [21, 22], which includes soft hadronic pro- cesses described by Pomeron exchange and semi-hard processes described by perturbative parton scat- tering. PHOJET relies on PYTHIA for the fragmentation of partons. The versions used for this study were shown to agree with previous measurements [14, 23, 24, 25]. PHOJET samples were also passed through full detector simulation for unfolding comparison. HERWIG uses angular-ordered parton show- ers and a cluster hadronisation model. The underlying event is simulated using the JIMMY package [26] which implements an eikonal multiple scattering model for multiple hard QCD scatters, including impact-parameter correlations. JIMMY only simulates hard scatters, and is run with the ATLAS MC09 parameters [12] giving a minimum p
Tcut off of 5.2 GeV at 7 TeV and 3.0 GeV at 900 GeV on the partonic scatters.
4The non-diffractive, single-diffractive and double-diffractive contributions in the generated samples were mixed according to the generator cross-sections to fully describe the inelastic scattering.
4 Event and track selection
All data were taken during the LHC running periods with stable beam and defined beam spot values, between December 6 and 15, 2009 for the analysis with 900 GeV center of mass energy, and during 30th March, 2010 to 27th April, 2010 for the analysis with 7 TeV center of mass energy. In order to perform an inclusive inelastic measurement, the only requirements were to have the MBTS trigger and all Inner Detector subsystems at nominal conditions. During the December data taking period, more than 96% of the Pixel detector, more than 99% of the SCT and more than 98% of the TRT was operational, which improved further in 2010.
To reduce the contribution from backgrounds and secondaries, as well as to minimize the systematic uncertainties, the following criteria were required:
• the presence of a reconstructed primary vertex [27] using at least two tracks, each with:
– p
T> 100 MeV,
– offline reconstruction within the full acceptance range of the inner detector, which has an | η | coverage up to 2.5 with respect to the detector center [28, 29],
– a transverse distance of closest approach with respect to the beam-spot position ( | d
BS0| ) of less than 4 mm,
– uncertainties on the transverse and logitudinal distances of closest approach of σ(d
0BS) <
5 mm and σ(z
0BS) < 10 mm,
– at least one pixel hit, at least four SCT hits and at least six silicon hits in total.
The beam spot information is used both in track pre-selection and to constrain the fit during itera- tive adaptive vertex reconstruction and vertices incompatible with the beam spot are removed. The
4For this reason the agreement with data in the region where the maximum track pTis well below this momentum is not expected to be good.
vertices are ordered by P
p
T, which is strongly correlated with the total number of tracks at the vertex. The highest P
p
Tvertex is considered the primary interaction vertex of the event.
Pileup removal was done by rejecting events that have a second primary vertex with more than 3 tracks in the same bunch crossing. If the second vertex has 3 or fewer tracks, all tracks from the event that pass the selection are kept.
• at least one track with:
– p
T> 1 GeV,
– a minimum of one pixel and six SCT hits
5,
– a hit in the innermost pixel layer (b-layer), if the module was active,
– transverse and weighted longitudinal impact parameters with respect to the event-by-event primary vertex are required to be respectively | d
0| < 1.5 mm and | z
0| · sin θ < 1.5 mm
6, – for tracks with p
T> 10 GeV , χ
2probability of track fit > 0.01 was required in order to
remove mismeasured tracks
7.
The track with the maximum transverse momentum in each event, referred to as the leading track in the event, was used to define the direction of hard scatter, with respect to which the underlying event was measured. To reject events where systematic effects due to the leading track selection potentially become large and also to reduce the contributions from diffractive processes to the hard scattering com- ponent, only leading tracks having p
T> 1 GeV were selected. All the other tracks were required to have p
T> 500 MeV, and at least one such track were required with the same silicon and impact parameter requirements as given earlier for tracks with p
T> 1 GeV. Tracks with p
T> 500 MeV, are less prone than lower p
Ttracks to large inefficiencies and systematic uncertainties resulting from material interac- tions inside the tracking volume. Whenever possible, the tracks were extrapolated to include hits in the TRT. Typically, 88% of tracks inside the TRT acceptance ( | η | < 2.0) include a TRT extension, which significantly improves the momentum resolution.
After these selections, for the 900 GeV data, 189164 events remain containing 1478900 selected tracks, corresponding to an integrated luminosity of 7 µb
−1. For the 7 TeV data, 6927129 events were selected, which contain 89868306 selected tracks, corresponding to an integrated luminosity of 168 µb
−1. Fewer than 1% of the selected tracks in the simulation are found to originate from diffractive events in the MC models considered here.
5 Background contributions
5.1 Beam backgrounds
The amount of beam-background remaining following the full event selection was estimated using the number of Pixel hits which were not associated to a reconstructed track. This multiplicity includes unas- signed hits from low transverse momentum looping tracks, but is dominated at higher multiplicities by hits from charged particles produced in beam-background interactions. The vertex requirement removes most of the beam background events and the contribution from it is found to be below 0.1%. As the level of backgrounds was found to be very low, no explicit background subtraction was performed.
5This is a tighter requirement than the 7 silicon hits requirement at the track reconstruction step.
6The factor of sinθcompensates for the sinθin the denominator of the uncertainty of z0derived from the measured distance of closest approach.
7A long non Gaussian tail in the track momentum resolution combined with a steeply falling pT spectrum leads to an observed migration of very low momentum particles to very high reconstructed pT, which are referred to as mismesaured
5.2 Fraction of secondary tracks
The primary charged-particle multiplicities are measured from selected-track distributions after correct- ing for the fraction of secondary and badly reconstructed tracks in the sample. The potential background from fake tracks is found to be less than 0.01% from MC studies. Non-primary tracks are predominantly from hadronic interactions, photon conversions and decays of long-lived particles. The side-band regions of the transverse and longitudinal impact parameters from data were used to find a scaling factor of 1.3 for tracks in MC to get a better agreement with the data. The MC was found to correctly reproduce the tails of the distributions of the data [3, 5]. The scaled MC was then used to estimate the fraction of secondaries in the selected-track sample, which is found to be at most 2.05% for events in both 900 GeV and 7 TeV collisions.
6 Correcting data to particle level
The data were corrected back to charged primary particle spectra satisfying the event-level requirement of at least one primary charged particle within p
T> 1 GeV and | η | < 2.5. A two step correction process was used, where first the event and track efficiency corrections were applied, then additionally a bin-by-bin unfolding was performed to account for possible bin migrations and any remaining detector effects.
6.1 Event-level correction
Trigger and vertexing efficiencies were measured [5] as a function of the number of tracks passing all the track selection requirements except for the constraints with respect to the primary vertex. In this case the transverse impact parameter with respect to the beam spot (BS) was required to be less than 1.8 mm, which is the same value used in the primary vertex reconstruction pre-selection. The number of tracks per event that pass these criteria is referred to as N
selBS.
• The efficiency, ǫ
trig(N
selBS) of the MBTS scintillator trigger is determined from data using an orthog- onal trigger. It consists of a random trigger that requires only the event coinciding with colliding bunches and have at least 4 pixel clusters and at least 4 SCT space points at L2. The trigger is slightly less efficient ( ∼ 99%) for low multiplicity events, and almost fully efficient otherwise. It showed no dependence on the p
Tand pseudorapidity distributions of the selected tracks.
• The vertex reconstruction efficiency, ǫ
vtx(N
selBS, h η i ) is also measured in data, by taking the ratio of triggered events with a reconstructed vertex and the total number of triggered events. For events containing fewer than 3 selected tracks, the efficiency was found to depend on the projection along the beam axis of the separation between the two tracks, ∆z
0BS, when the tracks are extrapolated to the beam spot. The efficiency amounts to approximately 90% for the lowest bin of N
selBSand rapidly rises to 100%.
• A correction factor, ǫ
ld trk(ǫ
trk) accounts for the probability that due to the tracking inefficiency none of the candidate leading tracks with p
T> 1 GeV are reconstructed in an event, resulting in that event failing the selection criteria. A partial correction for this is provided by determining in each event, using the known tracking efficiencies, the probability that all possible reconstructed leading tracks would be missed, and then dividing the weight for the event by this probability.
However, this process will in general yield an excessive correction since the correct weight should be determined using the number and distributions of true charged particles with p
T> 1 GeV and
| η | < 2.5 rather than the distributions of reconstructed tracks. This leads to an over-estimation of
the probability for the event to be omitted. Nevertheless, this correction represents a good estimate
of the efficiency, given the knowledge of tracks in each event. The efficiency was found to be >98%
in low p
Tbins and almost 100% in high p
Tbins. The systematic uncertainty for this correction is included as a part of the tracking efficiency systematic uncertainty. The correction is made with the expectation that the final unfolding in the form of bin-by-bin corrections will provide the small additional correction that is needed.
The total correction applied to account for events lost due to the trigger, vertex, and tracking requirements (in bins of number of tracks with p
T> 0.5 GeV) is given by,
w
ev= 1
ǫ
trig(N
selBS) · 1
ǫ
vtx(N
selBS, h η i ) · 1
ǫ
ld trk(ǫ
trk) , (1)
where ǫ
trig(N
selBS), ǫ
vtx(N
selBS, h η i ) and ǫ
ld trk(ǫ
trk) are the trigger, vertex reconstruction and leading track reconstruction efficiencies discussed earlier.
6.2 Track-level correction
The track-reconstruction efficiency in each bin of the p
T–η kinematic plane was determined from MC.
The track-reconstruction efficiency is defined as:
ǫ
bin(p
T, η) = N
recmatched(p
T, η)
N
gen(p
T, η) , (2)
where N
recmatched(p
T, η) is the number of reconstructed tracks in a given bin matched to a generated charged particle, and N
gen(p
T, η) is the number of generated particles in that bin. The matching between a gen- erated particle and a reconstructed track was done using a cone-matching algorithm in the η–φ plane and associating the particle to the track with the smallest ∆R = p
(∆φ)
2+ (∆η)
2within a cone of ra- dius ∆R < 0.15. To reduce fake matching, a common pixel hit between the track and the truth particle was also required. The resuling inefficiencies include a 5% loss due to the track selection used in this analysis, half of which is due to the silicon hit requirements and half due to the impact parameter require- ments. The efficiencies are slightly different between the two energies because of the different number and configuration of the disabled pixel and SCT modules in the 2009 than in 2010.
A weight is applied on a track by track basis to all track level histograms according to:
w
trk= 1
ǫ
trk(p
T, η) · (1 − f
sec(p
T)) · (1 − f
okr(p
T, η)) · (1 − f
fake), (3) where ǫ
trk(p
T, η) is the track-reconstruction efficiency described earlier, f
secis the fraction of secondaries, f
fakeis the fraction of fakes and f
okris the fraction of selected tracks for which the corresponding primary particles are outside the kinematic range.
6.3 Final unfolding step
The efficiency corrections described so far do not account for bin-by-bin migrations, nor for the pos- sibility of not reconstructing the leading particle in the event as the leading track (reorientation of an event). To account for these effects, an additional bin-by-bin unfolding was applied to all distributions after applying the event- and track-level efficiency corrections described above.
The unfolding factors are evaluated separately in each bin for each observable listed in Table 1:
U
bin= V
GenbinV
Reco, effbin corr(4)
where V
Genbinand V
Reco, effbin corrrespectively represent the generator level MC value of the observable and the reconstructed MC value after applying the event- and track-level efficiency corrections at each bin.
The corrected value for an observable in data is found by multiplying its measured value by this unfolding factor in each bin.
The unfolding factor takes care of the possible bin-to-bin migration. In addition, the over-correction for the possibility that all possible leading tracks are missed in the reconstruction, as described earlier, is accounted for in this unfolding. This unfolding factor is within 5% of unity in the lowest p
Tbins due to the migration effects, and lesser for higher p
Tbins.
7 Systematic uncertainties
A thorough study of contributions to systematic uncertainties was performed and were propagated to the final distributions and added in quadrature to obtain a net systematic uncertainty σ. This error is assumed to be fully correlated between bins.
Systematic uncertainties from tracking efficiency were studied [3, 5], and the largest were found to be:
• on the amount of material in the inner detector. This was assessed to be 2% at barrel region and rising to over 7% for 2.3 < | η | < 2.5.
• due to χ
2probability cut. The maximum difference between the fraction of events in data and MC that passes this cut was found be 10%, which was taken as an conservative estimate of systematic uncertainty.
The relatively large uncertainty for higher p
Ttracks results in larger uncertainties in higher p
Tbins in toward regions plot, which includes the leading track.
The remaining contributions to the overall systematic uncertainty results from the specific unfolding method used in this analysis. The exact bin-by-bin unfolding corrections are in general influenced by the number of charged particles and p
Tdistributions so there will be some dependence on the event gen- erator model, which introduces a second source of systematic error. In order to estimate this error it is necessary to compare different plausible event generation models. The available event generators which are currently expected capable of a reasonable description of these observables are the PYTHIA and PHOJET codes, with several distinct parameter tunes for PYTHIA. The maximal variation is seen be- tween PYTHIA and PHOJET, rather than between different PYTHIA tunes, and the difference is hence taken as representative of a model-dependence uncertainty. Where the PHOJET sample has sufficient statistics, it is seen that the required correction multiplier differs beyond the statistical fluctuations be- tween PHOJET and PYTHIA at worst by 4% in the lowest p
Tbins, and 2% everywhere else. Since this uncertainty is independent of any efficiency systematics it is summed in quadrature with the efficiency systematic uncertainty and the statistical uncertainty. In addition to the model dependent uncertainty in the bin-by-bin unfolding, there is also a statistical uncertainty due to the finite size of the Monte Carlo sample. The statistical fluctuation of the PYTHIA unfolding factor is found to be negligible for low p
Tbins, but rises to be the most significant contribution at higher p
Tbins.
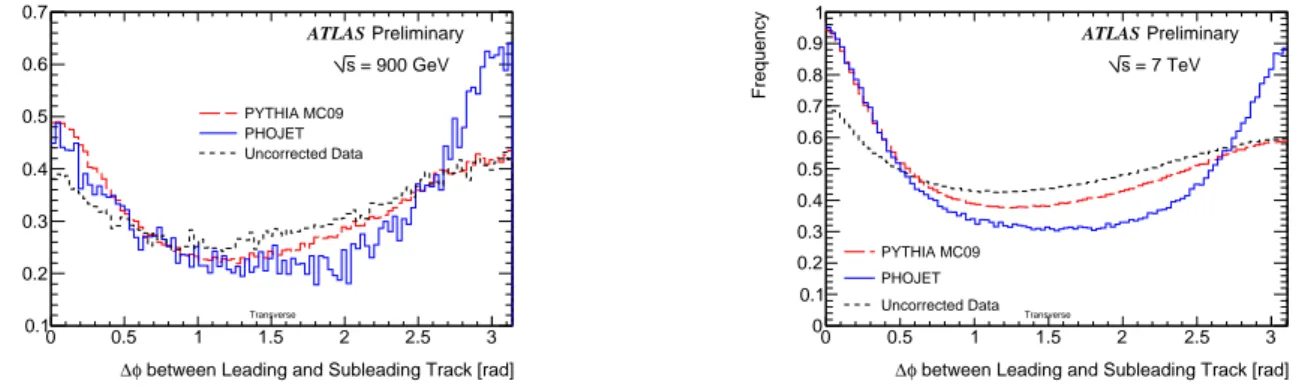
The | ∆φ | between the reconstructed track with the second highest p
T(sub-leading) and the leading
track is shown in Figure 2. If the sub-leading charged particle is reconstructed as the leading track in
place of the actual leading particle, the most frequent scenario would be that the sub-leading charged
particle lies in in the actual toward or away regions. In either of these cases, the re-orientation of the
event has a minimal effect on the p
Tand number density distributions. However, if the reconstructed
leading track lies in what should have been the transverse region defined by the true leading particle, the
effect will be to reduce the densities in the towards and away regions while increasing the density in the
transverse region. The bin-by-bin unfolding derived from the MC compensates for this effect, provided that it occurs with the frequency that is predicted by the MC. So this distribution is used to estimate the relative frequency with which an event is re-oriented such that the true towards and away regions lie in the transverse region identified by the reconstruction. Comparing this distribution in uncorrected data to the same distributions (uncorrected and reconstructed) predicted by PYTHIA and PHOJET, it is seen that both generator models predict fewer event reorientations of this type. The final correction to the data uses bin-by-bin unfolding factors that are derived from the PYTHIA sample, so the relative magnitude of the systematic uncertainty associated with this effect can be estimated by subtracting the PYTHIA and PHOJET probabilities, and this difference is comparable with the difference of between PYTHIA and data. Consequently, it can be concluded that the systematic error assessed earlier for this effect by a comparison of PYTHIA and PHOJET corrections is sufficient.
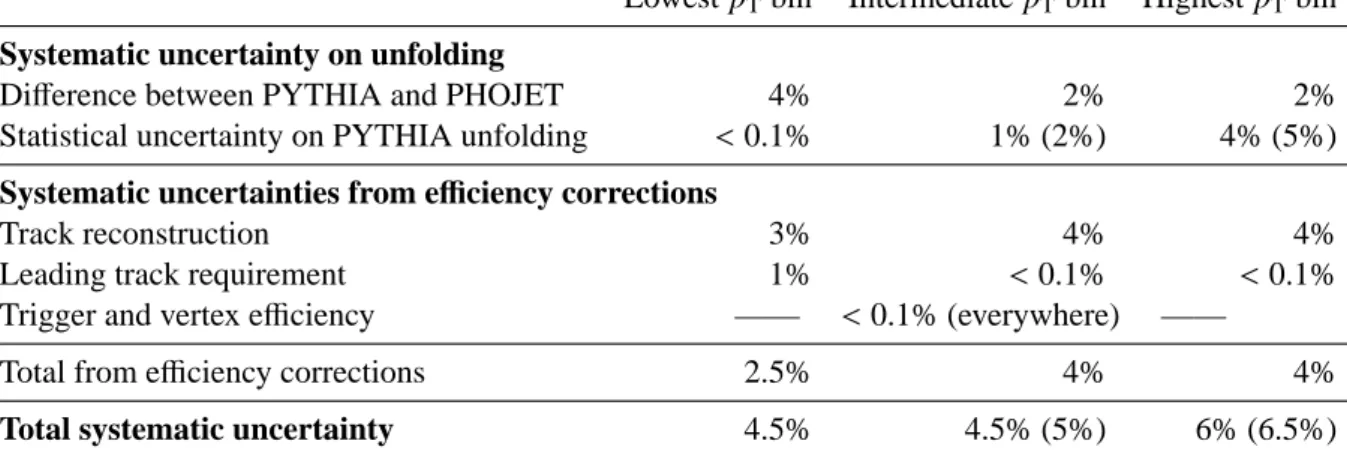
Table 2 summarizes the various contributions to the systematic uncertainties.
between Leading and Subleading Track [rad]
φ
∆
0 0.5 1 1.5 2 2.5 3
Frequency
0.1 0.2 0.3 0.4 0.5 0.6 0.7
Preliminary ATLAS
= 900 GeV s
Transverse
PYTHIA MC09 PHOJET Uncorrected Data
between Leading and Subleading Track [rad]
φ
∆
0 0.5 1 1.5 2 2.5 3
Frequency
0 0.1 0.2 0.3 0.4 0.5 0.6 0.7 0.8 0.9 1
Preliminary ATLAS
= 7 TeV s
Transverse
PYTHIA MC09 PHOJET Uncorrected Data
Figure 2: Difference in φ between the leading and the sub-leading track in PYTHIA, PHOJET and in
uncorrected data. The left plot is for 900 GeV and the right is for 7 TeV. The MC curves are shown after
the full detector simulation.
Table 2: Summary of systematic uncertainties, shown in the lowest, intermediate and highest p
Tbins. For the analysis with 7 TeV (900 GeV) center of mass energy data, the lowest p
Tbin refers to p
leadT= 1.0 − 1.5 GeV, the intermediate p
Tbin refers to p
leadT= 9 − 10 GeV (4 − 5 GeV), and the highest p
Tbin refers to p
leadT= 18 − 20 GeV (9 − 10 GeV). The uncertainties are calculated from an example distribution, the transverse region charged P
p
Tplot, and all the other profiles are estimated to have comparable or less systematic uncertainty. Each uncertainty is given relative to the profile value at that stage in the correction sequence. In the cases where the uncertainties are different for 900 GeV and 7 TeV analysis, the 900 GeV value is shown in the parenthesis.
Lowest p
Tbin Intermediate p
Tbin Highest p
Tbin Systematic uncertainty on unfolding
Difference between PYTHIA and PHOJET 4% 2% 2%
Statistical uncertainty on PYTHIA unfolding < 0.1% 1% (2%) 4% (5%) Systematic uncertainties from e ffi ciency corrections
Track reconstruction 3% 4% 4%
Leading track requirement 1% < 0.1% < 0.1%
Trigger and vertex efficiency —— < 0.1% (everywhere) ——
Total from efficiency corrections 2.5% 4% 4%
Total systematic uncertainty 4.5% 4.5% (5%) 6% (6.5%)
8 Results and discussions
The corrected distributions for the underlying event observables are compared to predictions of models tuned to a wide range of measurements and phase space. The data are presented as inelastic inclusive distributions with minimal model dependent corrections to facilitate the comparison. The transverse, toward and away regions each have an area of ∆φ∆η = 10 π/3 in η–φ space, so the density of of tracks h d
2N
ch/dη dφ i or transverse momentum sum h d
2P
p
T/dη dφ i are constructed by dividing the mean values by the corresponding area. For the higher values of leading track p
T, the statistics is limited for the data, so the plots are only shown in the p
Trange where sufficient statistics are available.
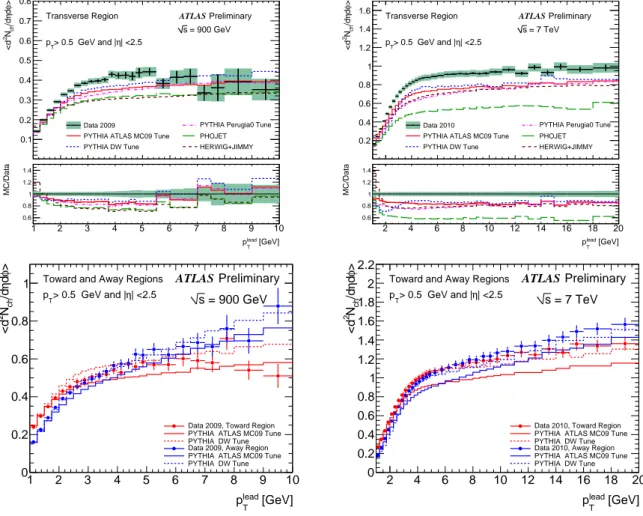
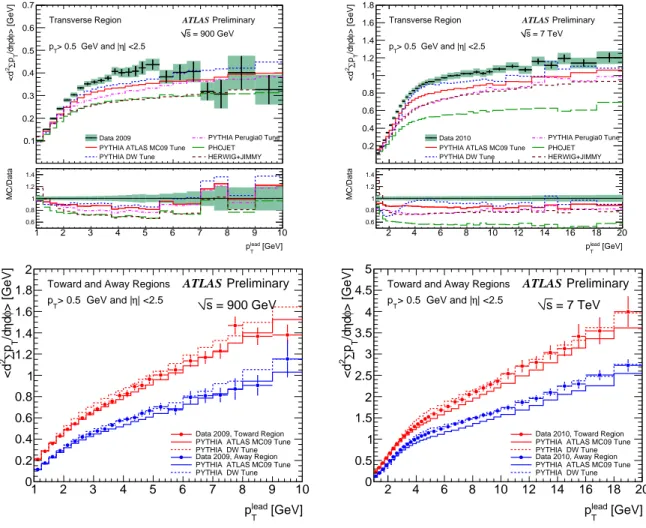
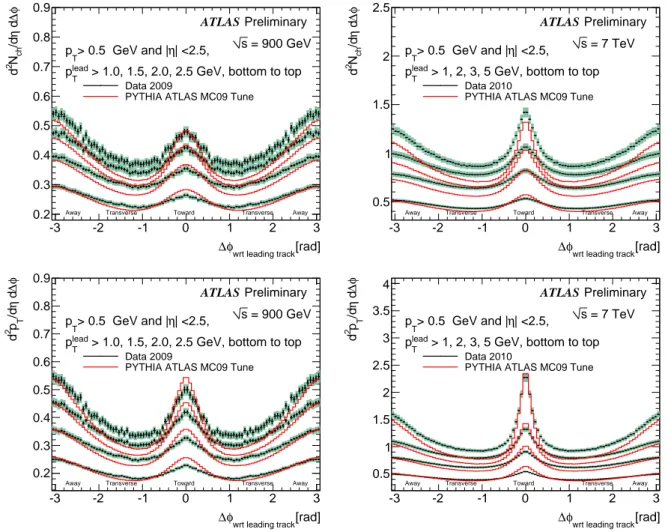
In Figure 3 the charged particle multiplicity density is shown as a function of the leading track transverse momentum at the center of mass energies of 900 GeV and 7 TeV, in the transverse region at the top, toward and away regions at the bottom. The data, corrected back to the particle level, is compared with predictions from PYTHIA with the ATLAS MC09, PYTHIA DW, PYTHIA Perugia0 tunes, HERWIG +JIMMY, and to PHOJET. The ratios of data to MC predictions are shown for the transverse region. In the transverse region, the error bars show the statistical uncertainty while the shaded area shows the combined statistical and systematic uncertainty, while in the away and toward region overlay plots the error bars show the combined statistical and systematic uncertainty.
All the pre-LHC MC tunes considered show 10–15% lower activity than the data in the plateau part of the transverse region with sufficient statistics. This is similar to what was observed in [3, 4]. The PYTHIA tune DW is seen to be the closest to data for the transverse region, and it in fact agrees with the data in the toward and away regions. The most significant difference is seen for the PHOJET and HERWIG generator. The underlying event activity is seen to increase by a factor of approximately two going from 900 GeV to 7 TeV data, which is roughly consistent with the increase predicted by MC. The toward and away regions are dominated by the jet-like rising profiles, in contrast to the plateau in the transverse region. The 900 GeV and 7 TeV data show the same trend.
For the 900 GeV data, the average number of charged particles in the transverse region doubles in go- ing from p
leadT= 1.5 GeV to 3 GeV and then forms an approximately constant ‘plateau’ for p
leadT> 3 GeV.
If we assume the underlying event to be uniform in azimuthal angle φ and pseudorapidity η, then for p
leadT> 3 GeV, the charged particle density of 0.4 translates to about 2.5 particles per unit η (extrap- olating to the full φ space) on average per event, compared to the corresponding number of 1.333 ± 0.003 (stat.) ± 0.040 (syst.) obtained in the ATLAS minimum-bias measurement [4] with p
Tthreshold of 500 MeV.
For the 7 TeV data, the average number of charged particles in the transverse region doubles in going from p
leadT= 2 GeV to 5 GeV and again forms an approximately constant ‘plateau’ for p
leadT>
5 GeV. If we assume the underlying event to be uniform in azimuthal angle φ and pseudorapidity η, then for p
leadT> 5.0 GeV, the charged particle density of 0.8 translates to about 5 particles per unit η (extrapolating to the full φ space) on average per event, compared to the corresponding number of 2.418 ± 0.004 (stat.) ± 0.076 (syst.) obtained in the ATLAS minimum-bias measurement [4] p
Tthresh- old of 500 MeV.
It can be concluded that the charged particle density in the underlying event, in events with a leading track in the plateau region (above ∼ 3 or 5 GeV for the 900 GeV or 7 TeV data respectively), is about a factor of two larger than the number of charged particles per unit rapidity seen in the inclusive minimum- bias spectrum. This is consistent with the selection effect for more momentum exchange in these events, and the expected absence of diffractive contributions to the events which populate the plateau region.
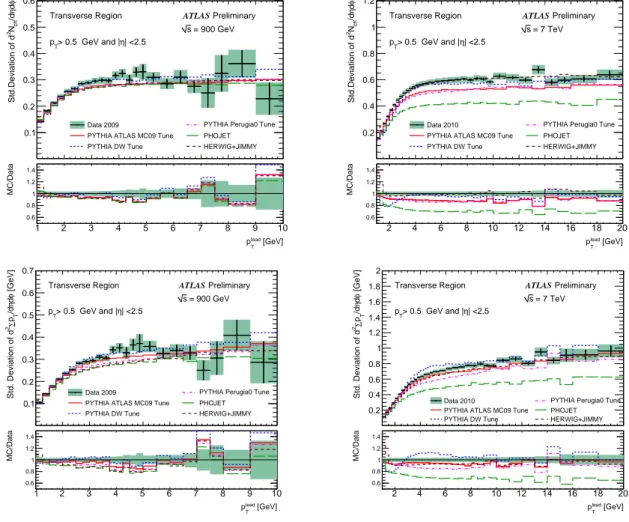
In Figure 4 the charged particle scalar transverse momentum sum density is shown as a function of the
leading track transverse momentum at the center of mass energies of 900 GeV and 7 TeV, in the transverse
region at the top, toward and away regions at the bottom. Again, the data corrected back to the particle
level is compared with predictions from the PYTHIA ATLAS MC09, PYTHIA DW, PYTHIA Perugia0
tunes, and to PHOJET and HERWIG +JIMMY. The ratios of data to MC predictions are shown for the transverse region. In the transverse region, the error bars show the statistical uncertainty while the shaded area shows the combined statistical and systematic uncertainty, while in the away and toward region overlay plots the error bars show the combined statistical and systematic uncertainty.
All the MC tunes considered show 10–15% lower p
Tsum than the data in the plateau part of the transverse region with sufficient statistics. The PYTHIA tune DW is seen to be the closest to data for the transverse region, but it slightly overshoots the data in the toward and away regions. The underlying event p
Tsum is seen to increase slightly more than twice going from 900 GeV to 7 TeV data, which is roughly consistent with the increase predicted by MC.
The toward and away regions are again dominated by the jet-like rising profiles, in contrast to the plateau in the transverse region. The toward region includes the leading track, and it has a higher sum p
Tthan the away region, since there is more probability of higher p
Tparticles being produced in association with the leading p
Tparticle. In the toward region the highest fraction of energy has been allocated to a single track. That has implicitly reduced the number of additional tracks in that region, since there is less remaining energy to be partitioned. As a result the multiplicity of charged particles is slightly lower in the toward region in comparison to the away region for high p
leadT. The 900 GeV and 7 TeV data show the same trend.
In Figure 5 the standard deviation for the charged particle multiplicity density and charged particle scalar transverse momentum sum density are shown against the leading track transverse momentum at the center of mass energies of 900 GeV and 7 TeV. The data corrected back to the particle level is compared with predictions from PYTHIA ATLAS MC09, PYTHIA DW, PYTHIA Perugia0 tunes, HERWIG +JIMMY and to PHOJET in the upper plots, and the ratios of data to MC predictions are shown in the lower plots. The error bars show the statistical uncertainty while the shaded area shows the combined statistical and systematic uncertainty.
The mean and standard deviation of the p
Tdensity in the transverse region define a range of additional energy that jets may acquire due to a uniform underlying event. The uncertainty of the estimated standard deviation is assumed to be small enough that error propagation by a single differentiation is sufficient.
The distributions are found to have the same shapes as the corresponding observables. Comparing the profiles of the mean track multiplicity to the standard deviation of the track multiplicity, it is seen that the standard deviation is somewhat lower. If the underlying event were populated by particles that are produced independently, a Poisson distribution for their shape would be expected, in which case the standard deviation would be the square root of the mean value. In fact the measured standard deviation is observed to be roughly 1.6 in excess of the square root of the mean, suggests that the tracks that are observed in the transverse region are not independently produced. The 900 GeV and 7 TeV data show the same trend.
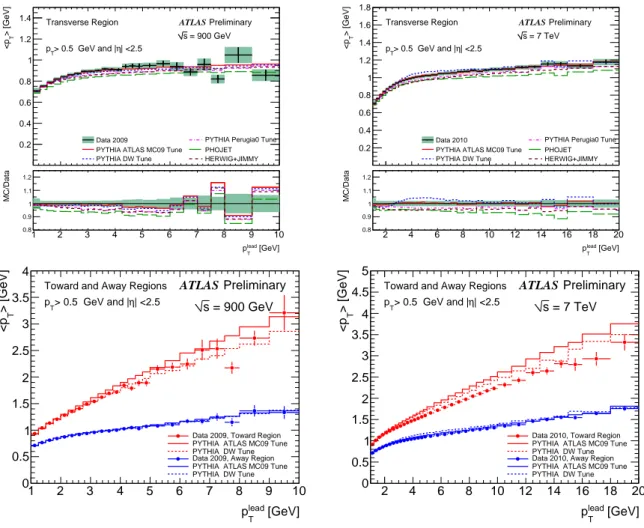
In Figure 6 the charged particle scalar transverse momentum average is shown as a function of the leading track transverse momentum at the center of mass energies of 900 GeV and 7 TeV, in the transverse region at the top, toward and away regions at the bottom. Again, the data corrected back to the particle level is compared with predictions from the PYTHIA ATLAS MC09, PYTHIA DW, PYTHIA Perugia0 tunes, and to PHOJET and HERWIG +JIMMY. The ratios of data to MC predictions are shown for the transverse region. In the transverse region, the error bars show the statistical uncertainty while the shaded area shows the combined statistical and systematic uncertainty, while in the away and toward region overlay plots the error bars show the combined statistical and systematic uncertainty.
All the MC tunes considered again show somehwat lower mean p
Tthan the data in the plateau
part of the transverse region with sufficient statistics. The underlying event mean p
Tis seen to increase
slightly more than twice going from 900 GeV to 7 TeV data, which is roughly consistent with the increase
predicted by MC. The toward and away regions are again dominated by the jet-like rising profiles, in
contrast to the plateau in the transverse region. The toward region includes the leading track, and it
has a higher mean p
Tthan the away region, since there is more probability of higher p
Tparticles being produced in association with the leading p
Tparticle. The 900 GeV and 7 TeV data show the same trend.
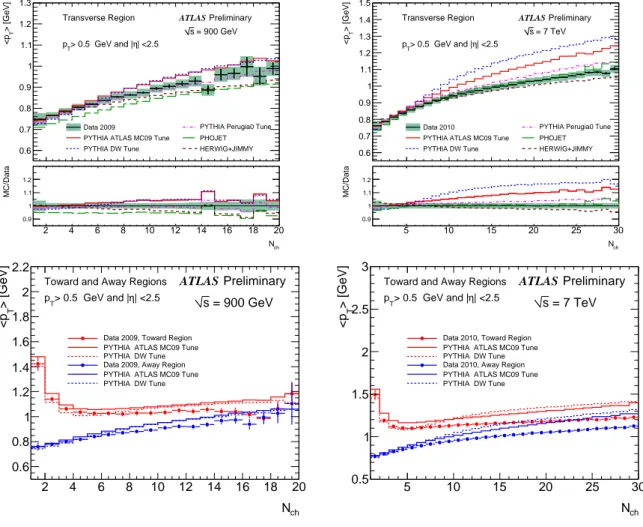
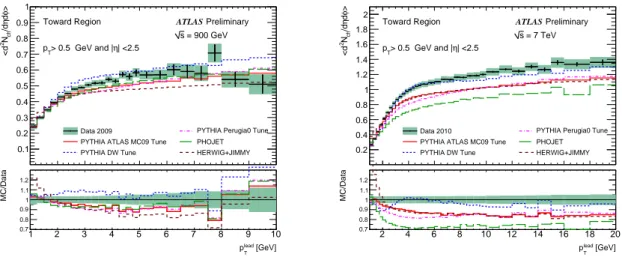
Another interesting observable, which is a measure of the amount of hard (perturbative QCD) versus soft (non-perturbative QCD) processes contributing to the underlying event, is the correlation between the mean p
Tof charged particles and the charged particle multiplicity in the different regions. These plots are constructed on an event-by-event basis by dividing the the total track p
Tin a region by the number of tracks in that region. Figure 7 show this plot at the center of mass energies of 900 GeV and 7 TeV, in the transverse region at the top, toward and away regions at the bottom. The data is corrected back to the particle level, where the observables are calculated only in the corresponding regions, and is compared with predictions from the PYTHIA ATLAS MC09, PYTHIA DW, PYTHIA Perugia0 tunes, and to PHOJET and HERWIG +JIMMY. The ratios of data to MC predictions are shown for the trans- verse region. In the transverse region, the error bars show the statistical uncertainty while the shaded area shows the combined statistical and systematic uncertainty, while in the away and toward region overlay plots the error bars show the combined statistical and systematic uncertainty. The same trend is seen for all considered tunes.
Profiles in all the regions are very similar. The profile of the toward region is essentially determined by the requirement of a track with p
T> 1 GeV. When there is a low number of tracks, the toward region contains just the leading track. As the number of tracks increases the average is reduced, but at some point a ‘jet-like’ structure begins to form, and the rise of the mean p
Tis observed again. The 900 GeV and 7 TeV data show the same trend.
If only the softer BBR part contributed, then the mean p
Twould not depend on the charged particle multiplicity. On the other hand, if semi-hard (harder than the beam-beam remnants, but not as hard as the primary 2-to-2 hard scattering) multiple parton scattering also contributes, then demanding large multiplicity would preferentially select the harder process and would lead to a higher mean p
Tcompared to only BBR, which is observed here. The 900 GeV and 7 TeV data show the same trend, with slightly harder spectra for the higher center of mass energy.
The angular distribution of the charged particle number and transverse momentum densities at the center of mass energies of 900 GeV and 7 TeV are plotted in Figure 8 with respect to the leading track for the event, where the leading track is rotated to φ = 0 and is excluded from the distributions. The data corrected back to the particle level for different leading track p
Tslices are compared with predictions from the PYTHIA ATLAS MC09. This distribution has been constructed by reflecting | ∆φ | , i.e. the region − π ≤ ∆φ < 0 is an exact mirror image of the measured | ∆φ | region shown in 0 ≤ ∆φ ≤ π.
The error bars show the statistical uncertainty while the shaded area shows the combined statistical and systematic uncertainty.
These distributions show a significant difference in shape between data and MC predictions. With the
increase of the leading p
T, the development of ‘jet-like’ structure can be observed, and the corresponding
sharper rise in transverse regions compared to the MC. The saturation at higher p
Tindicates the plateau
region seen in Figure 3 and in Figure 4. PYTHIA tunes essentially predict a larger correlation than is
seen in the data, and this discrepancy in toward region associated particle density was also observed at
CDF [8].
[GeV]
lead pT
1 2 3 4 5 6 7 8 9 10
MC/Data
0.6 0.8 1 1.2
1.41 2 3 4 5 6 7 8 9 10
>φdη/dchN2<d
0.1 0.2 0.3 0.4 0.5 0.6 0.7 0.8
Transverse Region
= 900 GeV s
| <2.5 η
> 0.5 GeV and | pT
Preliminary ATLAS
Data 2009
PYTHIA ATLAS MC09 Tune PYTHIA DW Tune
PYTHIA Perugia0 Tune PHOJET HERWIG+JIMMY
[GeV]
lead pT
2 4 6 8 10 12 14 16 18 20
MC/Data
0.6 0.8 1 1.2
1.4 2 4 6 8 10 12 14 16 18 20
>φdη/dchN2<d
0.2 0.4 0.6 0.8 1 1.2 1.4
1.6 Transverse Region
= 7 TeV s
| <2.5 η
> 0.5 GeV and | pT
Preliminary ATLAS
Data 2010
PYTHIA ATLAS MC09 Tune PYTHIA DW Tune
PYTHIA Perugia0 Tune PHOJET HERWIG+JIMMY
[GeV]
lead
pT
1 2 3 4 5 6 7 8 9 10
>φdη/dchN2<d
0 0.2 0.4 0.6 0.8
1 Toward and Away Regions
= 900 GeV
| <2.5 s η
> 0.5 GeV and | pT
Preliminary ATLAS
Data 2009, Toward Region PYTHIA ATLAS MC09 Tune PYTHIA DW Tune Data 2009, Away Region PYTHIA ATLAS MC09 Tune PYTHIA DW Tune
[GeV]
lead
pT
2 4 6 8 10 12 14 16 18 20
>φdη/dchN2<d
0 0.2 0.4 0.6 0.8 1 1.2 1.4 1.6 1.8 2 2.2
Toward and Away Regions
= 7 TeV
| <2.5 s η
> 0.5 GeV and | pT
Preliminary ATLAS
Data 2010, Toward Region PYTHIA ATLAS MC09 Tune PYTHIA DW Tune Data 2010, Away Region PYTHIA ATLAS MC09 Tune PYTHIA DW Tune
Figure 3: ATLAS data at 900 GeV (left) and at 7 TeV (right) corrected back to particle level, showing
the density of the charged particles h d
2N
ch/dη dφ i with p
T> 0.5 GeV and | η | < 2.5 as a function of
the leading track p
T. The top plots show the comparison of data in the transverse region defined by the
leading track with PYTHIA ATLAS MC09, DW and Perugia0 tunes, HERWIG + JIMMY and PHOJET
predictions. The error bars show the statistical uncertainty while the shaded area shows the combined
statistical and systematic uncertainty. In the bottom plots the data in toward and away regions, defined
by the leading track is compared with PYTHIA ATLAS MC09 and DW tune predictions, where the error
bars represent the combined statistical and systematic uncertainty.
[GeV]
lead pT
1 2 3 4 5 6 7 8 9 10
MC/Data
0.6 0.8 1 1.2
1.41 2 3 4 5 6 7 8 9 10
> [GeV]φdη/dTp∑2<d
0.1 0.2 0.3 0.4 0.5 0.6 0.7
Transverse Region
= 900 GeV s
| <2.5 η
> 0.5 GeV and | pT
Preliminary ATLAS
Data 2009
PYTHIA ATLAS MC09 Tune PYTHIA DW Tune
PYTHIA Perugia0 Tune PHOJET HERWIG+JIMMY
[GeV]
lead pT
2 4 6 8 10 12 14 16 18 20
MC/Data
0.6 0.8 1 1.2
1.4 2 4 6 8 10 12 14 16 18 20
> [GeV]φdη/dTp∑2<d
0.2 0.4 0.6 0.8 1 1.2 1.4 1.6 1.8
Transverse Region
= 7 TeV s
| <2.5 η
> 0.5 GeV and | pT
Preliminary ATLAS
Data 2010
PYTHIA ATLAS MC09 Tune PYTHIA DW Tune
PYTHIA Perugia0 Tune PHOJET HERWIG+JIMMY
[GeV]
lead
pT
1 2 3 4 5 6 7 8 9 10
> [GeV]φdη/d Tp∑2 <d
0 0.2 0.4 0.6 0.8 1 1.2 1.4 1.6 1.8 2
Toward and Away Regions
= 900 GeV
| <2.5 s η
> 0.5 GeV and | pT
Preliminary ATLAS
Data 2009, Toward Region PYTHIA ATLAS MC09 Tune PYTHIA DW Tune Data 2009, Away Region PYTHIA ATLAS MC09 Tune PYTHIA DW Tune
[GeV]
lead
pT
2 4 6 8 10 12 14 16 18 20
> [GeV]φdη/d Tp∑2 <d
0 0.5 1 1.5 2 2.5 3 3.5 4 4.5 5
Toward and Away Regions
= 7 TeV
| <2.5 s η
> 0.5 GeV and | pT
Preliminary ATLAS
Data 2010, Toward Region PYTHIA ATLAS MC09 Tune PYTHIA DW Tune Data 2010, Away Region PYTHIA ATLAS MC09 Tune PYTHIA DW Tune
Figure 4: ATLAS data at 900 GeV (left) and at 7 TeV (right) corrected back to particle level, showing the scalar P
p
Tdensity of the charged particles h d
2P
p
T/dη dφ i with p
T> 0.5 GeV and | η | < 2.5 as a function
of the leading track p
T. The top plots show the comparison of data in the transverse region defined by the
leading track with PYTHIA ATLAS MC09, DW and Perugia0 tunes, HERWIG + JIMMY and PHOJET
predictions. The error bars show the statistical uncertainty while the shaded area shows the combined
statistical and systematic uncertainty. In the bottom plots the data in toward and away regions, defined
by the leading track is compared with PYTHIA ATLAS MC09 and DW tune predictions, where the error
bars represent the combined statistical and systematic uncertainty.
[GeV]
lead pT
1 2 3 4 5 6 7 8 9 10
MC/Data
0.6 0.8 1 1.2
1.41 2 3 4 5 6 7 8 9 10
φdη/dchN2Std.Deviation of d
0.1 0.2 0.3 0.4 0.5 0.6
Transverse Region
= 900 GeV s
| <2.5 η
> 0.5 GeV and | pT
Preliminary ATLAS
Data 2009
PYTHIA ATLAS MC09 Tune PYTHIA DW Tune
PYTHIA Perugia0 Tune PHOJET HERWIG+JIMMY
[GeV]
lead pT
2 4 6 8 10 12 14 16 18 20
MC/Data
0.6 0.8 1 1.2
1.4 2 4 6 8 10 12 14 16 18 20
φdη/dchN2Std.Deviation of d
0.2 0.4 0.6 0.8 1 1.2
Transverse Region
= 7 TeV s
| <2.5 η
> 0.5 GeV and | pT
Preliminary ATLAS
Data 2010
PYTHIA ATLAS MC09 Tune PYTHIA DW Tune
PYTHIA Perugia0 Tune PHOJET HERWIG+JIMMY
[GeV]
lead T p
1 2 3 4 5 6 7 8 9 10
MC/Data
0.6 0.8 1 1.2
1.41 2 3 4 5 6 7 8 9 10
[GeV]φdη/dTp∑2Std. Deviation of d
0.1 0.2 0.3 0.4 0.5 0.6 0.7
Transverse Region
= 900 GeV s
| <2.5 η
> 0.5 GeV and | pT
Preliminary ATLAS
Data 2009
PYTHIA ATLAS MC09 Tune PYTHIA DW Tune
PYTHIA Perugia0 Tune PHOJET HERWIG+JIMMY
[GeV]
lead T p
2 4 6 8 10 12 14 16 18 20
MC/Data
0.6 0.8 1 1.2
1.4 2 4 6 8 10 12 14 16 18 20
[GeV]φdη/dTp∑2Std. Deviation of d
0.2 0.4 0.6 0.8 1 1.2 1.4 1.6 1.8 2
Transverse Region
= 7 TeV s
| <2.5 η
> 0.5 GeV and | pT
Preliminary ATLAS
Data 2010
PYTHIA ATLAS MC09 Tune PYTHIA DW Tune
PYTHIA Perugia0 Tune PHOJET HERWIG+JIMMY