ATLAS-CONF-2010-065 28July2010
ATLAS NOTE
ATLAS-CONF-2010-065
20 July, 2010
Early supersymmetry searches in channels with jets and missing transverse momentum with the ATLAS detector
ATLAS collaboration
Abstract
This note describes a first set of measurements of supersymmetry-sensitive variables in the final states with jets, missing transverse momentum and no leptons from the√
s=7 TeV proton-proton collisions at the LHC. The data were collected during the period March 2010 to July 2010 and correspond to a total integrated luminosity of 70±8 nb−1. We find agree- ment between data and Monte Carlo simulations indicating that the Standard Model back- grounds to searches for new physics in these channels are under control.
1 Introduction
Supersymmetry (SUSY) [1] is a theoretically favoured candidate for physics beyond the Standard Model.
If strongly interacting supersymmetric particles are present at the TeV-scale, then such particles should be copiously produced in the 7 TeV collisions at the Large Hadron Collider [2]. The ATLAS [3] col- laboration has already reported the observation of the electroweak W± and Z0 bosons [4], and of high transverse-momentum jets [5]. With increasing integrated luminosities the LHC experiments will achieve sensitivity to the production of supersymmetric particles [6] exceeding that of the Tevatron experi- ments [7].
This note presents a first comparison of data to Monte Carlo simulations for some of the most impor- tant kinematical variables for supersymmetry searches involving jets and missing transverse momentum with no leptons. Selections based on these variables are expected to be sensitive not only to R-parity conserving SUSY particle production, but also to any model in which one or more strongly-interacting particles decay semi-invisibly.
The measurements in this note are based on the√
s=7 TeV proton-proton collisions from the LHC and were recorded between March and July 2010. They correspond to a total integrated luminosity of 70±8 nb−1.
2 The ATLAS detector
The ATLAS detector is described in detail elsewhere [3].
The analyses presented in this note make use of almost all detector components, but the most impor- tant systems are the calorimeters which cover the pseudorapidity1) range|η|<4.9, using a variety of detector technologies. The lead-liquid argon (LAr) electromagnetic calorimeter is divided into a barrel part (|η|<1.475) and the two endcap components(1.375<|η|<3.2). The hadronic tile calorime- ter is placed directly outside the barrel electromagnetic calorimeter envelope. This steel/scintillating- tile detector consists of a barrel covering the region |η|<1.0 and two extended barrels in the range 0.8<|η|<1.7. The copper-LAr hadronic endcap calorimeter consists of two independent wheels per endcap (1.5<|η|<3.2) located directly behind the endcap electromagnetic calorimeter. The largest values of |η|are covered by the forward calorimeters which consist of three modules in each endcap:
the first made of copper-LAr is optimized for electromagnetic measurements while the other two made of tungsten-LAr measure primarily the energy of hadronic interactions.
3 Monte Carlo simulation
The results presented are compared to expectations based on Monte Carlo simulations. The signal and background samples used were generated at √
s=7 TeV. Samples generated with PYTHIA [8] and HERWIG [9] (with JIMMY [10]) used a set of parameters tuned by ATLAS for its 2009 Monte Carlo generation [11]. All signals and backgrounds were passed through aGEANT4[12] based simulation and were reconstructed with the same algorithms used for the data. The samples used are summarized in Table 1.
1)The coordinate system used has its origin at the nominal interaction point. The beam direction defines the z-axis and the x−y plane is transverse to the beam direction. The positive x-axis is defined as pointing from the interaction point to the centre of the LHC ring and the positive y-axis is defined as pointing upwards. The azimuthal angleφis measured around the beam axis and the polar angleθis the angle from the beam axis. The pseudorapidity is defined asη=−ln tan(θ/2). The transverse momentum pT, the transverse energy ET, and the transverse missing momentum ETmiss are defined in the x−y plane. The distance∆R inη,φspace is defined as∆R=p
∆η2+∆φ2.
Physics process Cross section×BR / nb Luminosity / nb−1 Di-jets (QCD) 8≤pˆT<17 GeV 9.85×10⁶ 0.14 Di-jets (QCD) 17≤pˆT<35 GeV 6.78×10⁵ 2.06 Di-jets (QCD) 35≤pˆT<70 GeV 4.10×10⁴ 34.1 Di-jets (QCD) 70≤pˆT<140 GeV 2.20×10³ 636 Di-jets (QCD) 140≤pˆT<280 GeV 88 1.59×10⁴ Di-jets (QCD) 280≤pˆT<560 GeV 2.35 5.96×10⁵
Di-jets (QCD) 560 GeV≤pˆT 0.034 4.12×10⁷
W→eν 10.45 2.0×10⁵
W→µ ν 10.45 2.0×10⁵
W→τ ν 10.45 2.0×10⁵
Z→νν¯ 5.82 1.0×10⁵
Z→e+e− 0.79 5.0×10⁵
Z→µ+µ− 0.79 5.0×10⁵
Z→τ+τ− 0.79 5.0×10⁵
t ¯t 0.164 7.0×10⁶
SU4 SUSY point 0.060 11.9×10⁵
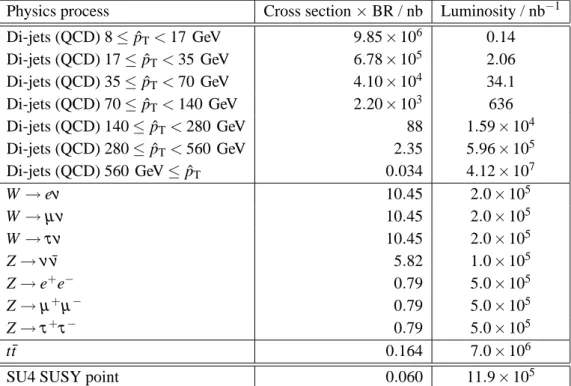
Table 1: Standard model and SUSY benchmark point Monte Carlo samples used in this analysis includ- ing cross section times branching ratio and the equivalent integrated luminosity of the sample. ˆpT is the transverse momentum of the two partons involved in the hard scattering process. The cross sections reported are given at NNLO for W →lνand Z→νν, at NLO with NLL for t ¯t and at leading order for¯ jet production via QCD processes (referred to as QCD in the following) and Z→l+l−.
W/Z + jets production The production of W±or Z0bosons in association with jets is expected to be one of the most important backgrounds for supersymmetry searches both with and without leptons. As the SUSY event selection often requires many jets in the final state, it is particularly important to model multiparton final states. For this reason, theALPGEN[13] Monte Carlo generator including electroweak and QCD effects for multiparton hard processes has been chosen. Jet production was generated for up to five-parton matrix elements, in different slices of momentum of the hard process ( ˆpT). The generator is interfaced to HERWIG[9] for showering and fragmentation processes andJIMMY[10] generating the underlying event. The parton density functions used for these samples were the CTEQ6L1 set [14].
The limited number of such events in the current data sample precludes a data-driven estimate of the normalization, so the samples were normalized to the integrated luminosity accumulated using the cross sections in Table 1. The overall normalizations of the W±→lν and Z0→ν ν processes are based on next-to-next-to-leading order (NNLO) QCD corrections estimated from FEWZ program [15]. The same normalization scaling factor has been applied for allALPGENparton multiplicities.
Top pair production The t ¯t process is an important background for most of the SUSY channels de- scribed in this note. TheMC@NLO[16, 17] generator, including full next-to-leading order QCD correc- tions has been used to simulate the hard process. Parton showering and fragmentation were simulated by theHERWIGevent generator withJIMMY[10] generating the underlying event. The t ¯t cross sections were normalized to the next-to-leading order and next-to-leading log result [18]. The CTEQ6.6 next-to- leading-order parton set is used for the matrix element, the parton shower and the underlying event.
QCD jet production A large sample of inclusive jet events has been generated withPYTHIA6.4.21.
The hard interaction of the event is modelled via 2→2 matrix elements at leading order in the strong coupling constant. The production of top quarks is not included in this sample and instead a dedi- cated sample has been produced (see above). Additional initial and final state radiation are generated by a parton shower algorithm in the leading logarithm approximation. The QCD process provides the largest contribution for relatively low pT jets, a region in which the leading logarithm approach pro- vides a good description of the data. Multiple parton–parton interactions are simulated by extra 2→2 processes. The parton density functions used for this sample were the modified leading order distribu- tions of MRST 2007 LO∗ [19]. This sample is normalized to the data in a control region as described in Section 6.1. The same overall normalization factor is used to rescale the QCD Monte Carlo sample throughout the analysis.
ThePYTHIAQCD prediction has been compared to a QCD prediction calculated with theALPGEN generator. TheALPGENcalculation used generates up to five-parton matrix elements for the light quarks and up to four-parton matrix elements for b-quark production. After scaling the overall normalization of the prediction to the data in the QCD control region the remaining differences betweenPYTHIAand ALPGENare smaller than the current total experimental uncertainties. The PYTHIAQCD prediction is used for the analysis presented below.
Supersymmetry model Kinematic distributions are compared for illustrative purposes to the predic- tion from a supersymmetric mSUGRA [20] benchmark point. The point chosen SU4 is a low mass point close to the Tevatron limits [7] with m0=200 GeV, m1/2=160 GeV, A0=−400 GeV, tanβ =10 and µ>0. The SU4 mass spectrum and branching ratios were calculated usingISAJET[21] version 7.75. A sample of 5×10⁴inclusive supersymmetry production events were generated with theHERWIG++gener- ator [22] version 2.4.2 using the MRST 2007 LO∗parton density distributions [19]. The inclusive SUSY production cross section is calculated at leading order byHERWIG++to be 42.3 pb and byProspino[23]
at next-to-leading order to be 59.9 pb. For this model point the typical masses of the strongly interacting
particles are in the range 410 to 420 GeV. In the figures presented the SU4 sample is normalized to ten times the next-to-leading-order (Prospino) cross section, for illustrative purposes.
4 Lepton, jet and missing transverse momentum reconstruction
A search strategy sensitive to a wide range of SUSY models is the selection of events with large missing transverse momentum and reconstructed jets with large transverse momentum. Jets are expected to dominate at the LHC since the coupling strength of the strong force would cause an abundance of squarks and gluinos if these particles are not prohibitively heavy. Squarks or gluinos will cascade decay to jets, leptons or photons, depending on the SUSY parameters, and missing transverse momentum caused by any undetectable particles (including any neutrinos as well as any dark matter candidates). The selection criteria applied in this paper are similar to those used in earlier Monte Carlo studies [24], but for the early analysis of the collision data presented here the selection thresholds have been reduced so that a comparison between data and Monte Carlo can be made at lower pT.
4.1 Object selection
The following object selection defines the particle candidates used in the event selection. The object selection criteria are based on those proposed before the LHC became operational [24] but have been further refined to improve rejection of non-collision backgrounds.
Jets are reconstructed using the anti-kt jet algorithm [25] with four-momentum recombination and dis- tance parameter R=0.4 (in η−φ space) to take into account the typical large multiplicity of supersymmetric events. Inputs to the jet algorithm are topological clusters [26] which attempt to reconstruct the three-dimensional shower topology of each particle entering the calorimeter.
The measured jet transverse momentum pEMScaleT , as determined at the electromagnetic scale2)is corrected for the non-compensating nature of the calorimeter (lower response to hadrons than elec- trons or photons) and the presence of dead material using a Monte-Carlo based calibration [27].
A small faction of fake jets result from calorimeter noise or cosmic ray energy deposits. Such fake jets display different properties with respect to real jets arising from parton fragmentation.
Jet identification criteria are described in Ref. [28]. The event is rejected if a jet has properties consistent with the following non-collision sources [28]:
• If the fraction of energy in the hadronic endcap calorimeter is larger than 0.8 and the number of cells containing 90% of the energy is fewer than six, the signal is consistent with sporadic noise in the hadronic endcap calorimeters, and the event is rejected.
• The previous cut is not effective if the noise coincides with a real energy deposit, so a further veto is applied based on the correlation between the fraction of the energy contained in the hadronic endcap calorimeter and the fraction of the jet energy from the LAr calorimeter cells flagged as problematic.
• Events are also removed if they contain jets with energy-squared-weighted time differing from the expected value by more than 50 ns.
• If the electromagnetic energy fraction is larger than 0.95 and the pulse shape is very different from that expected then the signal is consistent with noise in the electromagnetic calorimeters and again the event is rejected.
2)The electromagnetic scale is the appropriate scale for the reconstruction of the energy deposited by electrons or photons in the calorimeter.
• If a jet has 90% of their energy contained in fewer than six cells and less than 5% of their energy in the electromagnetic calorimeter it is consistent with the signal from cosmic ray or beam halo muons. Events containing such jets are vetoed in the monojet channel (defined later in Section 5) which would otherwise be sensitive to these effects.
The final cut is designed to remove cosmic ray events and is used only for the monojet channel which (as discussed in Section 6.2) is the most sensitive to non-collision backgrounds. The com- bined effect of these cleaning cuts is to remove a fraction approximately 1% of triggered events.
Two jet acceptance cuts are required in addition: pT >20 GeV and|η|<2.5. Any jets passing this loose selection are considered when applying the object identification described in Section 4.2.
Higher pTcuts are required for jets entering the final selections described in Section 5.
Electrons are reconstructed and identified with the medium-purity cuts defined in Ref. [29] and are required to be isolated in the calorimeter. The electron isolation criterion is that the calorimeter energy around the electron is required to be less than 10 GeV within a cone of radius∆R=0.2. In addition to those cuts, the pTof electrons should exceed 10 GeV and|η|should be less than 2.47.
Muons are reconstructed by an algorithm which performs a combination of a track reconstructed in the muon spectrometer with its corresponding track in the inner detector [24].
In order to select isolated muons, the total calorimeter energy within a cone of radius∆R=0.2 around the muon should be less than 10 GeV. Finally the acceptance cuts of pT>10 GeV and
|η|<2.5 are used.
Missing transverse momentum is computed from calorimeter cells belonging to topological clusters at the electromagnetic scale [30]. No corrections for the different calorimeter response of hadrons and electrons/photons or for dead material losses are applied. The transverse missing momentum components are defined by
Exmiss ≡ −
Ncell
∑i=1
Eisinθicosφi
Eymiss ≡ −
Ncell
∑i=1
Eisinθisinφi
ETmiss ≡ q
(Exmiss)2+ Eymiss2
, (1)
where the sum is over topological cluster cells within the pseudorapidity range|η|<4.5. In the following definitions the missing transverse momentum two-vector is defined by
~ETmiss≡(Exmiss,Eymiss). (2)
The performance of the missing transverse momentum reconstruction during the data-taking period is described in Ref. [30]. Events in which undetectable particles are produced can be expected to have large ETmiss.
4.2 Resolving overlapping objects
When candidates passing the object selection overlap with each other, a classification is required to remove all but one of the overlapping objects. All overlap criteria are based on the simple geometric
∆R=p
∆φ2+∆η2variable and based on previous studies [24] are applied in the following order:
Number of jets Monojets ≥2 jets ≥3 jets ≥4 jets
Leading jet pT(GeV) >70 >70 >70 >70
Subsequent jets pT(GeV) veto if>30 >30 >30 (Jets 2 and 3) >30 (Jets 2 to 4)
ETmiss >40 GeV >40 GeV >40 GeV >40 GeV
∆φ(jeti, ~ETmiss) no cut [>0.2,>0.2] [>0.2,>0.2,>0.2] [>0.2,>0.2,>0.2,>0]
ETmiss>f×Meff no cut f=0.3 f =0.25 f=0.2
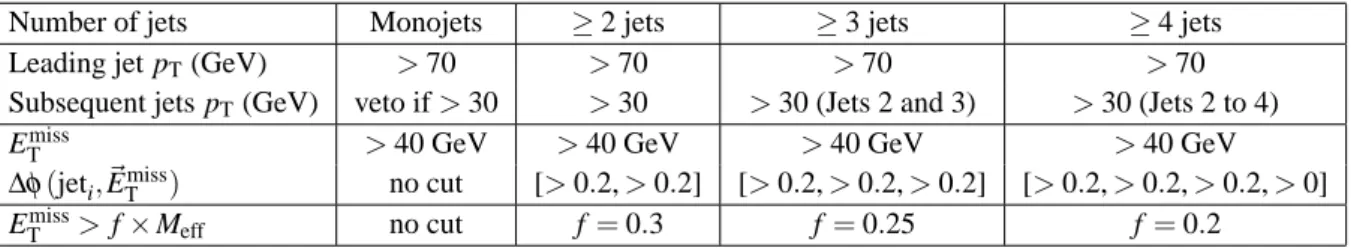
Table 2: Cuts on the pTof the leading jet, the pTof the other jets and the missing transverse momentum.
The cuts are shown for each of the studied jet multiplicities.
1. If an electron and a jet are found within∆R<0.2, the object is interpreted as an electron and the overlapping ‘jet’ is ignored.
2. If a muon and a jet are found within∆R<0.4, the object is treated as a jet and the muon is rejected.
3. If an electron and a jet are found within 0.2≤∆R<0.4, the object is interpreted as jet and the nearby ‘electron’ is ignored.
5 Event selection
The data presented were collected from March to July 2010. From all data taken at a centre-of-mass energy of 7 TeV during periods when the LHC declared stable beams, only those when the detector high voltage was in an optimal condition were selected. In addition both the solenoid and toroid magnets must be on at their nominal fields to allow good momentum measurements for the electrons and muons.
We also require that each of the sub-detectors’ responses and the main criteria for electron, muon, and jet identification as well as energy and momentum computations do not deviate from their expected behaviour. This includes the systems needed for missing momentum reconstruction, as well as the first level trigger systems required for jet selection. These basic data-quality requirements resulted in a total integrated luminosity of 70±8 nb−1.
The event selection proceeds as follows. Any event containing a bad jet (as defined in Section 4.1) is rejected. Events are also rejected if they contain no primary vertex with at least five associated tracks. The vertex requirement removes approximately 1.5×10⁻³of the triggered events. Events are also rejected if they contain any reconstructed leptons (e orµ) with pT>10 GeV.3) The final selection requirements on jet momenta, ETmiss, Meff(defined in equation 3 in Appendix A) and the angle between the jets and the
~ETmisstwo-vector are detailed in Table 2.
The choice of selection variables has been informed by previous Monte Carlo studies [6, 24]. For the early measurements presented in this note the selection thresholds (Table 2) have been reduced relative to the earlier Monte Carlo studies providing a larger sample of events to compare with the Standard Model expectations.
Trigger Efficiency The trigger efficiency has been studied for the initial LHC running scenario. The triggers used are the calorimeter jet triggers of the first trigger level (L1). The higher trigger levels were set in a state which permitted all events passing the L1 jet trigger to pass.
The efficiency has been measured with data relative to the minimum bias trigger and compared to the Monte Carlo trigger simulation. The trigger is fully efficient for jets with pTabove 50 GeV. The plateau
3)A separate note analysing events containing one or more leptons can be found elsewhere [31].
efficiency is greater than 99% for the events analysed in this note, all of which are required to have at least one jet with pT>70 GeV. The trigger efficiencies in data and simulation agree to better than 1%.
6 Results and distributions
6.1 Normalization of the QCD background
ThePYTHIAQCD calculation is accurate only to leading order in the strong coupling constant so it is not expected to correctly describe the absolute normalization of the QCD cross section. A control region is therefore used to set the absolute normalization of thePYTHIAsample. The control region is defined by the dijet cuts of Table 2 which select events with at least two jets with pT>30 GeV, at least one of which must have pT >70 GeV. This selection is known to be dominated by QCD production (contributions from other processes such as vector boson + jets are negligible in this region) and is sufficiently close to the interesting region at high transverse momentum and high missing transverse momentum.
The total number of events measured in the control region is 108 239. The expected number of events from thePYTHIAMonte Carlo is 176 000, therefore the overall normalization of that sample is multiplied by 0.61. This factor is applied for all jet multiplicities to obtain the QCD expectation.
6.2 Non-collision backgrounds
An estimate has been made of the remaining background in the signal selection from cosmic rays in coincidence with primary vertices from minimum-bias collisions by considering fake ‘jets’ in LHC bunches. After the full set of cleanup cuts described in Section 4.1 about 2.3 events are expected in the monojet channel for ETmiss>50 GeV decreasing to 1.3 for ETmiss>70 GeV and to less than one for ETmiss>100 GeV. By measuring the apparent jet multiplicity in empty and non-colliding bunches the ex- pected number of non-collision background events in the dijet channel is calculated to be approximately 0.1. The rate of fake jets from beam halo muons has been estimated from events recorded during the transit of unpaired LHC bunches. The estimated contribution to the monojet channel is approximately ten events with jet pTgreater than 70 GeV.
6.3 Systematic uncertainties
For the estimation of the Standard Model prediction some of the most important sources of experimental systematic errors were considered. No attempt was made to assign errors to the predictions of the Monte Carlo generators. A comparison of QCD Monte Carlo predictions has shown that the shape differences between PYTHIA and ALPGEN are small compared to the current total experimental uncertainties for distributions measured.
The uncertainty associated with the calorimeter energy scale was estimated using a parameterization of this scale as a function of jet pTandη[27]. This procedure was designed to produce a conservative estimate of the uncertainty which is typically 10% for jets in the range 20 GeV<pT<60 GeV and 7%
for jets at higher pT. The effects of energy scale changes were determined by rescaling all jet energies and momenta, including a recalculation of the missing transverse momentum using the rescaled energies of the clusters associated with those jets. The selected events all contain high pT jets so in this early analysis no additional uncertainty has been assigned to account for possible mismodelling of the trans- verse momentum component from calorimeter cells not contained within jets. The resulting systematic uncertainty on the number of events expected after the jet and ETmiss cuts are applied is approximately 25% for the monojet analysis and the ≥2-jet analysis, 40% for the≥3-jet analysis and 50% for the
≥4-jet analysis.
Monojet ≥2 jets ≥3 jets ≥4 jets Data Monte Carlo Data Monte Carlo Data Monte Carlo Data Monte Carlo After jet cuts 21 227 23 000+7000−6000 108 239 108 000+31 000−25 000 28 697 31 000+10 000−8000 5329 5600+2300−1600
∩ETmisscut 73 46+22−14 650 450+190−120 325 230+100−70 116 84+45−30
∩∆φand
ETmisscuts – – 280 200+110−65 136 100+55−30 54 43+26−16
∩ETmiss/Meff,
∆φ and ETmiss cuts
– – 4 6.6±3 0 1.9±0.9 1 1.0±0.6
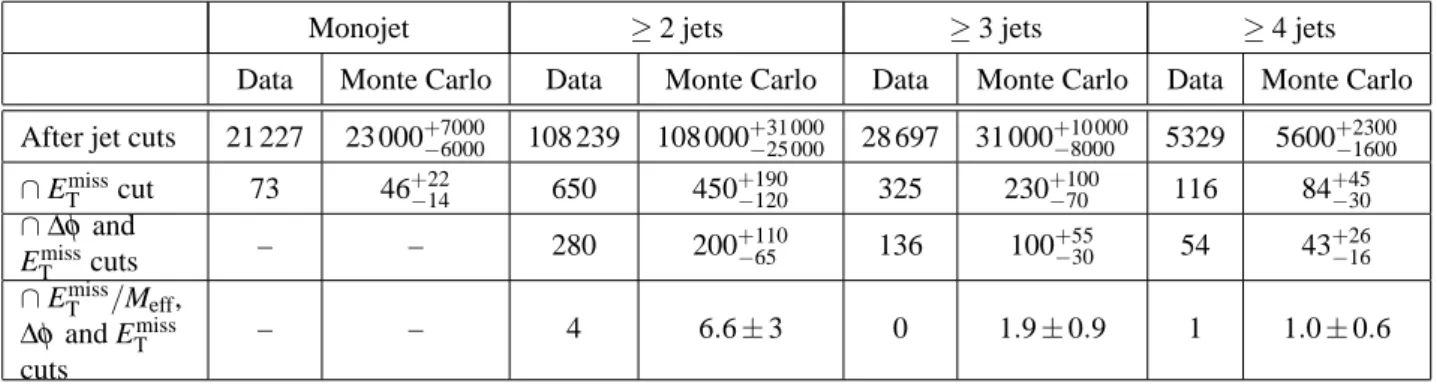
Table 3: The number of events passing the selection for each jet multiplicity, for data, and as predicted from the Monte Carlo simulation. The first row shows the numbers after the jet cuts described for each jet multiplicity in Table 2. The second row shows the numbers after a further selection requiring ETmiss>40 GeV. The numbers are shown after rescaling the QCD background Monte Carlo sample by the normalization factor as found in Section 6.1. The combined statistical and systematic uncertainty is included for each Monte Carlo prediction.
No attempt was made in this early analysis to subdivide the resulting systematic uncertainties in the part correlated between bins and channels and the part uncorrelated between bins and channels. Likewise were the QCD normalization factors not re-determined for each variation of the jet energy scale leading to a conservative uncertainty.
The uncertainty in the integrated luminosity is estimated to result in a normalization error of 11% for the W±+ jets, Z0+ jets and t ¯t production. No theoretical uncertainty was assigned to the Monte Carlo predictions; the uncertainty on the normalization of the W±+ jets and Z0+ jets is likely to be significant and will be determined from control regions in future studies.
Uncertainties associated with the trigger efficiency, and electron and muon identification efficiency are small by comparison.
The statistical uncertainty (assumed to be √
N) on the Monte Carlo prediction and all systematic uncertainties are added in quadrature. The resulting total uncertainty is dominated by the uncertainties in the calorimeter energy scale, normalization factors for the Monte Carlo cross sections and the luminosity.
The numbers of events passing different stages of the selection are shown in Table 3. It should be noted that the≥2,≥3 and≥4-jet analyses overlap, so there are correlations between the corresponding entries in the Table. The agreement between the numbers in the upper line (‘After jet cuts’) shows that the QCD normalization factor (which was calculated for the≥2-jet channel) is also providing a good description of the overall normalization in the monojet,≥3-jet and≥4-jet channels. The jet energy scale uncertainty is currently used to estimate the ETmiss uncertainty, so a change in that scale will produce a correlated change the number of events in the various selection after the ETmiss requirement. Since the numbers of observed events after the ETmiss cut are each within about 1σ of the expectation, the overall agreement can be considered good given the systematic uncertainty in the predictions.
6.4 Distributions
The data are shown for all distributions as points with error bars to allow the reader to estimate the statistical uncertainty. The error bars show the Poisson coverage interval corresponding to the number of data events in each bin. All results are compared to a normalized QCDPYTHIAprediction and to the Monte Carlo expectation for the W±+ jets, Z0+ jets and t ¯t production.
[GeV]
missT
E
0 50 100 150 200 250 300
Entries / 10 GeV
10-4
10-3
10-2
10-1
1 10 102
103
104
105
106
0 50 100 150 200 250 300
10-4
10-3
10-2
10-1
1 10 102
103
104
105
106 Data 2010 (s = 7 TeV)
Monte Carlo QCDW+jets Z+jets SU4 (x10)tt
L dt ~ 70 nb-1
∫
Monojet Channel ATLASPreliminary
(a)
Figure 1: Distribution of the missing transverse momentum for events in the monojet channel. Only the jet selection cuts have been applied.
The cuts are those of Table 2 but the cut on the missing transverse momentum, the ratio f of ETmiss and Meffand∆φ(jeti, ~ETmiss)are not applied in the Figures unless the captions indicate otherwise.
Monojet channel Figure 1 shows the missing transverse momentum distribution for events in the monojet channel before any ETmiss requirement is made. The distribution is reasonably well described by the dominating QCD Monte Carlo prediction. The background from W±and Z0production becomes important at missing transverse momentum>50 GeV. In the Z0sample, the background is from Z0de- cays to neutrinos. The W±contribution is due to lepton decays, where the lepton could not be identified.
The event displays for all monojet events with ETmiss>40 GeV have been scanned by eye. These scans indicate that eleven of the events with ETmiss>40 GeV are candidates for beam halo interactions in which an energetic photon has been radiated from a halo muon traversing the calorimeter, consistent with the expectation.
The distribution of the leading jet pT is well described both before and after a selection requiring missing transverse momentum ETmiss>40 GeV as can be seen from Figure 2.
Figure 3 shows the difference in azimuthal angle between the jet and the missing transverse momen- tum vector. QCD dijet events with jets approximately back-to-back in the transverse plane appear in this plot at ∆φ≈π if the lower energy jet is not reconstructed or out of acceptance, but they can also contribute at∆φ≈0 if the observed jet recoils against a higher-energy jet beyond the selected rapidity range. The contributions from Z0+ jet(s) and W±+ jet(s) events are dominated by the electroweak boson recoiling against a single jet leading to a peak at π only. To within the systematic uncertainties in the prediction, which are largely correlated between bins, there is agreement between the data and the Monte Carlo prediction.
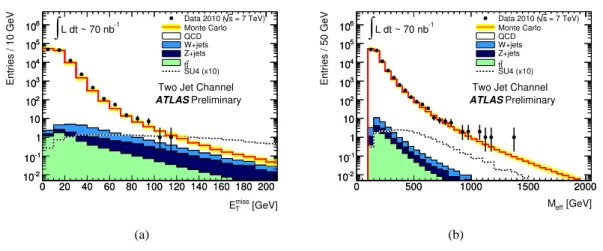
Two jet channel Our two-jet selection requires p(1)T >70 GeV and p(2)T >30 GeV. The distributions of the missing transverse momentum and the effective mass (defined in equation (3) in Appendix A) are shown without any other cuts in Figure 4. The expectation is here overwhelmingly dominated by QCD dijet events. This selection defines the control for the QCD Monte Carlo sample so the overall event numbers in data and Monte Carlo must agree by construction. The Monte Carlo provides a good description of the shape of the data within the systematic uncertainties up to large Meffand ETmiss.
jet1 [GeV]
pT
0 50 100 150 200 250 300 350 400
Entries / 10 GeV
10-3
10-2
10-1
1 10 102
103
104
105
0 50 100 150 200 250 300 350 400 10-3
10-2
10-1
1 10 102
103
104
105 Data 2010 (s = 7 TeV)
Monte Carlo QCDW+jets Z+jets SU4 (x10)tt
L dt ~ 70 nb-1
∫
Monojet Channel ATLASPreliminary
(a)
jet1 [GeV]
pT
0 50 100 150 200 250 300 350 400
Entries / 10 GeV
10-4
10-3
10-2
10-1
1 10 102
103
104
0 50 100 150 200 250 300 350 400 10-4
10-3
10-2
10-1
1 10 102
103
104 Data 2010 (s = 7 TeV)
Monte Carlo QCDW+jets Z+jets SU4 (x10)tt
L dt ~ 70 nb-1
∫Monojet Channel ATLASPreliminary
(b)
Figure 2: Distribution of the leading jet transverse momentum for events in the monojet channel before (a) and after (b) the cut requiring ETmiss>40 GeV is applied.
miss)|
-ET
(jet1
Φ
∆
|
0 0.5 1 1.5 2 2.5 3
/20 radπEntries /
10-3
10-2
10-1
1 10 102
103
104
105
106
107
108
0 0.5 1 1.5 2 2.5 3
10-3
10-2
10-1
1 10 102
103
104
105
106
107
108 Data 2010 (s = 7 TeV)
Monte Carlo QCDW+jets Z+jets SU4 (x10)tt
L dt ~ 70 nb-1
∫Monojet Channel ATLASPreliminary
(a)
miss) | -ET
(jet1
Φ
∆
|
0 0.5 1 1.5 2 2.5 3
/20 radπEntries /
10-3
10-2
10-1
1 10 102
103
104
0 0.5 1 1.5 2 2.5 3
10-3
10-2
10-1
1 10 102
103
104 Data 2010 (s = 7 TeV)
Monte Carlo QCDW+jets Z+jets SU4 (x10)tt
L dt ~ 70 nb-1
∫
Monojet Channel ATLASPreliminary
(b)
Figure 3: Distributions of the difference in azimuthal angle between the jet and the missing transverse momentum vector for events in the monojet channel without (a) and with (b) the cut requiring ETmiss>
40 GeV.
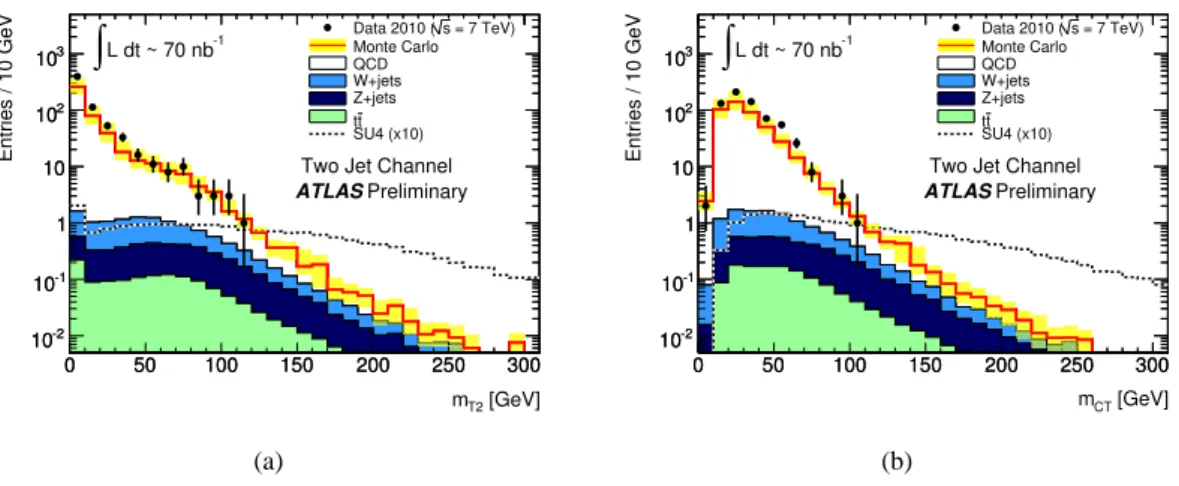
The mT2and mCTdistributions4)for this selection are shown in Figure 5 after requiring missing trans- verse momentum greater than 40 GeV. Again the data are in agreement with the Monte Carlo prediction given the current size of the systematic uncertainties. For both distributions a SUSY signal would be expected to be present at high values of these variables.
Figure 6 shows the difference in azimuthal angle between the jet and the missing transverse mo- mentum vector for the leading and second jet. The distributions are shown after the cut on the missing transverse momentum. If the missing transverse momentum is consistent with the mismeasurement of one jet, this value is close to zero. Both distributions are in agreement with the Monte Carlo prediction which is again dominated by the QCD processes.
The distributions of the quantities sensitive to the angular distributions of the produced jets in the transverse plane are shown in Figure 7. Both transverse sphericity and transverse thrust (defined in equations (7) and (8) respectively in Appendix A) are described by the Monte Carlo prediction. The distributions are shown after the cut on the missing transverse momentum. Due to the back-to-back configuration of QCD dijet events these values are peaked towards zero, consistent to what is seen in data. The more spherical SUSY signal or events from t ¯t production show higher values in these two quantities.
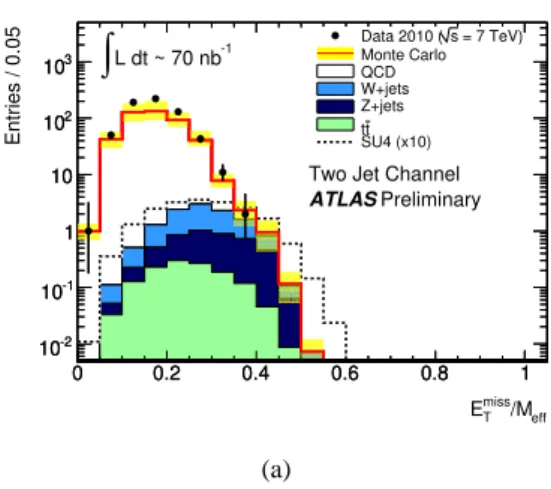
Another important quantity used in supersymmetry searches is the ratio f of the missing transverse momentum to the effective mass. The distribution of this quantity is shown in Figure 8. The QCD background is dominant at low values. Processes with real missing transverse momentum show higher values of this quantity. The data distribution is described by the Monte Carlo prediction.
Figure 9 shows the distribution of the effective mass after the cuts on the ratio f >0.3 and the cuts on the difference in azimuthal angle∆φ(jet, ~ETmiss) are applied. Four data events are found, consistent with the expectation of 6.6±3. Note that the Standard Model expectation at high Meffvalues are due to vector boson plus jets production.
[GeV]
missT
E 0 20 40 60 80 100 120 140 160 180 200
Entries / 10 GeV
10-2
10-1
1 10 102
103
104
105
106
0 20 40 60 80 100 120 140 160 180 200 10-2
10-1
1 10 102
103
104
105
106 Data 2010 (s = 7 TeV)
Monte Carlo QCDW+jets Z+jets SU4 (x10)tt
L dt ~ 70 nb-1
∫
Two Jet Channel ATLASPreliminary
(a)
[GeV]
Meff
0 500 1000 1500 2000
Entries / 50 GeV
10-2
10-1
1 10 102
103
104
105
106
0 500 1000 1500 2000
10-2
10-1
1 10 102
103
104
105
106 Data 2010 (s = 7 TeV)
Monte Carlo QCDW+jets Z+jets SU4 (x10)tt
L dt ~ 70 nb-1
∫
Two Jet Channel ATLASPreliminary
(b)
Figure 4: Distributions of the missing transverse momentum (a) and the effective mass (b) for events in the two-jet channel. Only the jet selection cuts have been applied.
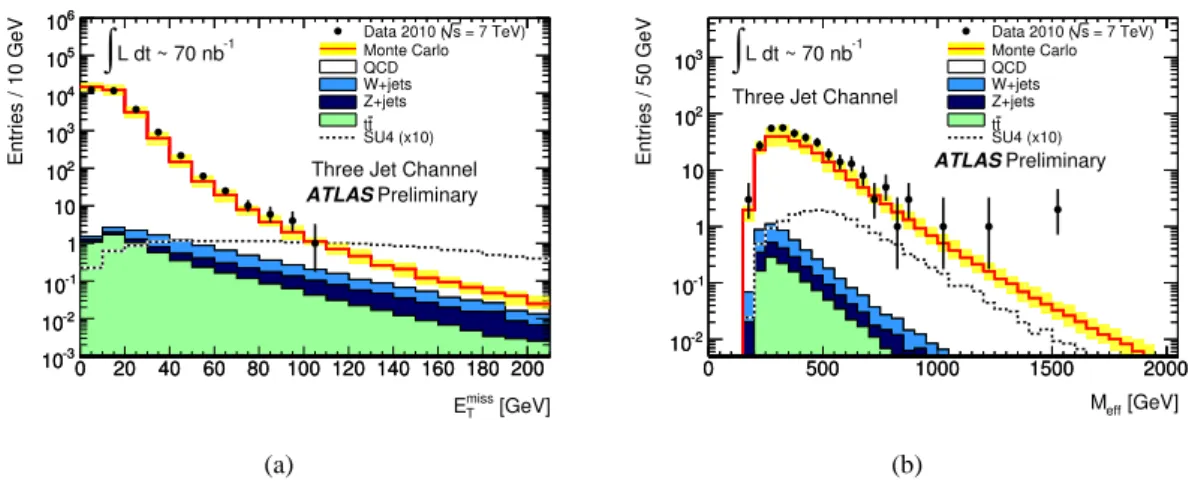
Three jet channel Distributions of the missing transverse momentum and the effective mass after the ETmiss cut are shown for three-jet events in Figure 10. Both distributions are reasonably well de- scribed by the Monte Carlo predictions, given the systematic uncertainties. Each of the two events with
4)Formulae for mT2and mCTcan be found in Appendix A, equations (4) and (6) respectively.
[GeV]
mT2
0 50 100 150 200 250 300
Entries / 10 GeV
10-2
10-1
1 10 102
103
0 50 100 150 200 250 300
10-2
10-1
1 10 102
103
= 7 TeV) s Data 2010 ( Monte Carlo QCDW+jets Z+jets SU4 (x10)tt
L dt ~ 70 nb-1
∫
Two Jet Channel ATLASPreliminary
(a)
[GeV]
mCT
0 50 100 150 200 250 300
Entries / 10 GeV
10-2
10-1
1 10 102
103
0 50 100 150 200 250 300
10-2
10-1
1 10 102
103
= 7 TeV) s Data 2010 ( Monte Carlo QCDW+jets Z+jets SU4 (x10)tt
L dt ~ 70 nb-1
∫
Two Jet Channel ATLASPreliminary
(b)
Figure 5: Distributions of the stransverse mass mT2 and the contransverse mass mCT for events in the dijet channel. The cut requiring ETmiss>40 GeV has been applied.
Meff>1500 GeV contains an additional jet and so both also appear in intermediate stages of the four-jet selection. An event display of one of these events can be found in Appendix B.
Figure 11 shows the distribution of the effective mass after the cuts on the ratio f >0.25 and the cuts on the difference in azimuthal angle∆φ(jet, ~ETmiss)are applied. No data events are found, which is consistent with the expectation of 1.9±0.9.
Four jet channel Distributions of the missing transverse momentum and the effective mass after the ETmisscut are shown for four-jet events in Figure 12. Both distributions are reasonably well described by the Monte Carlo prediction, given the experimental systematic uncertainties on the prediction. The same two events observed in the three jet channel at large Meffcan be seen in the upper tail of Figure 12(b).
Figure 13 shows the distribution of the effective mass after also applying the cut on the ratio f >
0.25 and the cut on the difference in azimuthal angle∆φ(jet, ~ETmiss). One data event is found, which is consistent with the expectation of 1.0±0.6.
7 Summary and conclusion
An analysis of the first 70±8 nb−1of integrated luminosity collected with the ATLAS detector is pre- sented. These data allow an early search for new physics with jets, and missing transverse momentum (in the absence of leptons).
Measured distributions of jet momenta, missing transverse momentum, effective mass, azimuthal an- gles, stransverse mass, contransverse mass and event shape variables show agreement with the Standard Model up to values of ETmiss≈100 GeV, Meff≈1500 GeV, mT2≈mCT≈100 GeV.
The agreement between the ATLAS measurements and the Standard Model predictions shows that the ATLAS detector is performing well and that the Monte Carlo simulations describe both the underlying physics, and the detector response to jets and ETmiss within the systematic uncertainties achievable thus far. Larger data sets will allow us to refine and reduce experimental uncertainties, further improving our understanding of the Standard Model predictions and providing increased sensitivity to new physics.