ATLAS-CONF-2010-064 28July2010
ATLAS NOTE
ATLAS-CONF-2010-064
July 23, 2010
Muon Reconstruction Performance
The ATLAS Collaboration
Abstract
The performance of the ATLAS muon reconstruction and identification is studied with 17 nb−1of LHC p-p collision data at√
s=7 TeV collected with muon triggers. The selected muons have on average a momentum of 11 GeV and a transverse momentum of 4.5 GeV and are predominantly produced in weak decays of light hadrons and of hadrons containing b and c quarks. With such single muon events, the redundancy in the ATLAS muon reconstruction allows performance measurements by comparing different identification and reconstruction algorithms. Relative muon efficiencies and the momentum scale and resolution are studied.
Also an estimate is given for the probability to reconstruct a (decayed) pion as muon, which is the most abundant muon background.
The results are compared to Monte Carlo simulation, and a good agreement is found within the available statistical precision.
1 Introduction
Many physics processes at the LHC are only accessible in final states with highly energetic charged leptons due to the overwhelming QCD background. The ATLAS detector is optimized for muon identifi- cation, with an efficiency greater than 95% and a fractional momentum resolution better than 3% over a wide transverse momentum ( pT) range and 10% at pT=1 TeV. Muon momenta are independently mea- sured in the inner detector and the muon spectrometer. The deflection of muons by the magnetic field generated by a system of air core toroid coils in the muon spectrometer is measured by three layers of precision drift tube (MDT) chambers in|η|<2 and by two layers of MDT chambers in combination with one layer of cathode strip chambers (CSC) at the entrance of the muon spectrometer for 2≤ |η|<2.7.
Three layers of resistive plate chambers (RPC) in the barrel region (|η|<1) and three layers of thin gap chambers (TGC) in the end caps (1<|η|<2.4) provide the muon trigger and also measure the muon trajectory in the non-bending plane of the spectrometer magnets. Up to|η|=2.5 muon momenta are also measured in the inner detector by three types of detectors operated in a solenoidal field of 2 T: a silicon pixel detector closest to the interaction point, a silicon strip detector (SCT) surrounding the pixel detector, and a transition radiation straw tube tracker (TRT) as outermost part of the inner detector [1].
This note presents an update of the muon performance studies in p-p collisions at √s=7 TeV illustrated in [2]. The already reported studies presented initial comparisons of basic muon reconstruction quantities with Monte Carlo full simulation, as obtained in the first 0.6 nb−1collected with a minimum bias trigger.
With the increasing LHC luminosity the minimum bias triggers have been gradually prescaled while the first level muon trigger commissioning proceeded successfully. This note will therefore focus on the performance studies accessible with the statistics collected using the first level muon trigger up to the beginning of June 2010, corresponding to approximately 17 nb−1.
This note presents a measurement of relative efficiencies, of the identification rate of secondary muons produced by pions, and of relative momentum resolution and scale between muon spectrometer (MS) and inner detector (ID) measurements of the same muon candidate. The study of relative quantities on data yields a first estimate of the level of uncertainty for performance results taken from the Monte- Carlo truth in the corresponding simulation. The method derives corrections and associated systematic uncertainties by comparing data to results obtained on the simulation using the same technique, as well as to the true quantity provided by the simulation. More p-p data will need to be analysed before an assessment of absolute efficiencies, momentum scale and resolution is possible by means of Z and J/ψ resonance decays to muons, using methods described in [3].
2 Muon identification strategies
In ATLAS four kinds of muon candidates are distinguished depending on the way they are reconstructed:
stand-alone muons, combined muons, segment tagged muons, and calorimeter tagged muons.
Stand-alone muon: The muon trajectory is only reconstructed in the muon spectrometer. The muon momentum measured in muon spectrometer is corrected for the parametrized energy loss of the muon in the calorimeter, to obtain the muon momentum at the interaction point. The direction of flight and the impact parameter of the muon at the interaction point are determined by extrapolating the spectrometer track back to the beam line.
Combined muon. The momentum of the stand-alone muon is combined with the momentum measured in the inner detector. The muon trajectory in the inner detector also provides information about the impact parameter of the muon trajectory with respect to the primary vertex.
Segment tagged muon: A trajectory in the inner detector is identified as a muon if the trajectory ex- trapolated to the muon spectrometer can be associated with straight track segments in the precision muon chambers.
Calorimeter tagged muon: A trajectory in the inner detector is identified as a muon if the associated energy depositions in the calorimeters is compatible with the hypothesis of a minimum ionizing particle.
In the early phase of the LHC operation, ATLAS uses more than one reconstruction algorithm for each muon category following different pattern recognition strategies. The complementarity of the different muon types and the corresponding alternative reconstruction algorithms makes it possible to evaluate the muon performance in detail. Two reconstructions chains, each implementing stand-alone, combined and segment tagged algorithms, are available in addition to calorimeter tagged muons, and are identified as chain 1 and chain 2 in the following.
3 Data sample and event selection
The studies presented in this note are based on an integrated luminosity of ≈17 nb−1, obtained with stable LHC beams in the period March to beginning of June 2010, and looking at events selected on- line by the ATLAS first level muon trigger. For an unbiased determination of the muon rate from pions (Sec. 5), however, a trigger needs to be used that does not enrich the muon rate. Therefore that particular measurement is based on events given by the first level calorimeter trigger. In ATLAS the first level muon and calorimeter triggers operate independently of each other.
Optimal data-taking conditions are required for the ID and MS detectors, including their magnet systems, for an event to be taken into account in any of the analyses. Collision events are selected by the following requirements: the event must be compatible with coming from a paired LHC proton bunch; at least 3 ID tracks must be associated with a reconstructed primary vertex and each of the 3 tracks must have 1 hit in the pixel detector and 6 hits in the SCT.
The analyses work with combined and segment tagged muons as described in [2], and in case of the relative efficiency measurement also with calorimeter tagged muons. Unless otherwise stated, a muon is required to have at least 1 hit associated in the pixel detector and at least 6 in the SCT.
Data have been compared to Monte Carlo simulations generated with PYTHIA [4], fully simulated through GEANT4 [5] and fully reconstructed. Three sets of data are simulated in this way: a sample of 20 million non-diffractive minimum-bias events produced with the MC09 tune [6]; a sample of 10 million QCD di-jet events, filtered requiring pcellT >17 GeV, where pcellT is the transverse momentum in a region of approximate size∆η×∆φ=0.2×0.2; and a million non-diffractive minimum-bias events filtered requiring pcellT >6 GeV. The MC09 tune uses a set of optimised parameters, which employ the MRST LO∗ [7] parton density functions and the pT-ordered parton shower, and were tuned to describe the charged particle multiplicity distribution in minimum bias events measured at 630 GeV and 1.8 TeV centre-of-mass energies [6].
The entire set of data and simulation have been processed offline with a single version of the recon- struction software, and in case of data with a coherent set of calibration and alignment constants.
4 Measurement of relative muon reconstruction and identification effi- ciencies
The combined muon efficiency is a product of three efficiencies, namely the efficiency of reconstructing a muon track in the inner detector, the efficiency of reconstructing a muon track in the muon spectrometer,
and the efficiency of matching the reconstructed inner detector and muon spectrometer tracks. These three efficiencies can be measured in experimental data by means of dimuon decays of Z bosons and, to some extent, of J/ψ mesons [3]. The statistics analysed and reported here of J/ψ mesons and Z bosons is low for a direct muon efficiency measurement.
Alternatively one can try to obtain efficiency estimates by exploiting the complementarity of the muon reconstruction algorithms. The efficiency of finding a calorimeter tagged muon is independent of the muon reconstruction efficiency in the muon spectrometer and the efficiency of matching the inner detector with the muon spectrometer track. Ideally one would therefore expect the efficiency of the combined muon reconstruction with respect to the calorimeter tagging to be a direct measure of the product of the muon spectrometer reconstruction efficiency and the matching efficiency. In practice this is not the case. The misidentification probability of the calorimeter taggers is significantly higher than the misidentification probability of the combined reconstruction. As a consequence the fraction of calorimeter tagged muons which are identified as muons by the combined reconstruction algorithms is significantly lower than the product of the muon spectrometer reconstruction efficiency and the matching efficiency. It is therefore necessary to complement the calorimeter tagged muons with requirements on the activity in the muon spectrometer in the region of the tagged muon.
Several different approaches have been followed, differing by the additional requirement. In the trigger-enhanced approach, a coincidence of trigger chamber hits in the region of the calorimeter tagged muon is required. In the segment-enhanced approach it is required that the calorimeter tagged muon is also segment tagged. A third approach, called muon chamber hit selection approach, requires a minimum number of precision chamber hits around an extrapolated ID track in the muon spectrometer, but does not use the calorimeter tagger. In none of the approaches a reconstructed track in the muon spectrometer is required so that the additional selection cuts should only lead to a small bias of the relative efficiency.
In all three approaches the muon track is required to have at least one hit in the pixel detector and more than 5 hits in the SCT. Within the known acceptance of the TRT,|η|<1.9, more than 9 hits in the TRT are required in addition.
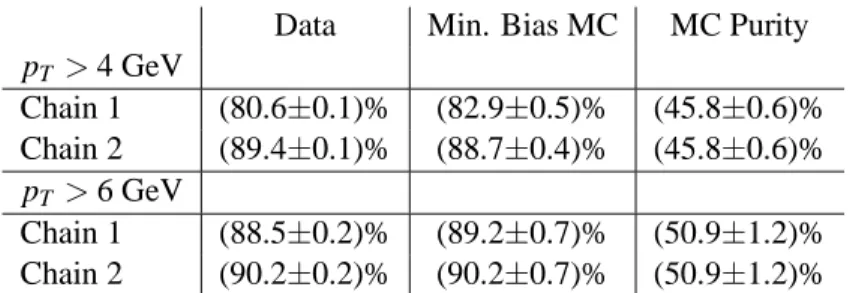
In the trigger-enhanced approach the relative efficiency of a combined reconstruction algorithm is defined as the fraction of calorimeter tagged muons in a region of a coincidence of trigger chamber hits which are found by the combined reconstruction algorithm. When the trigger-enhanced approach is applied to minimum bias Monte-Carlo data, about half of the selected muon candidates are from in-flight decays of pion and kaons, the other half is created in c and b decays. The combined reconstruction rejects muons which are created in pion and kaon decays far away from the pp interaction point because of the mismatch between the momentum of the pion track in the inner detector and the momentum of the track of the decay muon in the muon spectrometer. Therefore the relative efficiency of the combined reconstruction with respect to the selected muon candidates is lower than the efficiency of reconstructing muons created in the near vicinity of the pp interaction point. Table 1 shows a comparison of the measured relative efficiencies with the predicted relative efficiencies from minimum bias Monte-Carlo.
The combined reconstruction algorithm of chain 1 shows a lower efficiency than the algorithm of chain 2 for 4 GeV<pT<6 GeV because of a higher rejection of misidentified muons. Their efficiencies are the same for pT >6 GeV. The measured relative efficiency is in excellent agreement with the Monte-Carlo prediction for chain 2; chain 1 seems to have a 3% lower efficiency than predicted for pT >4 GeV.
In the segment-enhanced approach the relative efficiency of a combined reconstruction algorithm is defined as the fraction of calorimeter tagged and inner detector seeded segment tagged muons which are found by the combined reconstruction algorithm. The same set of reference muons is used in the evaluation of the performance of both reconstruction chains. The segment-enhanced approach has al- ready been applied to minimum bias data in [2], yielding similar results for chain 2 as the ones from the trigger-enhanced approach. In order to increase the purity of the segment-enhanced muon sample, two methods were followed.
Data Min. Bias MC MC Purity pT >4 GeV
Chain 1 (80.6±0.1)% (82.9±0.5)% (45.8±0.6)%
Chain 2 (89.4±0.1)% (88.7±0.4)% (45.8±0.6)%
pT >6 GeV
Chain 1 (88.5±0.2)% (89.2±0.7)% (50.9±1.2)%
Chain 2 (90.2±0.2)% (90.2±0.7)% (50.9±1.2)%
Table 1: Relative efficiencies of the combined reconstruction algorithms with respect to calorimeter tagged muons with trigger chamber hits in the region of the calorimeter tagged muons. The purity reported in the third column is defined as the fraction of se- lected muons in the (minimum bias) Monte-Carlo data which can be matched to muons generated close to the interaction point within a cone of∆R<0.1. The purity reported in the third column is defined as the fraction of the calorimeter-tagged muon sample in the minimum bias Monte-Carlo which can be matched to muons.
The first method exploits the expected momentum imbalance between the reconstructed inner detec- tor and muon spectrometer tracks for muons from πand K decays. This imbalance is discussed in detail in section 6 and implies that the momentum pMS of muons measured in the muon spectrometer and ex- trapolated to the interaction point, taking into account the mean energy loss in the calorimeters, tends to be significantly smaller than the momentum pIDof the corresponding inner detector track. It is therefore checked if a muon candidate which failed to be identified by the combined reconstruction algorithm can be associated with a stand-alone muon. Monte-Carlo studies show that almost all the muon candidates with pIDp−pMS
ID >0.3 are fromπ or K decays. Selected muons with pIDp−pMS
ID >0.3 are disregarded in the efficiency calculation. The relative efficiencies obtained in this way are listed in Table 2. Due to the increased purity of the reference muon sample relative efficiencies >95% are measured. The measured efficiencies are compared to all three Monte-Carlo simulation sets described in Section 3. The three different Monte-Carlo data sets predict that the muon efficiency should not change with the pT cut which is in agreement with the experimental measurements. The differences of the relative efficiencies seen in the different Monte-Carlo samples amounts to about 2% and agree with the measured efficiencies within 3%.
Chain pminT Data MC MC Purity
[GeV] min. bias m.b. (pTj >6 GeV) dijets pTj >17GeV
1 6 (95.8±0.1)% (97.9±0.5)% (97.2±0.3)% (96.5±0.1)% (69±1)%
10 (95.1±0.4)% (98.4±1.0)% (96.8±0.8)% (95.8±0.2)% (70±1)%
15 (95.0±0.9)% – – (95.3±0.4)% (70±1)%
2 6 (97.4±0.1)% (99.1±0.4)% (97.7±0.3)% (96.3±0.1)% (69±1)%
10 (97.6±0.3)% (99.5±0.5)% (96.7±0.8)% (94.5±0.2)% (70±1)%
15 (96.7±0.7)% – – (95.5±0.4)% (70±1)%
Table 2: Comparison of the measured relative efficiencies in the improved segment- enhanced approach with the Monte-Carlo prediction for different Monte-Carlo samples.
The statistics in the minimum bias Monte-Carlo sample was too small to predict an effi- ciency for pT >15 GeV.
In the segment-enhanced approach the purity can be increased to 98% by selecting muons from
[GeV]
µ
mµ
2 2.2 2.4 2.6 2.8 3 3.2 3.4 3.6 3.8 4
Number of found combined muons 1
10
102 Data 2010, s = 7 TeV chain 2
> 6 GeV pT
ATLAS Preliminary
signal window sidebands
[GeV]
µ
mµ
2 2.2 2.4 2.6 2.8 3 3.2 3.4 3.6 3.8 4
Number of missed combined muons
1 10
102 Data 2010, s = 7 TeV chain 2
> 6 GeV pT
ATLAS Preliminary
signal window sidebands
Figure 1: Invariant mass distribution of pairs of combined and segment-enhanced muons with pT >
6 GeV, left for segment-enhanced muons which can be matched with a combined muon from chain 2, right for segment-enhanced muons which cannot be matched with a combined muon from chain 2. The shaded areas indicate dimuon masses outside the J/ψmass window.
J/ψdecays. Events with two muons, one combined muon of chain 2 and one segment-enhanced muon, are selected. If the invariant mass of the muon candidate pair agrees with the J/ψmass within±0.2 GeV (compare Figure 1), the segment-enhanced muon is used for the relative efficiency calculation. Even higher combined reconstruction efficiencies than reported in Table 2 are achieved as a consequence of the increased purity (see Table 3). In the Monte-Carlo simulation both reconstruction chains show the same relative efficiencies. The measured relative efficiencies agree with the predicted relative efficiencies within statistical errors for chain 2. As before chain 1 seems to show a lower measured relative efficiency than predicted, however prediction and measurement agree within errors. Table 2 also presents the comparison to the true efficiency as measured in the Monte-Carlo. A clearer picture will be obtained with higher stastistics of measured data.
Data Min. Bias MC MC true efficiency pT >4 GeV
Chain 1 (91.1±1.6)% (94.1±0.2)% (91.8±0.1)%
Chain 2 (95.7±1.1)% (93.8±0.2)% (91.3±0.1)%
pT >6 GeV
Chain 1 (94.0±2.0)% (96.8±0.3)% (94.2±0.1)%
Chain 2 (98.7±0.9)% (97.4±0.2)% (94.9±0.1)%
Table 3: Relative efficiencies of the combined reconstruction algorithms with respect to calorimeter and segment tagged muons for muons from J/ψdecays.
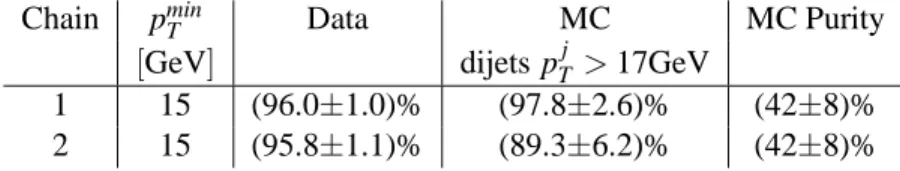
The muon chamber hit selection approach has been developed for the measurement of combined reconstruction efficiencies for isolated muons with pT >15 GeV. The isolation of the tracks is achieved by requiring the sum of the transverse momenta of inner detector tracks within a cone of∆R=0.2 around the selected track to be less than 20% of the transverse momentum of the selected track. The selected
inner detector track is extrapolated to the muon spectrometer and the number of precision chamber hits around the extrapolated track is counted. The association is done for hit drift tubes found within 3σ, whereσ is the sum in quadrature of the extrapolation error and of the tube diameter divided by√
12. It is required that two precision chambers have enough hits for a reliable reconstruction of track segments, namely more than 4 hits in the inner chambers and more than 3 hits in the middle and outer chambers of the spectrometer. An inner detector track fulfilling this requirement is considered a muon. As this selec- tion is very tightly related to the stand-alone muon reconstruction, stand-alone reconstruction efficiencies close to 1 are observed. On the other hand the measurement of the combined reconstruction efficiency with respect to this selection is mainly sensitive to the efficiency of matching an inner detector track with a muon spectrometer track because the stand-alone reconstruction efficiency for the selected muon is close to 1 by construction. The measured relative efficiencies presented in Table 4 are in agreement with the relative efficiencies obtained with the segment-enhanced approach and with the Monte-Carlo prediction.
Chain pminT Data MC MC Purity
[GeV] dijets pTj >17GeV
1 15 (96.0±1.0)% (97.8±2.6)% (42±8)%
2 15 (95.8±1.1)% (89.3±6.2)% (42±8)%
Table 4: Relative efficiencies of the combined reconstruction algorithms in the muon chamber hit selection approach.
5 Rate of secondary muons produced by pions
The most important source of background muons are pion and kaon decays toµX (“decays-in-flight”) and showers that are not fully contained in the calorimeters (“punch-through”). The decay-in-flight process results in genuine muons that produce high quality tracks in the muon spectrometer, while the punch-through process typically leads to poorly reconstructed muon spectrometer tracks not correlated with the actual presence of a muon. A detailed study of background muon sources in simulation has been reported in [8].
We present a measurement of the fraction of pions that produce a reconstructed muon through any of the above effects with a technique using a large set of exclusively identified KS0→π+π− decays in the inner detector [3]. Selection criteria are employed to obtain a sample of high purity initial pions. The measured fraction of pions reconstructed as muons is then defined as the fraction of inner detector tracks from selected pions that form part of a reconstructed combined or segment tagged muon. For an unbiased measurement of the fraction of pions reconstructed as muons, the initial sample of KS0→π+π− decays is selected from events satisfying the first level calorimeter trigger.
5.1 Identification of KS0decays
[Identification of KS0decays] For the reconstruction of the KS0candidates only ID tracks with at least one pixel hit, at least six SCT hits and pT >500 MeV are used. All possible opposite charge pairs of such ID tracks are formed and fitted to a common vertex. The purity of the sample of KS0candidates is enhanced by requiring the following criteria:
• theχ2of the common vertex fit less than 15 for one degree of freedom;
• transverse decay length, measured with respect to the primary vertex, between 5 and 120 mm;
4000 450 500 550 600 650 10
20 30 40 50 60
103
×
(MeV)
π
mπ
400 450 500 550 600 650
Events / ( 2 MeV )
0 10 20 30 40 50 60
103
×
Data 2010 Pythia MC09 ATLAS Preliminary
= 7 TeV s
L=17nb-1
∫
Data 2010 Pythia MC09
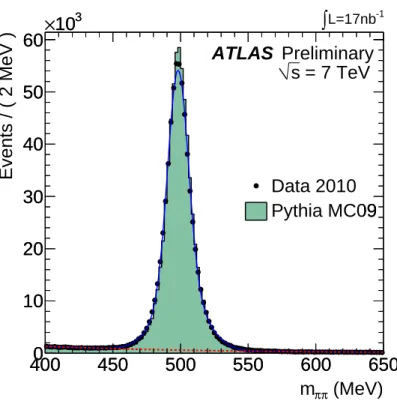
Figure 2: The π+π− invariant mass, mππ, distribution for KS0 candidates with a probe track. The data is represented by points with error bars while the Monte-Carlo simulation is represented by the solid, filled histogram. The Monte-Carlo distribution is normalised to have the same number of entries as the experimental data. The solid curve represents a fit to the distribution assuming the sum of two Gaussians for the signal shape and an exponential function for the background shape (dashed curve).
• cosine of angle between the KS0 candidate flight direction and its momentum vector greater than 0.9999;
• cosine of angle, cosΘ∗, between the KS0 candidate momentum and the momentum of its lowest momentum track, expressed at the KS0 rest frame, greater than -0.75. This requirement effectively rejectsΛ→pπ−, and ¯Λ, decays reconstructed using the pion hypothesis for both tracks.
It is noted that the analysis was performed also with the selection criteria described in [9] yielding essentially the same results.
5.2 Probe track selection
The ID track with the highest transverse momentum for each KS0candidate is considered to be a “probe”
track if it has momentum larger than 3 GeV, which is the minimum momentum necessary for a muon to reach the muon spectrometer. Additionally, it should have pT >1 GeV to account for internal kine- matic requirements of the reconstruction algorithms. If this selection is not satisfied, the KS0candidate is rejected.
In Fig. 2 the mππ distribution is presented for track pairs satisfying both the KS0 and probe track selection criteria. In total, there are 636940 KS0 candidates. The purity of the KS0 selection in the mass range between 450 and 550 MeV is approximately 95%. The p, pT,ηandφdistributions of probe tracks are displayed in Fig. 3
P [GeV]
0 10 20 30 40 50 60 70 80 90 100
dN/dP [Tracks/GeV]
1 10 102
103
104
105
Data 2010 ATLAS Preliminary
= 7 TeV s
L=17nb-1
∫
(a)
[GeV]
PT
0 5 10 15 20 25 30 35 40 [Tracks/GeV]T dN/dP
1 10 102
103
104
105
106
Data 2010 ATLAS Preliminary
= 7 TeV s
L=17nb-1
∫
(b)
-3 -2 -1 0 1 2 η3
dN/0.2
0 5 10 15 20 25 30
103
×
Data 2010
ATLAS Preliminary = 7 TeV
s
L=17nb-1
∫
(c)
φ
-3 -2 -1 0 1 2 3
/20)π dN/(
0 5 10 15 20 25 30 35 40 45
103
×
Data 2010 ATLAS Preliminary
= 7 TeV s
L=17nb-1
∫
(d)
Figure 3: The p, pT,ηandφdistributions of probe tracks in KS0candidates.
4000 450 500 550 600 650 20
40 60 80 100 120 140 160 180 200 220 240
(MeV)
π
mπ
400 450 500 550 600 650
Events / ( 10 MeV )
0 20 40 60 80 100 120 140 160 180 200 220 240
Chain 1 Data 2010 Pythia MC09 ATLAS Preliminary
= 7 TeV s
L=17nb-1
∫
Chain 1 Data 2010 Pythia MC09
(a) Chain 1
4000 450 500 550 600 650 100
200 300 400 500 600 700
(MeV)
π
mπ
400 450 500 550 600 650
Events / ( 10 MeV )
0 100 200 300 400 500 600 700
Chain 2 Data 2010 Pythia MC09 ATLAS Preliminary
= 7 TeV s
L=17nb-1
∫
Chain 2 Data 2010 Pythia MC09
(b) Chain 2
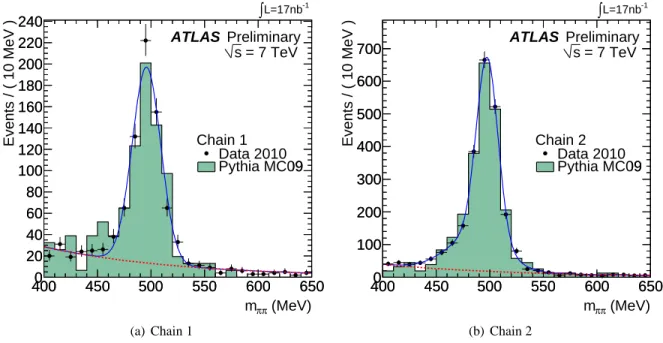
Figure 4: mππ distribution for KS0 candidates for which the probe track is identified as a combined or segment-tagged muon by chain 1 (a), and chain 2 (b). The data is represented by points with error bars while the Monte-Carlo simulation is represented by solid, filled histogram. The Monte-Carlo distribution is normalised to have the same number of entries. The solid curve represented a fit to the distribution assuming the sum of two Gaussians for the signal shape and an exponential for the background shape (dashed curve).
5.3 Fraction of pions reconstructed as muons
Muon candidates are those reconstructed muons passing nominal selection criteria as outlined in [2], from either muon reconstruction chain, chain 1 or chain 2, for which the best-matched ID track is a probe track from the KS0 sample. The mππ distributions for KS0candidates for which the probe track is identified as a muon are shown in Fig. 4 for both muon reconstruction chains. There are 644(2115)iden- tified muons from chain 1 (chain 2) in the probe track sample. If only combined muons are considered the corresponding numbers are 461 and 545 for chain 1 and 2, respectively. The fraction of pions re- constructed as muons is given as the ratio of the number of KS0candidates with a reconstructed muon (in Fig. 4) to the total number of candidates (in Fig. 2). The number of candidates in each case is extracted using a binned maximum likelihood fit to the KS0candidates mass spectrum. The signal is modeled by the sum of two independent Gaussians, while the background is modeled by an exponential. The uncertainty on the number of candidates is the one provided by the likelihood fit, taking into account the statistical fluctuations of the signal as well as the precision of the background estimation. Systematic effects of the extraction procedure are readily covered even by the statistical uncertainty.
The results for the fractions of pions reconstructed as muons are tabulated in Table 5 and compared with results obtained by identified pion decays-in-flight on the Monte-Carlo sample of 20 million non- diffractive minimum bias events. The corresponding results for combined muons are shown in Table 6.
The difference between combined and all reconstructed muons is a purely experimental effect. It originates from the fact that the two independent track measurements in the combined muons supply the reconstruction with more information to reject muon candidates with large decay angles or large mo- mentum difference, which would otherwise compromise the accuracy of the combination. The segment tagging algorithms are by construction less accurate in their matching criteria. In the case of chain 2 the segment tagging deliberately waives a p>3 GeV cut and uses loose matching requirements to increase
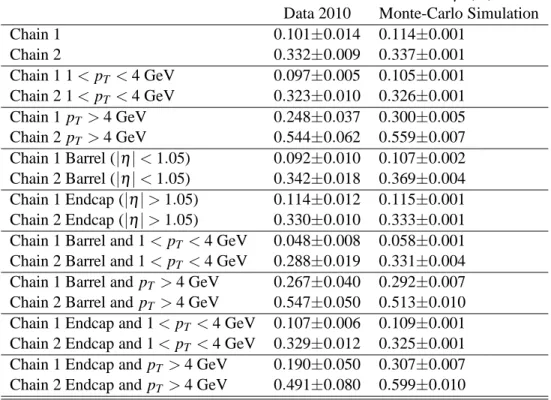
Selection fraction ofπ rec. asµ (%) Data 2010 Monte-Carlo Simulation
Chain 1 0.101±0.014 0.114±0.001
Chain 2 0.332±0.009 0.337±0.001
Chain 1 1<pT<4 GeV 0.097±0.005 0.105±0.001 Chain 2 1<pT<4 GeV 0.323±0.010 0.326±0.001 Chain 1 pT >4 GeV 0.248±0.037 0.300±0.005 Chain 2 pT >4 GeV 0.544±0.062 0.559±0.007 Chain 1 Barrel (|η|<1.05) 0.092±0.010 0.107±0.002 Chain 2 Barrel (|η|<1.05) 0.342±0.018 0.369±0.004 Chain 1 Endcap (|η|>1.05) 0.114±0.012 0.115±0.001 Chain 2 Endcap (|η|>1.05) 0.330±0.010 0.333±0.001 Chain 1 Barrel and 1<pT <4 GeV 0.048±0.008 0.058±0.001 Chain 2 Barrel and 1<pT <4 GeV 0.288±0.019 0.331±0.004 Chain 1 Barrel and pT >4 GeV 0.267±0.040 0.292±0.007 Chain 2 Barrel and pT >4 GeV 0.547±0.050 0.513±0.010 Chain 1 Endcap and 1<pT <4 GeV 0.107±0.006 0.109±0.001 Chain 2 Endcap and 1<pT<4 GeV 0.329±0.012 0.325±0.001 Chain 1 Endcap and pT >4 GeV 0.190±0.050 0.307±0.007 Chain 2 Endcap and pT >4 GeV 0.491±0.080 0.599±0.010
Table 5: Measured fractions of pions reconstructed as muons for combined and segment- tagged muons. The quoted uncertainties are statistical only and are given by the maxi- mum likelihood fit to the signal and background components.
the muon reconstruction efficiency for low-pt muons during the first phase of data-taking.
Note that these fractions are the values obtained when integrating over the p andη spectra of probe tracks selected by this technique.
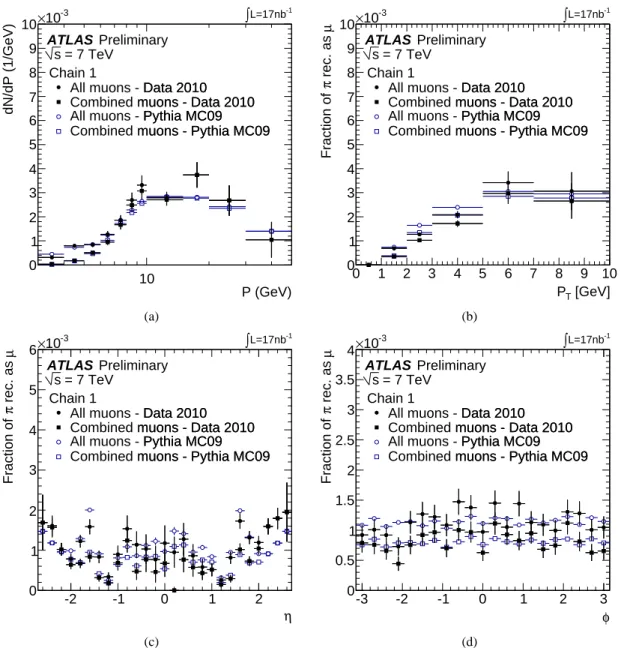
The measured fractions of pions reconstructed as muons as functions of p, pT,η andφ, using the parameters of the corresponding ID track, are shown in Figs. 5 and 6, both for combined muons only and for combined and segment-tagged muons, while the corresponding simulation results are overlaid.
In most cases a good agreement between data and MC is observed.
5.4 Summary
The measured fraction of pions reconstructed as muons have been determined from a large set of iden- tified KS0→ππ decays. The results are summarized in Table 6 for combined muons and in Table 5 for combined and segment-tagged muons, for data and MC and for both muon reconstruction chains. A good agreement between data and MC is observed. The pion decay-in-flight probabilities obtained by integrating over the pTandηspectra of all tracks used in this analysis (see Fig. 3) are(0.101±0.014)%
for muon reconstruction chain 1 and (0.332±0.009)% for chain 2, where the uncertainties are sta- tistical only. The corresponding fractions for combined muons, which by construction have a higher chance of rejecting decays with large momentum imbalance and deflection angle, are lower and amount to(0.070±0.012)% and(0.082±0.032)% for the two chains. The difference between the two chains when both combined muons and segment-tagged muons muons are used, is attributed to chain 2 using loose matching requirements to ensure high muon reconstruction efficiency of low-pT muons during the experiment’s commissioning with first collisions.
P (GeV) 10
dN/dP (1/GeV)
0 1 2 3 4 5 6 7 8 9 10
10-3
×
Chain 1
All muons - Data 2010 Combined muons - Data 2010 All muons - Pythia MC09 Combined muons - Pythia MC09 ATLAS Preliminary
= 7 TeV s
L=17nb-1
∫
Chain 1
All muons - Data 2010 Combined muons - Data 2010 All muons - Pythia MC09 Combined muons - Pythia MC09
(a)
[GeV]
PT
0 1 2 3 4 5 6 7 8 9 10
µ rec. as πFraction of
0 1 2 3 4 5 6 7 8 9 10
10-3
×
Chain 1
All muons - Data 2010 Combined muons - Data 2010 All muons - Pythia MC09 Combined muons - Pythia MC09 ATLAS Preliminary
= 7 TeV s
L=17nb-1
∫
Chain 1
All muons - Data 2010 Combined muons - Data 2010 All muons - Pythia MC09 Combined muons - Pythia MC09
(b)
η
-2 -1 0 1 2
µ rec. as πFraction of
0 1 2 3 4 5 6
10-3
×
Chain 1
All muons - Data 2010 Combined muons - Data 2010 All muons - Pythia MC09 Combined muons - Pythia MC09 ATLAS Preliminary
= 7 TeV s
L=17nb-1
∫
Chain 1
All muons - Data 2010 Combined muons - Data 2010 All muons - Pythia MC09 Combined muons - Pythia MC09
(c)
φ
-3 -2 -1 0 1 2 3
µ rec. as πFraction of
0 0.5 1 1.5
2 2.5 3 3.5 4
10-3
×
Chain 1
All muons - Data 2010 Combined muons - Data 2010 All muons - Pythia MC09 Combined muons - Pythia MC09 ATLAS Preliminary
= 7 TeV s
L=17nb-1
∫
Chain 1
All muons - Data 2010 Combined muons - Data 2010 All muons - Pythia MC09 Combined muons - Pythia MC09
(d)
Figure 5: The measured fraction of pions reconstructed as muons in chain 1 as a function of p, pT,η andφ. Results are shown for combined muons only and for combined and segment-tagged muons. The data are represented by filled markers, while Monte-Carlo simulation by open markers.
P (GeV) 10
dN/dP (1/GeV)
0 2 4 6 8 10 12 14
10-3
×
Chain 2
All muons - Data 2010 Combined muons - Data 2010 All muons - Pythia MC09 Combined muons - Pythia MC09 ATLAS Preliminary
= 7 TeV s
L=17nb-1
∫
Chain 2
All muons - Data 2010 Combined muons - Data 2010 All muons - Pythia MC09 Combined muons - Pythia MC09
(a)
[GeV]
PT
0 1 2 3 4 5 6 7 8 9 10
µ rec. as πFraction of
0 2 4 6 8 10 12 14
10-3
×
Chain 2
All muons - Data 2010 Combined muons - Data 2010 All muons - Pythia MC09 Combined muons - Pythia MC09 ATLAS Preliminary
= 7 TeV s
L=17nb-1
∫
Chain 2
All muons - Data 2010 Combined muons - Data 2010 All muons - Pythia MC09 Combined muons - Pythia MC09
(b)
η
-2 -1 0 1 2
µ rec. as πFraction of
0 2 4 6 8 10 12 14
10-3
×
Chain 2
All muons - Data 2010 Combined muons - Data 2010 All muons - Pythia MC09 Combined muons - Pythia MC09 ATLAS Preliminary
= 7 TeV s
L=17nb-1
∫
Chain 2
All muons - Data 2010 Combined muons - Data 2010 All muons - Pythia MC09 Combined muons - Pythia MC09
(c)
φ
-3 -2 -1 0 1 2 3
µ rec. as πFraction of
0 2 4 6 8 10 12 14
10-3
×
Chain 2
All muons - Data 2010 Combined muons - Data 2010 All muons - Pythia MC09 Combined muons - Pythia MC09 ATLAS Preliminary
= 7 TeV s
L=17nb-1
∫
Chain 2
All muons - Data 2010 Combined muons - Data 2010 All muons - Pythia MC09 Combined muons - Pythia MC09
(d)
Figure 6: The measured fraction of pions reconstructed as muons in chain 2 as a function of p, pT,η andφ. Results are shown for combined muons only and for combined and segment-tagged muons. The data are represented by filled markers, while Monte-Carlo simulation by open markers.
Selection fraction ofπ rec. asµ (%) Data 2010 Monte-Carlo Simulation
Chain 1 0.070±0.012 0.080±0.001
Chain 2 0.089±0.032 0.084±0.001
Chain 1 1<pT<4 GeV 0.066±0.005 0.071±0.001 Chain 2 1<pT<4 GeV 0.078±0.005 0.074±0.001 Chain 1 pT >4 GeV 0.200±0.035 0.273±0.005 Chain 2 pT >4 GeV 0.260±0.040 0.311±0.005 Chain 1 Barrel (|η|<1.05) 0.071±0.014 0.079±0.002 Chain 2 Barrel (|η|<1.05) 0.129±0.015 0.145±0.002 Chain 1 Endcap (|η|>1.05) 0.072±0.010 0.080±0.001 Chain 2 Endcap (|η|>1.05) 0.078±0.030 0.078±0.001 Chain 1 Barrel and 1<pT <4 GeV 0.028±0.006 0.034±0.001 Chain 2 Barrel and 1<pT <4 GeV 0.072±0.009 0.097±0.002 Chain 1 Barrel and pT >4 GeV 0.187±0.035 0.251±0.007 Chain 2 Barrel and pT >4 GeV 0.268±0.038 0.328±0.008 Chain 1 Endcap and 1<pT <4 GeV 0.079±0.007 0.074±0.001 Chain 2 Endcap and 1<pT<4 GeV 0.078±0.005 0.071±0.001 Chain 1 Endcap and pT >4 GeV 0.174±0.051 0.292±0.007 Chain 2 Endcap and pT >4 GeV 0.193±0.052 0.295±0.007
Table 6: Measured fractions of pions reconstructed as muons for combined muons only.
The quoted uncertainties are statistical only and are given by the maximum likelihood fit to the signal and background components.
6 Measurement of relative momentum resolution and scale
In this section we present the results on the current estimate of the scale and resolution of the muon momentum measured in the muon spectrometer relative to the inner detector momentum measurement.
The results are obtained using muons from a fully refitted combination of an ID track and a MS track (combined muons). They are provided as a function of the muon pT andη. We show that it is possible to estimate the instrumental resolution and offset between the muon spectrometer and the inner detector measurements on muons from Heavy Flavour (HF) decays in an inclusive muon sample and to disentan- gle the impact to the overall MS-ID momentum imbalance introduced by decays-in-flight of light mesons such asπand K to muons.
6.1 Analysis method We define the variable
∆p
p = pID−pMS
pID
(1) where pID is the muon momentum as measured by the ID, while pMSis the momentum of a track recon- structed in the MS and then back-extrapolated to the primary vertex. pMS also includes the correction for the average muon energy loss in the calorimetry. In general the distribution of ∆pp provides an es- timate of the combined muon resolution (ID ⊕MS), where the relative contributions of the ID and MS
depend strongly on the pseudorapidity. At low |η|(roughly corresponding to the so-called ”barrel” of the MS), the ID momentum resolution for muons with 4 GeV<pT<20 GeV is dominated by multiple scattering, providing a momentum resolution of≈2%; whereas the stand-alone muon momentum reso- lution is dominated by energy loss fluctuations up to a momentum of 10 GeV and by multiple scattering above 10 GeV. A fractional stand-alone momentum resolution of about 5% is expected for muons with pT <10 GeV, thus dominating the overall resolution in the barrel. This is no longer the case at higher pseudorapidities (corresponding to the end-caps of the MS), where one expects that ID and MS measure- ments have comparable resolutions, especially for pT >10 GeV ((σ/p)ID≈(σ/p)MS≈4−5%).
The distribution of ∆pp is the result of the gaussian form of the average muon energy loss due to the in- strumental resolution convolved with a Landau distribution accounting for large energy loss fluctuations with respect to such average. Given these considerations, we use the following convolution function to fit the distribution, in bins of muon pT andη:
f(xG,σG,σL) = Z
dxL[G(xG,σG)×L(xL,σL)] (2) where xGand σG are the mean value and the standard deviation of the Gaussian, while xL is the most probable value of the Landau distribution L,σLis its width. We take the value of xGas scale. The quoted resolution is obtained by adding linearly the Gaussian and Landau widths, σG+σL, similarly to [10].
Both scale and resolution are returned by aχ2fit to the ∆pp distribution.
6.2 Backgrounds
We build the distribution from an inclusive sample of combined muons having both an ID and MS mea- surement. The two main components of this sample are represented by muons from heavy flavour decays and muonic decays of light mesons like pions and kaons. The latter category represents a background to the measurement of the resolution in the MS: late decays-in-flight, in which one combined muon is reconstructed from the muon track in the MS and the meson track in the ID, engender an artificially large momentum imbalance ∆pp, which is not due to the intrinsic MS resolution.
We use the likelihood-based method described in [11] to estimate the contribution to the scale and width introduced by theπ and K background: we extract templates for the background from simulated QCD events for each of the kinematic regions considered, and apply them onto the corresponding data distri- butions. The remaining population is assumed to be fully coming from heavy-flavour muons and used to extract a measurement of scale and resolution from the fit with the function in Eq.2. We take the heavy-flavour contribution as the best proxy to muons from HF decays, given the small sample of muons from W and Z boson decays available so far. Assuming that detector effects affect in the same way all muons, regardless of their origin, we shift the background of the same amount as the signal.
Figure 7 shows the distribution of ∆pp , for muons of 8 GeV<pT<10 GeV and|η|<1.05.
6.3 Data sets and event selection
In addition to the definitions from Sec. 3 this measurement requires the presence of one combined muon with pT >5 GeV with at least 1 hit in the pixel detector and 6 hits in the SCT. To build the background templates we use a Monte-Carlo sample of QCD events with at least 2 jets, one of which with pT >
17 GeV. This is also the Monte-Carlo dataset used for comparisons of results with collision data. We also validate the template shapes on a sample of 20 million non-diffractive minimum-bias events.
)/pID
−pMS
(pID
−1 −0.8 −0.6 −0.4 −0.2 0 0.2 0.4 0.6 0.8 1
Muons / 0.02
0 50 100 150 200 250 300 350 400
)/pID
−pMS
(pID
−1 −0.8 −0.6 −0.4 −0.2 0 0.2 0.4 0.6 0.8 1
Muons / 0.02
0 50 100 150 200 250 300 350 400
= 7 TeV) s Data 2010 ( Best−fit Heavy−flavour Pion/kaon L ~ 17 nb−1
∫
) < 10 GeV µ
T( 8 GeV < p
)| < 1.05 µ η(
| ATLAS Preliminary
Figure 7: The distribution of ∆ppfor combined muons with 8 GeV<pT<10 GeV in the MS barrel (dots).
The best-fit function for this distribution (full-line), the heavy flavour component (dashed-line) and the background (dotted-line) are also displayed.
6.4 Results
6.4.1 Relative momentum scale and resolution as a function of pT
We divide the inclusive muon sample into the following pT bins: 5−6 GeV, 6−8 GeV, 8−10 GeV and 10−20 GeV; and two pseudorapidity regions: |η|<1.05 (corresponding to the MS barrel region), 1.05<|η|<2.5 (where the upper value corresponds to the limit of the ID tracking acceptance). The results on relative scale and resolution obtained from the fitting procedure described above are displayed in Figure 8 and 9 for all the pT bins, and for the barrel and end-caps separately, including the template- based background estimations. The errors shown are statistical ones only. The mean energy loss of a muon in the considered momentum range is about 3 GeV: therefore a momentum scale of≈2% for low momentum muons translates into about a 4% uncertainty on the knowledge of the mean energy loss. For comparison, we also display the scale and resolution values, obtained from the above QCD Monte-Carlo using the same analysis method. Generally a good agreement between data and simulation is found, with the exception of the resolution in the end-cap region, due to an imperfect alignment: this is expected given the lower acceptance of this region to Cosmic Ray muons, used to align the barrel in 2009. For the latter, we also show the best fit to the relative pT resolution of the MS obtained using Cosmic ray data and published in [10]. The resolution function is of the form
σpT
pT
= P0
pT ⊕P1⊕P2×pT (3)
In the end-caps both scale and resolution depend only slightly on pT, because in this pseudorapidity region the probed pTcorresponds to a momentum range dominated by the constant term P1corresponding to the multiple scattering.
6.4.2 Relative momentum scale and resolution as a function ofη
We also study the dependence of the relative momentum scale and resolution from the muon pseudo- rapidity. We define 5 regions in the negative and positive η range, to probe the MS layout and current
Figure 8: The momentum scale (left) and resolution (right) for the barrel (|η|<1.05) as a function of the combined muon pT, obtained on collision data from 2010 (black, full dots). Overlaid are shown the expectations from QCD Monte-Carlo (blue). In red the fitted relative resolution of the MS obtained using Cosmic ray data, with an uncertainty band corresponding to ±1σ.
Figure 9: The momentum scale (left) and resolution (right) for the end-cap region (1.05<|η|<2.5) as a function of the combined muon pT, obtained on collision data from 2010 (black, full dots). Overlaid are shown the expectations from QCD Monte-Carlo (blue).
detector instrumentation conditions:
• 0.0<|η|<0.5 and 0.5<|η|<1.0: to study the stability of the momentum determination in the barrel in detail, compatible with available statistics;
• 1.0<|η|<1.4: in this region part of the MDT chambers are not yet installed, so that muon reconstruction is always performed with only two MDT chambers;
• 1.4<|η|<2.0: where three MDT stations are available to muon reconstruction, with an expected momentum resolution similar to the one in the barrel, if the alignment is correct;
• 2.0<|η|<2.5: where the momentum measurement in the MS depends on the CSC measurement.
We consider all muons with pT>5 GeV. The results are shown in Figure 10. The observed behaviour is compatible with expectations throughout the pseudorapidity range: in particular the CSC region shows a worse resolution than the MDT-dominated one, due to a less advanced degree of alignment. The dif- ference in resolution between the 1.0<η<1.4 and the−1.4<η<−1.0 region is under investigation.
For comparison, also in this case we overlay the expectations from QCD Monte-Carlo simulation, which shows a generally good agreement in scale, with the exceptation of the problematic −1.4<η<−1.0 region; and a worse resolution in data than in simulation from the end-cap regions, especially in the CSC-dominated|η|range, due to imperfect alignment.
Figure 10: The momentum scale (left) and resolution (right) as a function of the combined muon η, obtained on collision data from 2010 (black, full dots). Overlaid are shown the expectations from QCD Monte-Carlo (blue).
7 Conclusions
The first 17 nb−1 integrated luminosity of p-p collision data have been used to test the simulation of key properties of the ATLAS muon identification, such as efficiencies, rates of secondary muons from
pions, and momentum scale and resolution. The redundancy of detectors has provided a way to estimate the quality of simulation from relative measurement on the same muon candidate from different parts of the detector, or a different trigger selecting an unbiased background sample. A good level of agreement between simulation and data is observed in all quantities.
References
[1] ATLAS Collaboration, G. Aad et al., The ATLAS Experiment at the CERN Large Hadron Collider, JINST 3 (2008) S08003.
[2] ATLAS Collaboration, Muon Performance in Minimum Bias pp Collision Data at√s=7 TeV with ATLAS, ATLAS-CONF-2010-036 (2010) .
[3] The ATLAS Collaboration, G. Aad et al., Expected Performance of the ATLAS Experiment - Detector, Trigger and Physics,arXiv:0901.0512 [hep-ex].
[4] T. Sjostrand, S. Mrenna, and P. Z. Skands, PYTHIA 6.4 Phyisics and Manual, JHEP 09 (2009) 026.
[5] GEANT-4 Collaboration, S. Agostinelli et al., GEANT-4: A simulation toolkit, Nucl. Instrum.
Meth. (2003) .
[6] ATLAS Collaboration, ATLAS Monte Carlo tunes for MC09, Tech. Rep.
ATL-PHYS-PUB-2010-002, CERN, Geneva, Mar, 2010.
[7] A. Sherstnev and R. S. Thorne, Parton Distributions for LO Generators, Eur. Phys. J. C55 (2008) 553–575.
[8] ATLAS Collaboration, Preliminary studies for the measurement of the inclusive muon spectrum in pp collisions at√
s=7 TeV with the ATLAS detector., ATLAS-CONF-2010-035 (2010) . [9] ATLAS Collaboration, Kinematic Distributions of K0SandΛ0decays in collision data at
√s=7 TeV, ATLAS-CONF-2010-033 (2010) .
[10] ATLAS Collaboration, G. Aad et al., Commissioning of the ATLAS Muon Spectrometer with Cosmic Rays,arXiv:1006.4384 [hep-ex].
[11] ATLAS Collaboration, Extraction of the prompt muon component in inclusive muons produced at sqrt(s) = 7 TeV, ATLAS-CONF-2010-075 (2010) .