A TLAS-CONF-2015-064 15 December 2015
ATLAS NOTE
ATLAS-CONF-2015-064
15th December 2015
B ± mass reconstruction in B ± → J /ψ K ± decay at ATLAS at 13 TeV p p collisions at the LHC
The ATLAS Collaboration
Abstract
The performance of the ATLAS detector in reconstructing B ± candidates is tested using 3 . 2 fb − 1 of pp collision data from the LHC at a centre of mass energy of 13 TeV. The B ± invariant mass is determined via the B ± → J/ψ ( µ + µ − )K ± decay. The B ± mass is extracted in several rapidity intervals and used to test the momentum calibration of Inner Detector tracking at low-to-medium transverse momentum ( p T ) values. This study of the Inner Detector performance is a necessary prerequisite to future B -physics analyses with the ATLAS detector as the tracking performance determines the precision of these measurements.
© 2015 CERN for the benefit of the ATLAS Collaboration.
Reproduction of this article or parts of it is allowed as specified in the CC-BY-4.0 license.
1 Introduction
During Long Shutdown 1 (LS1) between LHC Run 1 and Run 2, the ATLAS detector was upgraded. A new layer of pixel detectors, the Insertable B-Layer (IBL), was added to the Inner Detector (ID) between the existing detector and the beam pipe. Run 2 also brought new LHC run conditions, such as a significantly increased centre of mass energy, a different number of interactions per bunch crossing and 25 ns bunch spacing. This document is devoted to the measurement of the B ± mass, in several rapidity intervals, in the decay channel B ± → J/ψ ( µ + µ − ) K ± . B-hadrons are produced in low and medium momenta so the measurement of B ± mass gives an opportunity to test the p T calibration of the ATLAS ID.
2 Data samples, reconstruction and candidate selection
The analysis uses 3 . 2 fb − 1 of 13 TeV pp collision data taken in 2015 with a bunch spacing of 25 ns. Only data collected when all detector systems were operating correctly and when the LHC beams were declared to be stable are used in the analysis. No explicit trigger selection is made. However, the majority ( ∼ 90%) of the events selected for the final analysis were collected by a di-muon trigger requiring two muons, each above a p T threshold of 4 GeV, to pass J/ψ mass and vertex requirements, while the remaining events were collected by other triggers with single or multi-muon signatures. In addition to these data-quality selection criteria, each event must contain at least one reconstructed primary vertex, formed from at least three ID tracks.
To reconstruct the B ± , a J/ψ candidate is first constructed by refitting a pair of oppositely charged muon candidates with p T > 4 GeV to a common vertex, where the quality of the fit meets the requirement χ 2 /d.o.f. < 10. The muons are identified using information from both the Muon Spectrometer (MS) and the ID [1–3]. To study the ID performance better, the muon track parameters are determined from the ID measurement alone, as the precision of the measured track parameters in the p T range of interest for this analysis is anyway dominated by the ID track reconstruction. The invariant mass of the muon pair is calculated from the refitted track parameters, and pairs with a mass in the range (2 . 6 − 3 . 6) GeV are accepted for further analysis.
The B ± candidates are then formed by adding another track (a kaon candidate) with p T > 3 GeV and absolute rapidity | y | < 2 . 5. This track must not have been identified as a muon. Candidates for B ± → J/ψ ( µ + µ − ) K ± decays are selected by fitting the tracks from each J/ψ → µ + µ − candidate in the event with each kaon candidate to a common vertex. Each of the three tracks is required to have at least one hit in the pixel detector and at least four hits in the silicon microstrip detector. The fit is further constrained by fixing the invariant mass calculated from the two muon tracks to the world average J/ψ mass [4]. No constraint for the B ± momentum to point from the secondary to a primary vertex is applied in the fit. A triplet of tracks is accepted for further analysis if the vertex fit has a χ 2 /d.o.f. < 3. If there is more than one accepted candidate in the event, the candidate with the lowest χ 2 / d.o.f. is selected. In total, 677652 B ± candidates are collected within a mass range of ( 5 . 0 − 5 . 8 ) GeV.
The mean p T of the B ± mesons, J /ψ and kaons from selected candidates are 25.6 GeV, 18.5 GeV and
7.3 GeV, respectively.
3 Method of B ± → J /ψ K ± mass fit
An unbinned maximum-likelihood fit is performed on the selected events to extract the B ± mass. The likelihood function, L , is defined as a combination of the signal and background probability density functions as follows:
ln L =
N
X
i =1
{ ln ( f s · F s (m i ) + f s · f Bx · F B
x(m i ) + f s · f B
π· F B
π(m i ) + ( 1 − f s · ( 1 + f B
x+ f B
π))F bkg (m i ))},
(1) where N is the number of selected candidates, f s is the fraction of signal candidates, f B
xis the fraction of partially reconstructed B hadrons and f B
πis the fraction of B ± → J /ψπ ± decays mis-identified as B ± → J /ψK ± candidates, calculated relative to the number of signal events. The fraction f B
πis fixed to a value derived from Monte Carlo (MC) simulations [5, 6] and accounting for the measured branching fraction (see below). The mass m i is measured from the data for each event i . F s , F B
x, F B
πand F bkg are the probability density functions (PDF) modelling the signal, the specific B x and B ± → J /ψπ ± backgrounds and the remaining combinatorial background. The signal PDF F s is modelled as a sum of two Gaussian distributions with a commom mean. The F B
xbackground is modelled as a hyperbolic tangent function. Combinatorial background is formed from an association of J/ψ → µ + µ − with tracks coming from the primary vertex and passing the B ± → J/ψ K ± selection criteria explained in section 2.
It was approximated in the fit by a linear function of mass.
The B ± → J/ψπ ± background is determined from simulated events, wrongly assigning the kaon mass to the pion. The pp collisions are simulated by Pythia 8.186 [5]. The A14 [7] tune is used together with the CTEQ6L1 parton density function set [8]. Multiple overlaid proton-proton collisions are simulated with the soft QCD processes of Pythia 8.186 [5] using tune A2 [9] and the MSTW2008LO parton density function set. Geant4 [6] and the standard ATLAS reconstruction chain are used to obtain the simulated events in the detector. Trigger prescaling corrections are applied and the p T and rapidity ( y ) distributions of B ± in the B ± → J /ψπ ± MC events were reweighted to match the data, where the distributions for real data were extracted from B ± → J/ψ K ± event candidates using a side-band subtraction method.
The B ± → J/ψπ ± background fraction was fixed in the fit. It was calculated using the relative decay probabilities of B ± → J/ψ K ± and B ± → J/ψπ ± decays taken from the LHCb measurement [10] and the relative efficiencies of the two processes calculated from MC events. The B ± → J/ψπ ± mass distribution is modelled by a Gaussian function.
4 B ± mass fit
Figure 1 shows the per-candidate mass errors for B ± → J /ψK ± as a function of rapidity. These errors
are calculated from track measurements after they are re-fitted to a common B ± vertex and indicate the
behaviour of the mass resolution. The B ± mass resolution varies significantly and therefore the mass
fit is performed in 16 B ± rapidity intervals: 14 intervals each of size 0.25 in the central region (-1.75
- 1.75) and two larger intervals covering the left and the right end-caps: (-2.5 - -1.75) and (1.75 - 2.5),
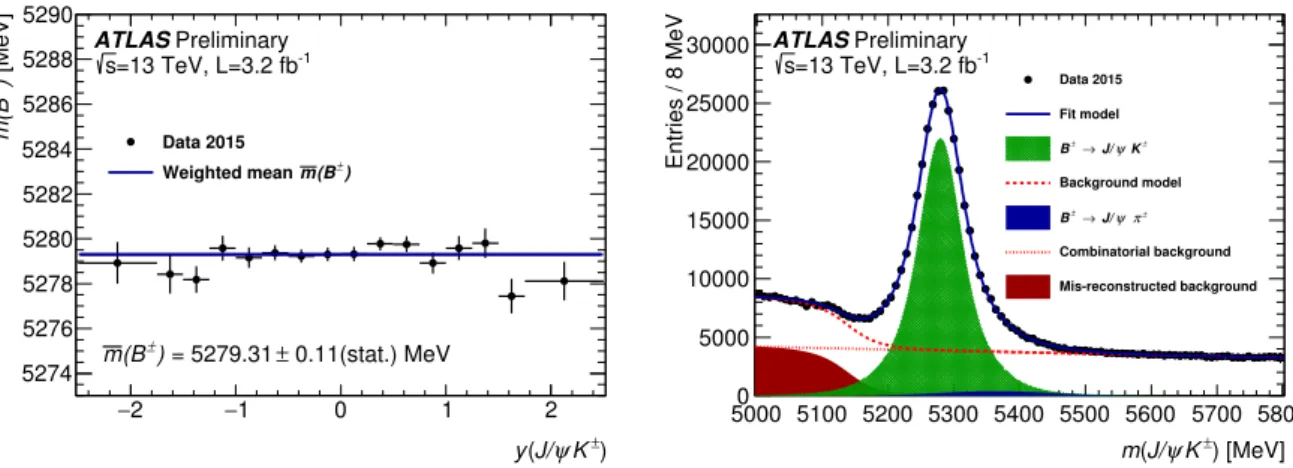
respectively. The masses determined in each interval are shown in Figure 2, left, and Table 1. The fitted
functions for the signal and background are summed up and used to describe the B ± mass distribution over
the entire rapidity interval, which is shown in Figure 2, right. A B ± mass value of 5279.31 ± 0.11 MeV is determined using the weighted mean of the mass values obtained from the individual fits to each rapidity interval, where the error is statistical only.
±
) K ψ y(J/
3
− − 2 − 1 0 1 2 3
[MeV] )
±K ψ (J/
mδ
0 10 20 30 40 50 60
ATLAS Preliminary
=13 TeV, L=3.2 fb
-1s
Figure 1: Per-candidate mass errors for B ± → J/ψK ± as a function of y . These errors are calculated from track measurements after they are re-fitted to a common B ± vertex, with the vertex fit constrained by fixing the invariant mass calculated from the two muon tracks to the world average J/ψ mass. The per-candidate mass errors are not taken into account in the current mass fit. The distribution only illustrates changes of mass resolution over rapidity.
±
) K J/ ψ ( y 2
− − 1 0 1 2
[MeV] )
±m(B
5274 5276 5278 5280 5282 5284 5286 5288 5290
ATLAS Preliminary
=13 TeV, L=3.2 fb
-1s
0.11(stat.) MeV = 5279.31 ±
±
) (B m
Data 2015
±) (B m Weighted mean
) [MeV]
K
±J/ ψ ( m
5000 5100 5200 5300 5400 5500 5600 5700 5800
Entries / 8 MeV
0 5000 10000 15000 20000 25000
30000 ATLAS Preliminary
=13 TeV, L=3.2 fb
-1s
Data 2015Fit model K± J/ψ
±→ B
Background model π± ψ
→J/
B±
Combinatorial background Mis-reconstructed background
Figure 2: (Left) B ± mass fitted in several bins of y value of the B ± . Errors shown in figures are statistical errors of the fit. (Right) Mass of the B ± → J/ψK ± for the entire rapidity sample. The fit functions are constructed as a weighted sum of the individual fits in y bins. The blue line shows the total fit, the green area shows the signal component; while the blue area shows the contribution from B ± → J/ψπ ± decays. The total background is shown as a red dashed line and the red area is a background contributions of partially reconstructed B-hadrons decaying to J/ψ X , where one hadron was reconstructed while others escaped the reconstruction.
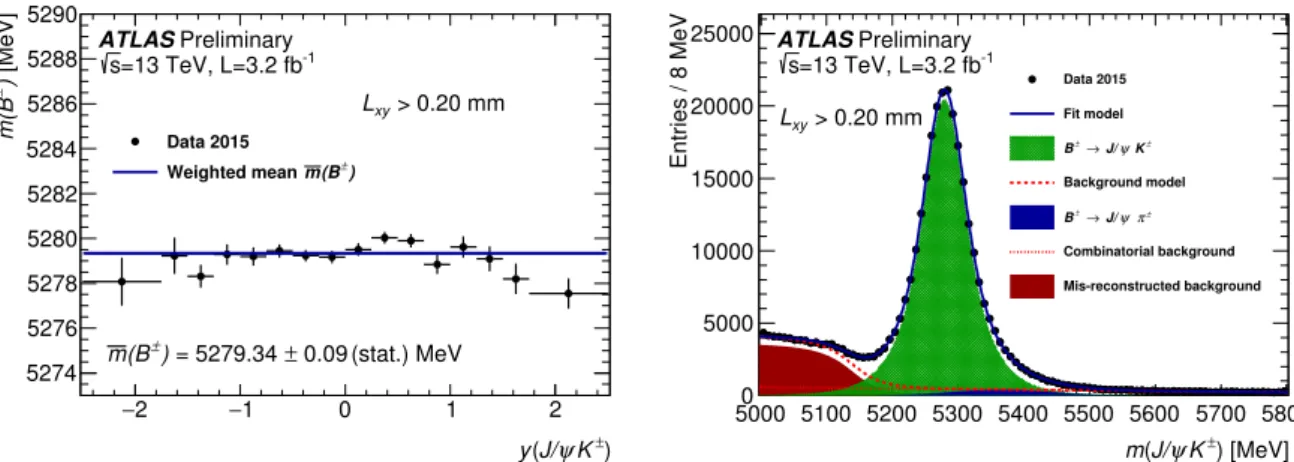
Analogously the fits are applied to B ± → J/ψ K ± mass candidates after applying a selection cut on the transverse decay length, L xy > 0.2 mm. The results are shown in Figure 3. The value of the extracted B ± mass is 5279.34 ± 0.09 MeV, where the error is statistical only.
Our two results in Table 2, the B ± mass extracted from events with and without an L xy cut, are consistent
±
) K J/ ψ ( y 2
− − 1 0 1 2
[MeV] )
±m(B
5274 5276 5278 5280 5282 5284 5286 5288 5290
ATLAS Preliminary
=13 TeV, L=3.2 fb
-1s
(stat.) MeV 0.09
= 5279.34 ±
±
) (B m
> 0.20 mm L
xyData 2015
±) (B m Weighted mean
) [MeV]
K
±J/ ψ ( m
5000 5100 5200 5300 5400 5500 5600 5700 5800
Entries / 8 MeV
0 5000 10000 15000 20000
25000 ATLAS Preliminary
=13 TeV, L=3.2 fb
-1s
> 0.20 mm L
xyData 2015 Fit model K± J/ψ
±→ B
Background model π± ψ
→J/
B±
Combinatorial background Mis-reconstructed background
Figure 3: (Left) B ± mass fitted in several bins of y value of the B ± after a cut L xy > 0.2 mm. Errors shown in figures are statistical errors of the fit. (Right)Mass of the B ± → J/ψK ± entire rapidity sample. The fit functions are constructed as a weighted sum of the individual fits in y bins. The blue line shows the total fit, the green area shows the signal component; while the blue area shows the contribution from B ± → J/ψπ ± decays. The total background is shown as a red dashed line and red area is a background contributions of partially reconstructed B-hadrons decaying to J/ψX , where one hadron was reconstructed while others escaped the reconstruction.
y Fit Result [MeV]
− 2 . 5 → − 1 . 75 5279 . 93 ± 0 . 94
− 1 . 75 → − 1 . 5 5278 . 41 ± 0 . 86
− 1 . 5 → − 1 . 25 5278 . 18 ± 0 . 59
− 1 . 25 → − 1 . 0 5279 . 58 ± 0 . 55
− 1 . 0 → − 0 . 75 5279 . 16 ± 0 . 45
− 0 . 75 → − 0 . 5 5279 . 37 ± 0 . 34
− 0 . 5 → − 0 . 25 5279 . 23 ± 0 . 29
− 0 . 25 → 0 . 0 5279 . 30 ± 0 . 31
y Fit Result [MeV]
0 . 0 → 0 . 25 5279 . 32 ± 0 . 32 0 . 25 → 0 . 5 5279 . 77 ± 0 . 30 0 . 5 → 0 . 75 5279 . 76 ± 0 . 34 0 . 75 → 1 . 0 5278 . 93 ± 0 . 48 1 . 0 → 1 . 25 5279 . 59 ± 0 . 54 1 . 25 → 1 . 5 5279 . 81 ± 0 . 66 1 . 5 → 1 . 75 5277 . 45 ± 0 . 78 1 . 75 → 2 . 5 5278 . 11 ± 0 . 86 Table 1: Fit results in y -dependent fits with no L xy cut.
with each other. Both ATLAS results are consistent with the world average [4] and LHCb [11] values.
Extracted B ± masses show a very good uniformity with rapidity over the full rapidity range of the ID.
Small deviations from the average mass are seen in the end-cap regions, | y | > 1 . 5, these are of magnitude 2 MeV which is 0.5 per-mille of the fitted B ± mass.
5 B ± mass fit systematics
As described in Section 4, the B ± mass resolution varies strongly over the full rapidity region, so the mass fit is done separately for subsets of B ± candidates in 16 B ± rapidity intervals and a resulting mass is determined as a weighted average of these fits. We consider systematic effects on the fit in the two most extreme rapidity bins: | y | < 0 . 25 and 1 . 75 ≤ | y | ≤ 2 . 5. However, for some tests, where the number of fit parameters increases, there are insufficient statistics in a single rapidity bin to obtain reliable results.
In this case, the systematics are studied using a full barrel fit ( | y | < 1 . 25) and an additional systematic
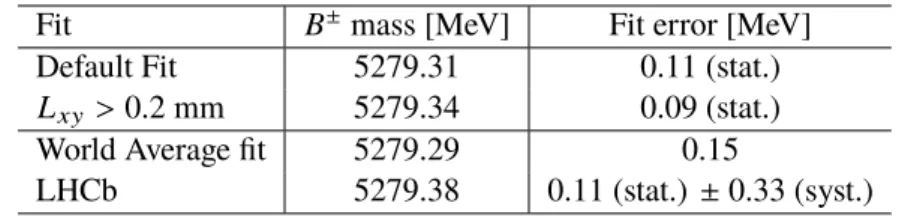
Fit B ± mass [MeV] Fit error [MeV]
Default Fit 5279.31 0.11 (stat.)
L xy > 0.2 mm 5279.34 0.09 (stat.)
World Average fit 5279.29 0.15
LHCb 5279.38 0.11 (stat.) ± 0.33 (syst.)
Table 2: Fitted B ± mass values extracted from a weighted average of the fits to B ± → J/ψK ± candidates in y bins with no L xy cut and L xy > 0.2 mm. Also shown to the world average [4] and LHCb [11] values.
is included for this simplification. This additional y -dependence systematic is taken as the difference between the weighted average of the 10 fits in the barrel region ( |y | ≤ 1 . 25) and the weighted average of the 16 bins in the full y -range and is found to be 0.11 MeV
The remaining fit systematics are described below.
• Variation of signal mass model : The default signal mass model is a double Gaussian. An alternative fit was done using a triple Gauss PDF. The extracted B ± mass was different from the default by 0.09 MeV, which is taken as the systematic.
• Variation of background mass model : Parametrisations of the background mass PDFs are varied to establish a systematic error on the fitted B ± mass due to the background model. Alternative fits are performed with the linear component replaced by an exponential PDF or the hyperbolic tangent component replaced by a complementary error function. The largest difference between the variant fits and the default is used to estimate a systematic error due to background modelling of 0.17 MeV.
• Choice of fit mass window : In order to test the validity of the background PDFs (both for the pure combinatorial and partially reconstructed B -decays), we varied the fit mass range. The left sideband was changed from 5000 MeV up to 5060 MeV, while the right sideband from 5800 MeV down to 5600 MeV. The mean deviation of the fitted B ± mass was 0.04 MeV and a maximum deviation was 0.14 MeV. The latter is assigned as the systematic uncertainty.
• Uncertainty of B ± → J/ψπ ± background : The systematic uncertainty due to the MC modelling of the B ± → J/ψπ ± component is considered in three alternative sets of the fits:
– B ± → J/ψπ ± fraction: The uncertainty of the ratio between the B ± → J/ψπ ± and B ± → J/ψ ( µ + µ − ) K ± branching ratios is used to vary the fitted fraction of B ± → J/ψπ ± events by ±σ in the fit. The largest difference, 0.02 MeV, between the variant fits and the default fit is used to establish an estimate of the systematic uncertainty due to the fitted B ± → J /ψπ ± fraction.
– B ± → J/ψπ ± line shape: The limited number of MC B ± → J/ψπ ± events leads to an uncertainty in the fitted mass distribution of B ± → J/ψπ ± events mis-reconstructed as B ± → J/ψ ( µ + µ − ) K ± events. To estimate the effect of this on the fitted B ± mass the parameters describing the B ± → J/ψπ ± background component are varied by 1 σ . The largest difference between the alternative fits and the default is used to establish an estimate of the systematic uncertainty: 0.04 MeV.
– B ± → J/ψπ ± MC reweighting: The B ± → J/ψπ ± MC sample is kinematically reweighted
to data using a side-band subtraction technique. Another set of weights is used to correct for
trigger prescaling in data. To estimate the effect of possible errors in the reweighting due to the statistical limits on the data sample and the difference in trigger modelling between data and MC samples, an unweighted MC sample is used to generate an alternative B ± → J /ψπ ± mass distribution. The difference of 0.04 MeV in the fitted B ± mass between the default fit and the fit using the unweighted MC sample is used to establish a conservative estimate of the systematic uncertainty due to the MC reweighting procedure.
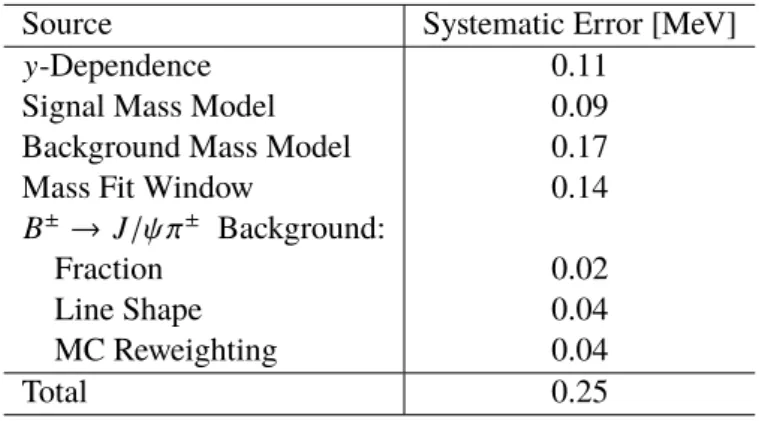
A summary of the systematic uncertantiess is given in Table 3. Taking the considered sources of the systematics as independent, the total systematic uncertainty due to the fit model is estimated as 0.25 MeV.
Source Systematic Error [MeV]
y -Dependence 0.11
Signal Mass Model 0.09
Background Mass Model 0.17
Mass Fit Window 0.14
B ± → J/ψπ ± Background:
Fraction 0.02
Line Shape 0.04
MC Reweighting 0.04
Total 0.25
Table 3: Systematic errors and the total systematic error of the fitted B ± mass due to the fit model.
6 Conclusion
The B ± mass is determined in the B ± → J/ψ( µ + µ − ) K ± decay using 3 . 2 fb − 1 of integrated luminosity
collected by the ATLAS detector from 13 TeV pp collisions at the LHC. We extracted a B ± mass of
5279.31 ± 0.11 (stat.) MeV. The systematic uncertainty related to the signal fit model and background
parametererisation is evaluated to be 0.25 MeV. Systematic uncertainties due to momentum scale and
vertexing are currently not included. The measured B ± mass is in good agreement with the world
average value and with the B ± mass measured by LHCb, which validates the momentum calibration of the
ATLAS Inner Detector tracking with 2015 data. The B ± mass values, extracted in 16 rapidity intervals,
demonstrate the uniformity of the B ± reconstruction with rapidity over the entire rapidity coverage of the
Inner Detector.
References
[1] ATLAS Collaboration, The ATLAS Experiment at the CERN Large Hadron Collider , JINST 3 (2008) S08003.
[2] M. Capeans et al., ATLAS Insertable B-Layer Technical Design Report , CERN-LHCC-2010-013. ATLAS-TDR-19 (2010),
url: https://cds.cern.ch/record/1291633 .
[3] ATLAS Collaboration, ATLAS Insertable B-Layer Technical Design Report Addendum , CERN-LHCC-2012-009. ATLAS-TDR-19-ADD-1 (2012), Addendum to
CERN-LHCC-2010-013, ATLAS-TDR-019, url: https://cds.cern.ch/record/1451888 . [4] K. Olive et al., Review of Particle Physics , Chin.Phys. C38 (2014) 090001.
[5] T. Sjostrand, S. Mrenna and P. Z. Skands, A Brief Introduction to PYTHIA 8.1 , Comput.Phys.Commun. 178 (2008) 852, arXiv: 0710.3820 [hep-ph] .
[6] S. Agostinelli et al., GEANT4: A Simulation toolkit , Nucl.Instrum.Meth. A506 (2003) 250.
[7] R. D. Ball et al., Parton distributions with LHC data , Nucl. Phys. B867 (2013) 244, arXiv: 1207.1303 [hep-ph] .
[8] J. Pumplin et al., New generation of parton distributions with uncertainties from global QCD analysis , JHEP 07 (2002) 012, arXiv: hep-ph/0201195 .
[9] ATLAS Collaboration, Summary of ATLAS Pythia 8 tunes , ATL-PHYS-PUB-2012-003 (2012), url: https://cds.cern.ch/record/1474107 .
[10] R. Aaij et al., LHCb Collaboration, Measurements of the branching fractions and CP asymmetries of B ± → J /ψ π ± and B ± → ψ(2 S)π ± decays , Phys. Rev. D85 (2012) 091105,
arXiv: 1203.3592 [hep-ex] .
[11] R. Aaij et al., LHCb Collaboration, Measurement of b-hadron masses ,
Phys. Lett. B708 (2012) 241, arXiv: 1112.4896 [hep-ex] .
Appendix
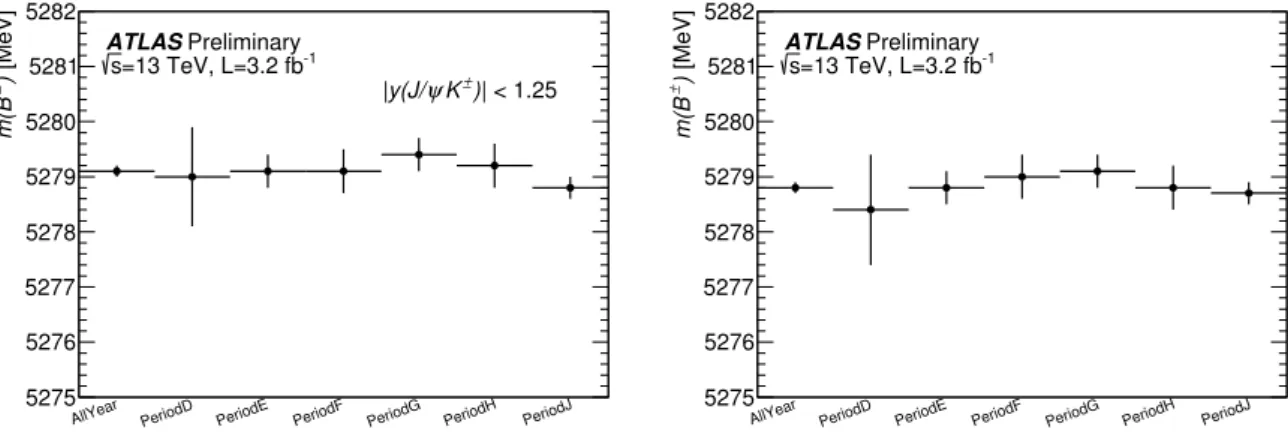
AllYear PeriodD PeriodE PeriodF PeriodG PeriodH PeriodJ
[MeV] )
±m(B
5275 5276 5277 5278 5279 5280 5281 5282
ATLAS Preliminary
=13 TeV, L=3.2 fb
-1s
| < 1.25
±
) K y(J/ ψ
|
AllYear PeriodD PeriodE PeriodF PeriodG PeriodH PeriodJ