ATLAS-CONF-2015-067 15December2015
ATLAS NOTE
ATLAS-CONF-2015-067
13th December 2015
Search for pair-production of gluinos decaying via stop and sbottom in events with b-jets and large missing transverse momentum in √
s = 13 TeV p p collisions with the ATLAS detector
The ATLAS Collaboration
Abstract
A search for pair-production of gluinos decaying via third generation squarks to the lightest neutralino ( ˜ χ
01) is reported. It uses an LHC proton-proton dataset at a centre-of-mass energy
√
s
=13 TeV with an integrated luminosity of 3.3 fb
−1collected with the ATLAS detector in 2015. The signal is searched for in events containing several energetic jets, of which at least three must be identified as b-jets, large missing transverse momentum and potentially isolated charged electrons or muons. Massive large-radius jets are also used to identify highly boosted top quarks. The data are found to be in good agreement with the predicted background yield. For ˜ χ
01masses below approximately 700 GeV, gluino masses of less than 1780 GeV and 1675 GeV are excluded at the 95% CL in simplified models of the pair- production of gluinos decaying via sbottom and stop, respectively.
©2015 CERN for the benefit of the ATLAS Collaboration.
Reproduction of this article or parts of it is allowed as specified in the CC-BY-3.0 license.
1 Introduction
Supersymmetry (SUSY) [1–6] is a generalization of space-time symmetries that predicts new bosonic partners to the fermions and new fermionic partners to the bosons of the Standard Model (SM). If R- parity is conserved [7], SUSY particles are produced in pairs and the lightest supersymmetric particle (LSP) is stable. The scalar partners of the left- and right-handed quarks, the squarks ˜ q
Land ˜ q
R, can mix to form two mass eigenstates ˜ q
1and ˜ q
2, ordered by increasing mass. SUSY can solve the hierarchy problem [8–11] by preventing “unnatural” fine-tuning in the Higgs sector provided that the superpartners of the top quark (stop, ˜ t
1and ˜ t
2) have masses not too far above the weak scale. Because of the SM weak isospin symmetry, the mass of the left-handed bottom quark scalar partner (sbottom, ˜ b
L) is tied to the mass of the left-handed top quark scalar partner (˜ t
L), and as a consequence the mass of the lightest sbottom ˜ b
1is also expected to be close to the weak scale. The fermionic partners of the gluons, the gluinos ( ˜
g), are also constrained by naturalness [12,13] to have a mass around the TeV scale in order to limit their contributions to the radiative corrections to the stop masses. For these reasons, and because the gluinos are expected to be pair-produced with a high cross-section at the Large Hadron Collider (LHC) [14], the search for gluino-mediated stop and gluino-mediated sbottom production is highly motivated at the LHC.
This note presents the search for gluino pair-production where both gluinos either decay to stops via
˜
g→
t ˜
1t, or to sbottoms via ˜
g→b ˜
1b, using a dataset of 3.3 fb
−1of proton–proton data collected with the ATLAS detector [15] at a centre-of-mass energy of
√s
=13 TeV. Each stop (sbottom) is then assumed to decay to a top quark and the LSP (a bottom quark and the LSP): ˜ t
1 →t χ ˜
01( ˜ b
1 →b χ ˜
01). The LSP is assumed to be the lightest neutralino ˜ χ
01, the lightest linear superposition of the superpartners of the neutral electroweak and Higgs bosons. The ˜ χ
01interacts only weakly, resulting in substantial missing transverse momentum of magnitude E
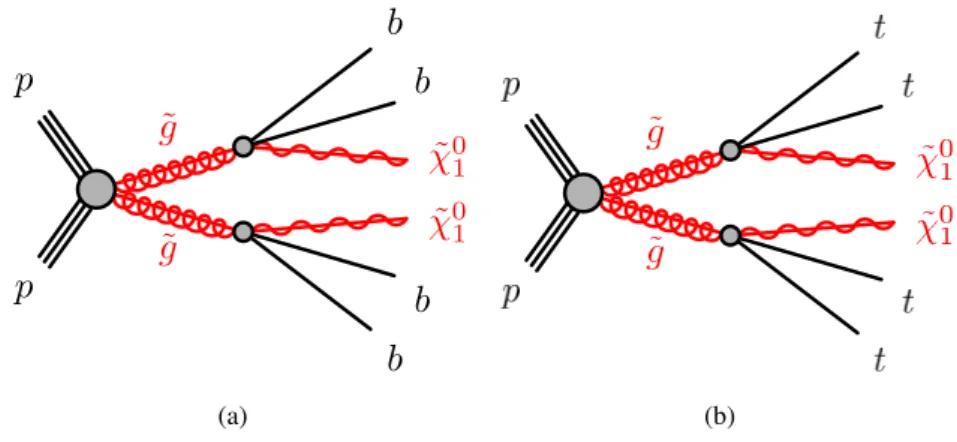
Tmiss. Diagrams of the simplified models [16, 17] considered, which will be referred to as “Gbb” and “Gtt” in the following, are shown in figure 1(a) and 1(b), respectively.
The sbottom and stop are assumed to be produced off-shell such that the gluinos undergo the three-body decay ˜
g →b b ¯ χ ˜
01or ˜
g →t¯ t χ ˜
01, and that the only parameters of the simplified models are the gluino and
χ ˜
01masses1.
˜ g
˜ g p
p
˜ χ
01b
b
˜ χ
01b b
(a) (b)
Figure 1: The decay topologies in the (a) Gbb and (b) Gtt simplified models.
1Models with on-shell sbottom and stop have been studied in Run 1 [18] and the limits on the gluino and the ˜χ01masses were found to be mostly independent on the stop and sbottom masses, except when the stop is very light.
The Gbb model results in an experimental signature consisting of four energetic b-jets and large E
Tmiss. In order to maintain high signal efficiency, at least three of four required jets must be identified as b-jets (b-tagged). This requirement is very e
ffective to reject t¯ t events, which constitute the main background for both the Gbb and Gtt models, and which contain only two b-jets unless they are produced with addi- tional heavy-flavour jets. The Gtt experimental signature also contains four b-jets and E
Tmiss, but yields in addition four W bosons coming from the top quark decays t
→W b. Each W boson can either decay leptonically (W
→`ν) or hadronically (W
→q q ¯
0). A Gtt event will therefore possess a high jet multipli- city, with as many as 12 jets coming from top quark decays, and potentially isolated charged leptons. In this note, gluino-mediated stop production is searched for using events with high jet multiplicity, of which at least three must be identified as b-jets, large E
Tmiss, and either zero lepton (referred to as Gtt 0-lepton channel) or at least one identified charged lepton2 (referred to as Gtt 1-lepton channel). For both the Gbb and Gtt models, several signal regions are designed to cover various scenarios of gluino and ˜ χ
01masses.
For the Gtt model with a large mass difference (mass splitting) between the gluino and ˜ χ
01, the top quarks tend to be highly boosted and their decay products collimated. In the corresponding signal regions, at least one large radius, trimmed [19] jet, which is re-clustered from small radius jets [20], is required to have a high mass to identify hadronically-decaying boosted top quarks.
Gluino-mediated sbottom production was searched for in ATLAS Run 1 with a similar analysis requiring at least three b-tagged jets [18]. That analysis also searched for gluino-mediated stop production in events with at least three b-jets and either zero or at least one identified lepton and obtained the best ATLAS limits for the Gtt models with massless and moderately massive LSP [21]. Gluino-mediated stop events have also been searched for by ATLAS in events with high jet multiplicity [22], events with at least one lepton, many jets, and E
Tmiss[23], and events containing pairs of same-sign leptons or three leptons [24], the latter obtaining the best ATLAS limit for Gtt models with compressed mass spectra between the gluino and the LSP [21]. Searches for gluino-mediated stop and sbottom production have also been performed by CMS [25–30] using similar strategies and obtaining comparable results to ATLAS searches.
This note is structured as follows. The ATLAS detector is introduced in section 2. This is followed by the descriptions of the data and simulated samples used in the analysis (section 3), the physics object definition (section 4) and event selections (section 5). The systematic uncertainties affecting the analysis are described in section 6 and the results are presented in section 7. No excess is observed and exclusion limits are extracted, which are presented in section 8.
2 ATLAS detector
The ATLAS detector is a multi-purpose particle physics detector with a forward-backward symmetric cylindrical geometry and nearly 4π coverage in solid angle
3. The inner tracking detector (ID) consists of pixel and silicon microstrip detectors covering the pseudorapidity region
|η|< 2.5, surrounded by a transition radiation tracker (TRT) which enhances electron identification in the region
|η|< 2.0. Starting in Run 2, a new pixel layer, the Insertable B-Layer (IBL) [31], has been inserted at a mean sensor radius
2The term “lepton” will refer exclusively to an electron or a muon in this note.
3ATLAS uses a right-handed coordinate system with its origin at the nominal interaction point in the centre of the detector.
The positivex-axis is defined by the direction from the interaction point to the centre of the LHC ring, with the positive y-axis pointing upwards, while the beam direction defines thez-axis. Cylindrical coordinates (r, φ) are used in the transverse plane, φ being the azimuthal angle around thez-axis. The pseudorapidityηis defined in terms of the polar angleθ by η=−ln tan(θ/2).
of 3.3 cm. The ID is surrounded by a thin superconducting solenoid providing an axial 2 T magnetic field and by a fine-granularity lead/liquid-argon (LAr) electromagnetic calorimeter covering
|η|< 3.2.
A steel
/scintillator-tile calorimeter provides hadronic coverage in the central pseudorapidity range (|η
|<
1.7). The endcap and forward regions (1.5 <
|η|< 4.9) of the hadronic calorimeter are made of LAr active layers with either copper or tungsten as the absorber material. A muon spectrometer with an air- core toroid magnet system surrounds the calorimeters. Three layers of high-precision tracking chambers provide coverage in the range
|η|< 2.7, while dedicated fast chambers allow triggering in the region
|η|
< 2.4. The ATLAS trigger system [32] consists of a hardware-based Level-1 trigger followed by a software-based High Level Trigger (HLT).
3 Data and simulated event samples
Data used in this analysis were collected by the ATLAS detector from pp collisions produced by the LHC at a centre-of-mass-energy of 13 TeV and 25 ns proton bunch spacing. The full dataset corresponds to an integrated luminosity of 3.3 fb
−1with an associated uncertainty of
±9%, after requiring that all detectorsubsystems were fully operational during data recording. The uncertainty on the integrated luminosity is derived, following a methodology similar to that detailed in [33], from a preliminary calibration of the luminosity scale using a pair of x-y beam-separation scans performed in June 2015. Events are required to pass an E
Tmisstrigger which is fully e
fficient for events passing the preselection defined in section 5. Each event includes on average 14 additional ineleastic pp collisions (“pile-up”) in the same bunch-crossing.
Simulated event samples are used to model the signal and background processes in this analysis. The signal samples for the Gbb and Gtt processes are generated with up to two additional partons using MadGraph [34] v2.2.2 at leading order (LO) with CTEQ6L1 [35] PDF sets and showered by Pythia v8.186 [36].
The dominant background in the signal regions is the production of t t ¯ pairs with additional high-p
Tjets.
The sample for the estimation of this background is generated using the P
owheg-B
ox[37, 38] generator at next-to-leading order (NLO) with CT10 [39] PDFs and showered by P
ythiav6.42 [40]. The decays of heavy-flavour hadrons are modelled using the E
vtG
en[41] package. The h
dampparameter in P
owheg, which controls the p
Tof the first additional emission beyond the Born level and thus regulates the p
Tof the recoil emission against the t t ¯ system, is set to the mass of the top quark (m
top =172.5 GeV). This setting was found to give the best description of the p
Tof the t¯ t system at
√s
=7 TeV [42] and
√s
=8 TeV [43]. All events with at least one semi-leptonically decaying top quark are included.
Smaller backgrounds in the signal region come from the production of t¯ t pairs in association with W/Z/h and jets, single-top production, production of four top quarks, W/Z
+jets andW W
/W Z
/Z Z (diboson) events. The production of t¯ t pairs associated to electroweak vector bosons and four-top production are modelled by samples generated using M
adG
raphinterfaced to P
ythiav8.186, while t¯ t h processes are generated using MadGraph5_aMC@NLO [44] v2.2.1 and showered with Herwig++ [45] v2.7.1. Single- top production in the s-, t-, and W t-channel are generated by P
owheg-B
oxinterfaced to P
ythiav6.42.
W/Z
+jets and diboson processes are generated and showered using S
herpa2.1.1 [46–48] with CT10 PDF sets.
All simulated samples, with the exception of the Gbb signals, are passed through full ATLAS detector
simulation using G
eant4 [49, 50]. The Gbb signal samples are passed through a fast simulation that uses
a parametrised description to simulate the response of the calorimeter systems [51]. All Pythia v6.42
samples use the PERUGIA2012 [52] tune for the underlying event, while P
ythiav8.186 and H
erwig++showering are run with the A14 [53] and UEEE5 [54] underlying event tunes, respectively. In-time and out-of-time pile-up interactions from the same or nearby bunch-crossings are simulated by overlaying additional pp collisions generated by P
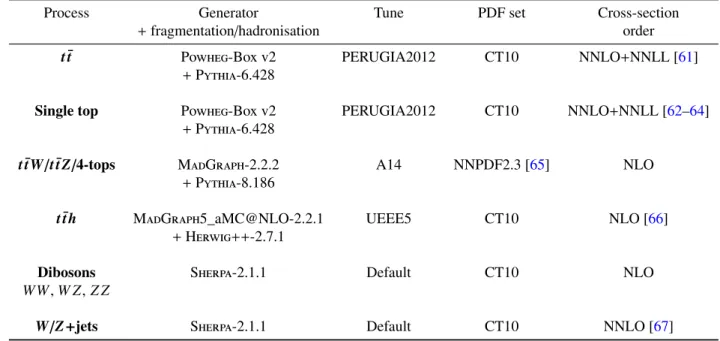
ythiav8.186 on top of the hard-scattering events. Details on the sample generation and normalisation are summarised in table 1. Additional samples with different generators and settings are used to estimate systematic uncertainties on the backgrounds, as described in section 6.
The signal samples are normalised to cross-sections calculated to next-to-leading order in the strong coupling constant, adding the resummation of soft gluon emission at next-to-leading-logarithmic accur- acy (NLO+NLL) [55–59]. The nominal cross-section and the uncertainty are taken from an envelope of cross-section predictions using different PDF sets and factorisation and renormalisation scales, as de- scribed in Ref. [60]. All background processes are normalised to the best available theoretical calculation for their respective cross-sections. The order of this calculation in perturbative QCD (pQCD) for each process is listed in table 1.
Simulated events are reconstructed with the same algorithms as data. Corrections derived from data control samples are applied to account for differences between data and simulation for the lepton recon- struction efficiencies, momentum scale and resolution, and for the efficiency and false-positive rate for identifying b-jets.
Process Generator Tune PDF set Cross-section
+fragmentation/hadronisation order
tt¯ Powheg-Boxv2 PERUGIA2012 CT10 NNLO+NNLL [61]
+Pythia-6.428
Single top Powheg-Boxv2 PERUGIA2012 CT10 NNLO+NNLL [62–64]
+Pythia-6.428
ttW¯ /t¯t Z/4-tops MadGraph-2.2.2 A14 NNPDF2.3 [65] NLO
+Pythia-8.186
tt h¯ MadGraph5_aMC@NLO-2.2.1 UEEE5 CT10 NLO [66]
+Herwig++-2.7.1
Dibosons Sherpa-2.1.1 Default CT10 NLO
W W,W Z,Z Z
W/Z+jets Sherpa-2.1.1 Default CT10 NNLO [67]
Table 1: List of generators used for the different background processes. Information is given on the pQCD highest- order accuracy used for the normalisation of the different samples, the underlying event tunes and PDF sets considered.
4 Physics object reconstruction
Interaction vertices from the proton-proton collisions are reconstructed from tracks in the inner detector.
The primary vertex is identified as the one with the largest quadratic sum of transverse momenta from
associated tracks (
P|
p
T,track|2) [68] . The primary vertex is required to be consistent with the beamspot envelope and to consist of at least two tracks with p
T> 0.4 GeV.
Basic selections are applied to define candidates for electrons, muons and jets in the event. An overlap removal procedure is applied to these candidates to prevent double-counting of the objects. Further re- quirements are then made to select the final signal leptons and jets from the remaining objects. The details of the object selections and of the overlap removal procedure are given below.
Candidate jets are reconstructed from three-dimensional topological energy clusters [69] in the calori- meter using the anti-k
Tjet algorithm [70] with a radius parameter of 0.4 (small-R jets). Each topological cluster is calibrated to electromagnetic scale response prior to jet reconstruction. The reconstructed jets are then calibrated to the particle level by the application of a jet energy scale (JES) derived from simula- tion and in situ corrections based on 8 TeV data [71, 72]. Quality criteria are imposed to reject events that contain at least one jet arising from non-collision sources or detector noise [73]. Further selections are applied to reject jets that come from additional pile-up interactions [74]. Candidate jets are required to have p
T> 20 GeV and
|η| < 2.8. Signal jets, selected after resolving overlaps with electrons and muons, are required to pass the stricter requirement of p
T> 30 GeV.
Jets containing b-hadrons (b-jets) are tagged by a multivariate algorithm using information on the impact parameters of inner detector tracks associated to the jet, the presence of displaced secondary vertices, and the reconstructed flight paths of b- and c-hadrons inside the jet [75, 76]. The b-tagging working point with an 85% efficiency, as measured in a simulated sample of t¯ t events, was found to be optimal. The corresponding rejection factors against jets originating from c-quarks and from light quarks and gluons at this working point are 2.6 and 27, respectively.
The candidate small-R jets are used as inputs for further jet re-clustering [20] using the anti-k
Talgorithm with a radius parameter of 1.0. These re-clustered large-R jets are then trimmed [19] with an f
cutpara- meter of 0.05 to remove contributions from pile-up and other soft radiation. The resulting large-R jets are used to tag high-p
Tboosted top quarks in the event. The top-tagged jets are required to have p
T> 300 GeV and to be within
|η|< 2.0. Furthermore, the masses of these jets are required to be above 100 GeV.
Electron candidates are reconstructed from clusters in the electromagnetic calorimeter and inner detector tracks and are required to pass a set of “loose” quality criteria [77–79]. They are also required to lie within the fiducial volume
|η|< 2.47. Muon candidates are reconstructed from matching tracks in the inner detector and in the muon spectrometer. Events containing one or more muon candidates that have a transverse (longitudinal) impact parameter d
0(z
0) with respect to the primary vertex larger than 0.2 mm (1 mm) are rejected to suppress cosmic rays. Muon candidates in the remaining events are required to pass track quality requirements [80] and to be within
|η|< 2.5. All electron and muon candidates must have p
T> 20 GeV and survive the overlap removal procedure. Signal leptons are chosen from the candidates with the following isolation requirement - the scalar sum of p
Tof additional inner detector tracks in a cone around the lepton track is required to be <5% of the lepton p
T. The angular separation between the lepton and the b-jet ensuing in a semileptonic top quark decay will narrow as the p
Tof the top quark increases. This increased collimation is accounted for by varying the radius of the isolation cone as max(0.2, 10 GeV/ p
lepT), where p
lepTis the lepton p
T. Signal electrons are further required to pass
“tight” quality criteria. Electrons (muons) are matched to the primary vertex by requiring the transverse impact parameter (d
0) to satisfy
|σd(d00)|
< 5 (3), and the longitudinal impact parameter (z
0) to satisfy
|
z
0sin θ
|< 0.5 mm.
The overlap removal procedure between muon and jet candidates is designed to remove those muons that are likely to have originated from the decay of hadrons and to retain the overlapping jet. Jets and muons may also appear in close proximity when the jet results from high-p
Tmuon bremsstrahlung, and in such cases the jet should be removed and the muon retained. Such jets are characterised by having very few matching inner detector tracks. Therefore, if the angular distance
∆Rbetween a muon and a jet is within min(0.4, 0.04
+10 GeV
/p
T) of the axis of a jet
4, the muon is removed only if the jet has
≥3 matchinginner detector tracks. On the other hand, if the jet has fewer than three matching tracks, the jet is removed and the muon is kept [81].
Overlap removal between electron and jet candidates aims to remove jets that are formed primarily from the showering of a prompt electron and to remove electrons that are produced in the decay chains of hadrons. Since electron showers within the cone of a jet enter the measured energy of the jet, any overlap between an electron and the jet must be fully resolved. A p
T-dependent cone for the purpose of this overlap removal is thus impractical. Consequently, the closest non-b-tagged jet whose axis is within
∆R
<0.2 of an electron is discarded. If the electron is within
∆R<0.4 of the axis of any jet remaining
after this initial overlap removal procedure, the jet is retained and the electron is removed. Finally, muons and electrons that are within
∆R<0.01 of each other are both removed from the event.
The missing transverse momentum in the event is defined as the magnitude of the negative vector sum p
Tof all selected and calibrated physics objects in the event, with an extra term added to account for soft energy in the event that is not associated to any of the selected objects. This soft term is calculated from inner detector tracks matched to the primary vertex to make it more resilient to pile-up contaminations [82, 83] .
5 Event selections
Signal regions have been designed by optimising the expected signal discovery reach for the 2015 LHC dataset. They are defined based on kinematic requirements on the objects defined in section 4 and on the following event variables.
Two effective mass variables are used. The Gtt signal regions employ the inclusive effective mass m
incleff: m
incleff =Xi
p
Tjeti +Xj
p
T`j +E
missT,
where the first and second sum are over the signal jets and leptons, respectively. The Gbb signal regions are defined using m
4jeff:
m
4jeff =Xi≤4
p
Tjeti +E
Tmiss,
where the sum is over the four highest-p
T(leading) signal jets in the event.
In regions with at least one signal lepton, the transverse mass m
Tof the leading signal lepton (`) and E
Tmissis used to discriminate between the signal and backgrounds from semileptonic t t ¯ and W
+jets events:
m
T = q2p
`TE
missT(1
−cos(
∆φ(E
Tmiss,`)).
4(∆R)= q
(∆η)2+(∆φ)2defines the distance between objects in (η-φ) space.
Leaving resolution e
ffects aside, m
Tis bounded from above by the W boson mass for these backgrounds and typically has higher values for Gtt events. Another useful transverse mass variable is m
b−jetsT,min, the minimum transverse mass between E
Tmissand any of the three leading b-jets in the event:
m
b−jetsT,min =min
i≤3q
2p
Tb−jetiE
Tmiss(1
−cos(
∆φ(ETmiss, b−jet
i))
!
.
It is typically bounded below the top quark mass for semileptonic t t ¯ events while peaking at higher values for Gbb and Gtt events.
The signal regions are defined requiring either zero or at least one lepton. The requirement of a signal lepton, with the additional requirements on jets, E
Tmissand event variables described in Sec 5.1, render the multijet background negligible for the
≥1-lepton signal regions. For the 0-lepton signal regions, the minimum angle between E
Tmissand the leading four small-radius jets in the event,
∆φ4jmin, is required to be greater than 0.4:
∆φ4jmin=
min(
|φjet1−φ
EmissT |, ...,|φjet4−
φ
Emiss T|
) > 0.4,
This requirement ensures that the multijet background, which can produce large E
Tmissif containing poorly measured jets or neutrinos emitted close to the axis of a jet, is also negligible in the 0-lepton signal regions (along with the other requirements on jets, E
Tmissand event variables described in section 5.1).
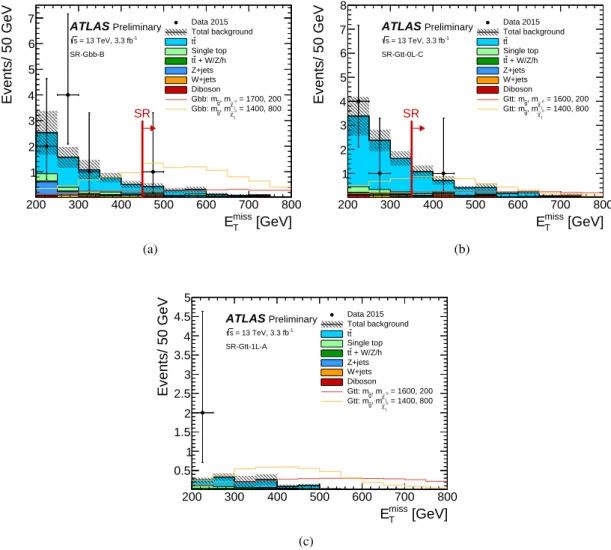
Figure 2 shows the kinematic distributions of a few representative variables after a channel-dependent pre-selection. The pre-selection requires E
Tmiss> 200 GeV and at least three b-tagged jets. The number of b-tagged jets and E
Tmissare shown after pre-selection in the Gbb channel (figure 2(a)-(b)), which also requires four jets,
∆φ4jmin> 0.4 and a candidate lepton veto. The m
b−T,minjetsdistribution and the number of top-tagged large-R jets are shown for the pre-selection in the Gtt 0-lepton channel (figure 2(c)-(d)) requiring in addition at least six jets,
∆φ4jmin> 0.4 and a signal lepton veto. The m
Tand m
incleffdistributions are shown for the pre-selected sample in the Gtt 1-lepton channel (figure 2(e)-(f)), which demands at least one signal lepton and six jets. A good agreement between data and simulation is observed.
5.1 Signal regions
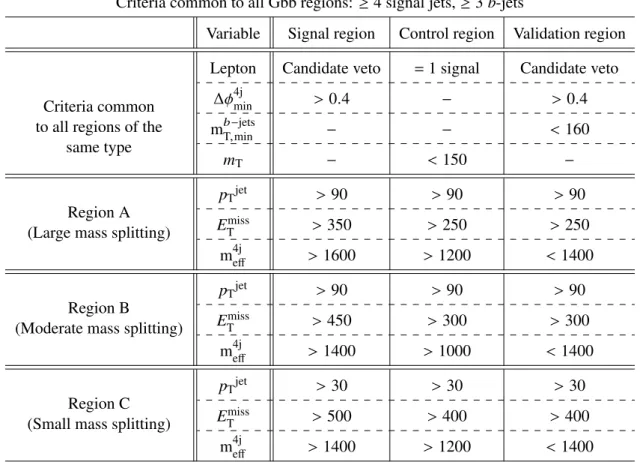
The experimental signature for the Gbb model is characterized by four high-p
Tb-jets, large E
Tmissand no leptons (figure 1(a)). The following requirements are applied to all Gbb signal regions. Events containing a candidate lepton are vetoed and at least four signal small-radius jets are required, of which at least three must be b-tagged. The remaining multijet background is rejected by requiring
∆φ4jmin> 0.4. The Gbb signal regions are described in the leftmost column of table 2. The three signal regions A, B and C are designed to cover Gbb models with large, moderate and small mass splittings between the gluino and the LSP, respectively. All regions feature stringent cuts on E
missT, m
4jeffand on the jet transverse momentum p
Tjet.
The experimental signature for the Gtt model is characterized by several high-p
Tjets of which four are b-jets, large E
Tmissand potentially leptons (figure 1(b)). The Gtt signal regions are classified into regions with a signal lepton veto (0-lepton channel) and regions with at least one signal lepton (1-lepton channel).
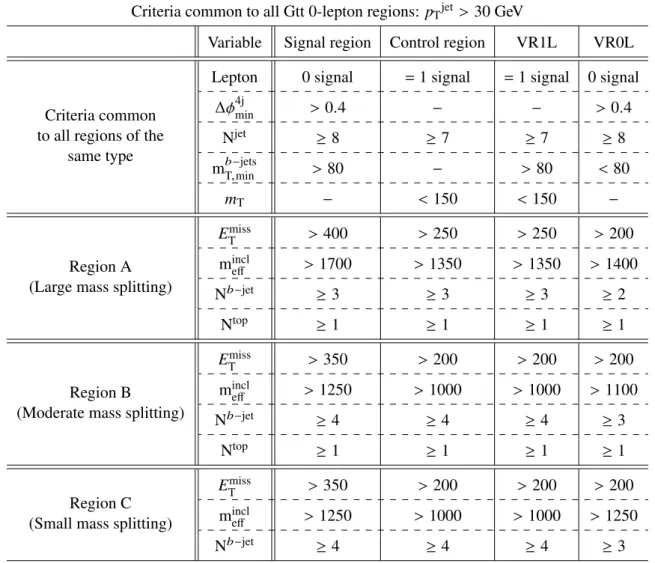
The Gtt 0-lepton signal regions are defined in the leftmost column of table 3. In all Gtt 0-lepton signal
regions at least eight signal jets (p
Tjet> 30 GeV),
∆φ4jmin> 0.4 and m
b−jetsT,min> 80 GeV are required. Three
Gtt 0-lepton signal regions are defined to cover Gtt models with decreasing mass splitting between the
gluino and the LSP: A, B and C. In the large and moderate mass splitting scenarios (regions A and B,
> 30 GeV T Number of b-jets with p
Events
1 10 102
103
104
105
106 ATLAS Preliminary
= 13 TeV, 3.3 fb-1
s Gbb pre-selection
Data 2015 Total background
t t Single top
+ W/Z/h t t Z+jets W+jets Diboson 100)
× σ = 1700, 200 (
0 χ∼1 g, m Gbb: m~
100)
× σ = 1400, 800 (
0 χ∼1
, m
~g Gbb: m
> 30 GeV Number of b-jets with pT
3 4 5 6 7
Data / SM
0 1 2
(a)
[GeV]
miss ET
Events / 50 GeV
1 10 102
103
104
105 ATLAS Preliminary
= 13 TeV, 3.3 fb-1
s Gbb pre-selection
Data 2015 Total background
t t Single top
+ W/Z/h t t Z+jets W+jets Diboson 100)
× σ = 1700, 200 (
0 χ∼1 g, m Gbb: m~
100)
× σ = 1400, 800 (
0 χ∼1
, m g~ Gbb: m
[GeV]
miss
ET
200 300 400 500 600 700 800
Data / SM
0 1 2
(b)
) [GeV]
miss (b-jets,ET min mT
Events / 25 GeV
1 10 102
103
104
105
ATLAS Preliminary = 13 TeV, 3.3 fb-1
s
Gtt 0-lepton pre-selection
Data 2015 Total background
t t Single top
+ W/Z/h t t Z+jets W+jets Diboson 100)
× σ = 1600, 200 (
0 χ∼1 g, m Gtt: m~
100)
× σ = 1400, 800 (
0 1
, mχ∼
g~ Gtt: m
) [GeV]
miss
(b-jets,ET min
mT
0 50 100 150 200 250 300 350 400
Data / SM
0 1 2
(c)
Number of top-tagged jets
Events
1 10 102
103
104
105
106
ATLAS Preliminary = 13 TeV, 3.3 fb-1
s
Gtt 0-lepton pre-selection
Data 2015 Total background
t t Single top
+ W/Z/h t t Z+jets W+jets Diboson 100)
× σ = 1600, 200 (
0 χ∼1 g, m Gtt: m~
100)
× σ = 1400, 800 (
0 1
, mχ∼
g~ Gtt: m
Number of top-tagged jets
0 1 2 3 4
Data / SM
0 1 2
(d)
) [GeV]
miss (lepton,ET mT
Events / 25 GeV
1 10 102
103
104
105
ATLAS Preliminary = 13 TeV, 3.3 fb-1
s
Gtt 1-lepton pre-selection
Data 2015 Total background
t t Single top
+ W/Z/h t t Z+jets W+jets Diboson 100)
× σ = 1600, 200 (
0 χ∼1 g, m Gtt: m~
100)
× σ = 1400, 800 (
0 χ∼1 g, m Gtt: m~
) [GeV]
miss
(lepton,ET
mT
0 50 100 150 200 250 300 350 400
Data / SM
0 1 2
(e)
[GeV]
incl meff
Events / 200 GeV
1 10 102
103
104
105
ATLAS Preliminary = 13 TeV, 3.3 fb-1
s
Gtt 1-lepton pre-selection
Data 2015 Total background
t t Single top
+ W/Z/h t t Z+jets W+jets Diboson 100)
× σ = 1600, 200 (
0 χ∼1 g, m Gtt: m~
100)
× σ = 1400, 800 (
0 χ∼1 g, m Gtt: m~
[GeV]
incl
meff
500 1000 1500 2000 2500 3000
Data / SM
0 1 2
(f)
Figure 2: Distributions of kinematic variables in the pre-selection regions described in the text: (a) number of b-tagged jets and (b) ETmiss for the Gbb pre-selection, (c) mT,minb−jets and (d) the number of top-tagged large-R jets for the Gtt 0-lepton pre-selection, and (e)mTand (f) mincleff for the Gtt 1-lepton pre-selection. The statistical and experimental systematic uncertainties are included in the uncertainty band, where the systematic uncertainties are defined in Sec.6. The lower part of the figure shows the ratio of data to the background prediction. All backgrounds (includingtt) are normalized using the best available theoretical calculation described in Sec.¯ 3. Example signal models with cross-sections enhanced by a factor of 100 are overlaid for comparison.
Criteria common to all Gbb regions:
≥4 signal jets,
≥3 b-jets
Variable Signal region Control region Validation region
Criteria common to all regions of the
same type
Lepton Candidate veto
=1 signal Candidate veto
∆
φ
4jmin> 0.4
−> 0.4
m
b−jetsT,min − −< 160
m
T −< 150
−Region A (Large mass splitting)
p
Tjet> 90 > 90 > 90
E
Tmiss> 350 > 250 > 250
m
4jeff> 1600 > 1200 < 1400
Region B
(Moderate mass splitting)
p
Tjet> 90 > 90 > 90
E
Tmiss> 450 > 300 > 300
m
4jeff> 1400 > 1000 < 1400
Region C (Small mass splitting)
p
Tjet> 30 > 30 > 30
E
Tmiss> 500 > 400 > 400
m
4jeff> 1400 > 1200 < 1400
Table 2: Definitions of the Gbb signal, control and validation regions. The unit of all kinematic variables is GeV.
The jetpTrequirement is also applied tob-jets.
respectively), the top quarks tend to have a large p
T, and at least one top-tagged large-R jet is required (N
top ≥1). The requirements on E
Tmissand m
incleffdecrease with the mass splitting between the gluino and the LSP. However, the required number of b-tagged jets N
b−jetis tightened to four for the lower mass splitting regions B and C in order to maintain a high background rejection despite the softer signal kinematics.
The Gtt 1-lepton signal regions are defined in the leftmost column of table 4. Two signal regions A and B are defined to cover Gtt models with decreasing mass difference between the gluino and the LSP. In all signal regions at least one signal lepton, at least six signal jets (p
Tjet> 30 GeV) and m
T> 150 GeV are required. Region A has the tighter requirements on the m
incleff(m
incleff> 1100 GeV) and the number of top- tagged large-R jets (N
top ≥1). Region B has a softer requirement on m
incleffthan region A, but it features a tighter cut on E
Tmissto achieve a satisfactory background rejection without requiring a top-tagged large-R jet.
5.2 Background estimation and t ¯ t control regions
The largest background in all signal regions is t¯ t produced with additional high- p
Tjets. The other relevant
backgrounds are t¯ tW , t¯ t Z, four top, t t h, single-top, ¯ W
+jets, Z
+jets and diboson events. All of these
Criteria common to all Gtt 0-lepton regions: p
Tjet> 30 GeV
Variable Signal region Control region VR1L VR0L
Criteria common to all regions of the
same type
Lepton 0 signal
=1 signal
=1 signal 0 signal
∆
φ
4jmin> 0.4
− −> 0.4
N
jet ≥8
≥7
≥7
≥8
m
b−jetsT,min> 80
−> 80 < 80
m
T −< 150 < 150
−Region A (Large mass splitting)
E
Tmiss> 400 > 250 > 250 > 200 m
incleff> 1700 > 1350 > 1350 > 1400
N
b−jet ≥3
≥3
≥3
≥2
N
top ≥1
≥1
≥1
≥1
Region B
(Moderate mass splitting)
E
Tmiss> 350 > 200 > 200 > 200 m
incleff> 1250 > 1000 > 1000 > 1100
N
b−jet ≥4
≥4
≥4
≥3
N
top ≥1
≥1
≥1
≥1
Region C (Small mass splitting)
E
Tmiss> 350 > 200 > 200 > 200 m
incleff> 1250 > 1000 > 1000 > 1250
N
b−jet ≥4
≥4
≥4
≥3
Table 3: Definitions of the Gtt 0-lepton signal, control and validation regions. The unit of all kinematic variables is GeV. The jetpTrequirement is also applied tob-jets.
smaller backgrounds are estimated with the simulated samples normalised to the best available theory calculations described in section 3. The multijet background is estimated to be negligible in all regions.
For each signal region, the t¯ t background is normalised in a dedicated control region. The t t ¯ normalisation factor required for the total predicted yield to match the data in the control region is used to normalise the t t ¯ background in the signal region. The control regions are designed to be dominated by t¯ t events and with negligible signal contamination, while being kinematically as close as possible to the corresponding signal region. The latter requirement minimises the systematic uncertainties associated to extrapolating the normalisation factors from the control to the signal regions.
The definitions of the control regions are shown next to the signal regions in tables 2, 3 and 4 for the
Gbb, Gtt 0-lepton and Gtt 1-lepton channels, respectively. In both the Gbb and Gtt 0-lepton channels,
exactly one signal lepton is required. This is motivated by background composition studies using sim-
ulated samples that show that semileptonic t t ¯ events, for which the lepton is out of acceptance or is a
hadronically-decaying tau, dominate the t¯ t yield in the signal regions. An upper cut on m
Tis then applied
to ensure orthogonality with the Gtt 1-lepton signal regions and to suppress signal contamination. The jet
Criteria common to all Gtt 1-lepton regions:
≥1 signal lepton, p
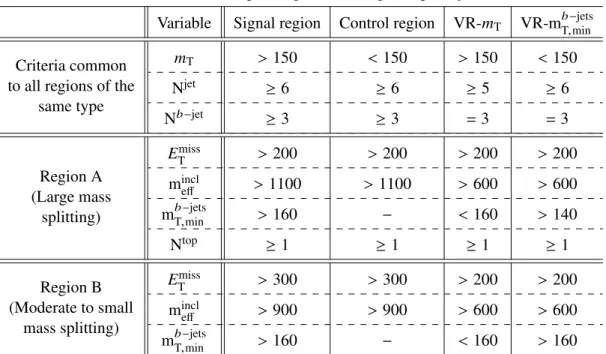
Tjet> 30 GeV Variable Signal region Control region VR-m
TVR-m
b−jetsT,minCriteria common
to all regions of the same type
m
T> 150 < 150 > 150 < 150
N
jet ≥6
≥6
≥5
≥6
N
b−jet ≥3
≥3
=3
=3
Region A (Large mass
splitting)
E
Tmiss> 200 > 200 > 200 > 200 m
incleff> 1100 > 1100 > 600 > 600
m
T,minb−jets> 160
−< 160 > 140
N
top ≥1
≥1
≥1
≥1
Region B (Moderate to small
mass splitting)
E
Tmiss> 300 > 300 > 200 > 200 m
incleff> 900 > 900 > 600 > 600
m
T,minb−jets> 160
−< 160 > 160
Table 4: Definitions of the Gtt 1-lepton signal, control and validation regions. The unit of all kinematic variables is GeV. The jetpTrequirement is also applied tob-jets.
multiplicity requirement has been reduced to seven jets in the Gtt 0-lepton control regions (from eight jets in the signal regions), to increase statistics and to obtain a similar number of jets coming from top quark decay and parton shower as the signal region. Approximately 40-60% of the signal region events contain a hadronically-decaying tau lepton that is counted as a jet. For all Gbb and Gtt 0-lepton control regions, the number of b-jets and top-tagged large-R jets is consistent with the signal region. The requirements on E
Tmissand m
effare however relaxed in the control regions to achieve a su
fficiently large t¯ t yield and small signal contamination (
.15%). The Gtt 1-lepton control regions are defined by inverting the m
Tcut and dropping the m
b−jetsT,minrequirement. All other requirements are exactly the same as for the signal regions.
5.3 Validation regions
Validation regions have been defined to cross-check the background prediction in regions that are kin- ematically close to the signal regions but yet have a small signal contamination. They are designed primarily to cross-check the assumption that the t t ¯ normalisation extracted from the control regions can be accurately extrapolated to the signal regions. Their requirements are shown in the rightmost column(s) of tables 2, 3 and 4 for the Gbb, Gtt 0-lepton and Gtt 1-lepton channels, respectively. Their signal con- tamination is less than approximately 30% for the majority of Gbb and Gtt model points not excluded in Run 1.
One validation region per signal region is defined for the Gbb model. They feature the same requirements
as their corresponding signal region except that upper cuts are applied on m
T,minb−jetsand m
4jeffto reduce signal
contamination and ensure orthogonality with the signal regions. In addition the requirement on E
Tmissis
relaxed to obtain a sufficient t¯ t yield.
For the Gtt 0-lepton channel, two validation regions per signal region are defined, one requiring exactly one signal lepton (VR1L) and one with a signal lepton veto (VR0L). The regions VR1L have exactly the same criteria as their corresponding control regions except that they require m
b−jetsT,min> 80 GeV, similarly to the signal regions, in order to test the extrapolation over m
b−jetsT,minbetween the control and the signal regions. Simulation studies show that the heavy-flavour fraction of the additional jets in the t¯ t
+jets events (i.e. t¯ t
+b b ¯ and t¯ t
+c c), which su ¯
ffers from large theoretical uncertainties, is similar in the signal, control and VR1L regions. This is achieved by requiring the same number of b-jets for all three type of regions.
While the theoretical uncertainties on the heavy-flavour fraction of the additional jets in the t¯ t
+jets events (i.e. t¯ t
+b b ¯ and t¯ t
+c c) are large, they affect signal, control and the 1-lepton validation regions in a similar ¯ way, and are thus largely cancelled out in the semi-data-driven t¯ t normalisation based on the observed control region yields.
The VR0L regions have similar requirements on their corresponding signal regions except that the re- quirements on E
missT, m
incleffand the number of b-jets are loosened to achieve su
fficient event yields. Fur- thermore the criterion m
b−jetsT,min< 80 GeV is applied to all VR0L regions to ensure orthogonality with the signal regions. The regions VR0L test the extrapolation of the t¯ t normalisation from a 1-lepton to a 0- lepton region. Simulation studies show that the VR0L regions have a similar composition of semileptonic t t ¯ events (in particular of hadronically-decaying τ leptons) to the signal regions, while the control and VR1L regions are by construction dominated by semileptonic t t ¯ events with a muon or an electron.
Two requirements are di
fferent between Gtt 1-lepton control regions and their corresponding signal re- gions: the requirement on m
T,minb−jets(absent in the control regions) and the requirement on m
T(inverted in the control regions). Therefore two validation regions per signal region are defined for the Gtt 1-lepton channel, VR-m
Tand VR-m
b−jetsT,min, which respectively test, one at a time, the extrapolations over m
Tand m
T,minb−jets. Exactly three b-jets are required for all 1-lepton validation regions to limit the signal contamina- tion and to be close to the signal regions. For the VR-m
Tregions, the same requirement m
T> 150 GeV as the signal region is applied but the criterion on m
T,minb−jetsis inverted. Other requirements are relaxed to achieve su
fficiently large statistics and small signal contamination. For the VR-m
b−jetsT,minregions, the signal region requirement on m
b−T,minjetsis applied (slightly loosened to 140 GeV instead of 160 GeV in region A) and the criterion on m
Tis inverted. Again, other requirements are generally relaxed. Simulation studies show that t¯ t dilepton events dominate in the signal regions, in particular due to the requirement on m
T, while semileptonic t¯ t events dominate in the control regions. This extrapolation is cross-checked by the VR-m
Tregions which have a similar t t ¯ dileptonic fraction to the signal regions.
The following region nomenclature is used in the remainder of the note. Signal, control and validation region names start with the prefix “SR”, “CR” and “VR”, respectively, and with the type of validation region specified for the Gtt validation regions. The name of the region is completed by the type of model targeted and the letter corresponding to the level of mass splitting between the gluino and the LSP. So for example the validation region that cross-checks the extrapolation over m
Tfor the Gtt 1-lepton region A is denoted as “VR-m
T-Gtt-1L-A”.
6 Systematic uncertainties
The largest sources of detector-related systematic uncertainties in this analysis relate to the jet energy
scale (JES), jet energy resolution (JER) and the b-tagging efficiencies and mistagging rates. The JES
uncertainties are obtained by extrapolating the uncertainties derived from
√s
=8 TeV simulations and in-situ jet calibrations to
√s
=13 TeV [71]. The uncertainties on the energy scale of the small-R jets are propagated to the re-clustered large-R jets which use them as inputs. The JES uncertainties are especially important in the Gtt signal regions, since these regions require high jet multiplicities. The impact of these uncertainties on the expected background yields in these regions is between 10-30%. Uncertainties on the JER have similarly been derived from dijet asymmetry measurements in Run-1 data and extrapolated to
√s
=13 TeV and range between 3% in some Gbb signal regions, to 25% in Gtt 0-lepton regions which require the presence of top-tagged jets.
Uncertainties on the measured b-tagging e
fficiencies and mistagging rates are the subleading sources of experimental uncertainties in the Gtt 1-lepton signal regions and the leading source in the Gtt 0-lepton and Gbb regions. Uncertainties measured in
√s
=8 TeV data are extrapolated to
√s
=13 TeV, with the addition of the new IBL system in Run 2 taken into account. An additional term is also included to extrapolate the measured uncertainties to jet p
Tabove 300 GeV. The impact of the b-tagging uncertainties on the expected background yields in the Gbb and Gtt 0-lepton signal regions is around 20-25%, and around 6-7% in the Gtt 1-lepton signal regions.
The uncertainties associated to lepton reconstruction and energy measurements have very small impacts on the final results. All lepton and jet measurement uncertainties are propagated to the calculation of E
Tmiss, and additional uncertainties are included on the scale and resolution of the soft term. The overall impact of the E
Tmisssoft term uncertainties is also small.
Uncertainties on the modelling of the t¯ t background are evaluated by comparing the nominal sample to additional samples with systematic variations. Hadronisation and parton showering uncertainties are es- timated using a sample generated with Powheg and showered by Herwig++ v2.7.1 [45] with the UEEE5 underlying event tune [54]. Systematic uncertainties on the modelling of initial and final state radiation are explored with two alternative settings of P
owheg, both of which are showered by P
ythiav6.42 as for the nominal sample. The first of these uses the PERUGIA2012radHi tune and has the renormalisation and factorisation scales set to twice the nominal value, resulting in more radiation in the final state. It also has h
dampset to 2m
top. The second sample, with PERUGIA2012radLo tune, has h
damp =m
topand the renormalisation and factorisation scales are set to half of their nominal values, resulting in lower ra- diation in the event. Finally, a t¯ t sample generated using M
adG
raph5_aMC@NLO and showered with H
erwig++v2.7.1 is used to estimate the generator uncertainties. In addition, a 30% uncertainty is as- signed to the cross-section of t¯ t events with additional heavy-flavour jets in the final state. Uncertainties on smaller backgrounds are similarly estimated by comparisons between the nominal sample and samples with di
fferent generators, showering models and radiation tunes. The details on these additional samples with systematic variations are summarised in table 5. An additional 5% uncertainty is included on the cross-section of single top processes, and a 50% flat uncertainty is assigned to each of the t tW, ¯ t¯ t Z and t t h ¯ processes. The variations in the expected background yields due to t¯ t modelling uncertainties range between 10-35% for the Gbb signal regions and between 25-50% for the Gtt signal regions. The impact of the modelling uncertainties for the smaller backgrounds on these yields is less than 10% for most regions.
The uncertainties on the cross-section of signal processes are determined from an envelope of di
fferent
cross-section predictions, as already described in section 3.
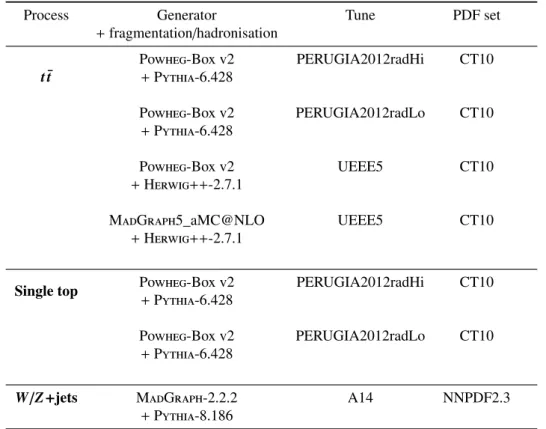
Process Generator Tune PDF set +fragmentation/hadronisation
tt¯
Powheg-Boxv2 PERUGIA2012radHi CT10 +Pythia-6.428
Powheg-Boxv2 PERUGIA2012radLo CT10 +Pythia-6.428
Powheg-Boxv2 UEEE5 CT10
+Herwig++-2.7.1
MadGraph5_aMC@NLO UEEE5 CT10
+Herwig++-2.7.1
Single top Powheg-Boxv2 PERUGIA2012radHi CT10 +Pythia-6.428
Powheg-Boxv2 PERUGIA2012radLo CT10 +Pythia-6.428
W/Z+jets MadGraph-2.2.2 A14 NNPDF2.3
+Pythia-8.186
Table 5: List of simulated samples used to estimate background modelling uncertainties. Information is given about the generators, the underlying event tunes and PDF sets used.
7 Results
The SM background expectation in each signal region is determined with a profile likelihood fit [84], referred to as background-only fit. The fit uses as a constraint the observed event yield in the associated control region to adjust the t¯ t normalisation, assuming that a signal does not contribute to this yield. The numbers of observed and predicted events in each control region are described by Poisson probability density functions. The systematic uncertainties on the expected values are included in the fit as nuisance parameters. They are constrained by Gaussian distributions with widths corresponding to the sizes of the uncertainties and are treated as correlated, when appropriate, between the various regions. The product of the various probability density functions forms the likelihood, which the fit maximises by adjusting the t¯ t normalization and the nuisance parameters. The inputs to the fit for each signal region are the number of events observed in its associated control region and the number of events predicted by simulation in each region for all background processes.
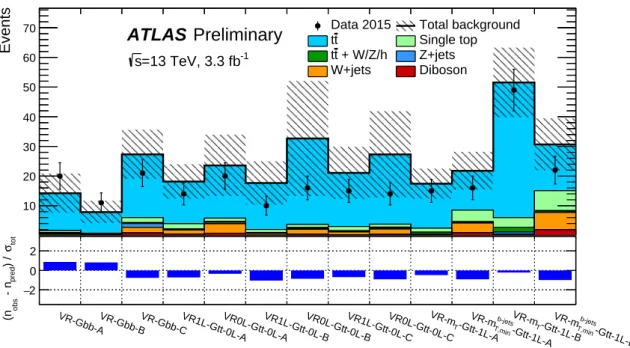
Figure 3 shows the results of the background-only fit to the control regions, extrapolated to the validation regions. The predicted number of events by the background-only fit is compared to the data in the upper panel. The pull, defined by the difference between the predicted background yield and the observed number of events divided by the total uncertainty, is shown for each region in the lower panel. No evidence of significant background mis-modelling is observed in the validation regions.
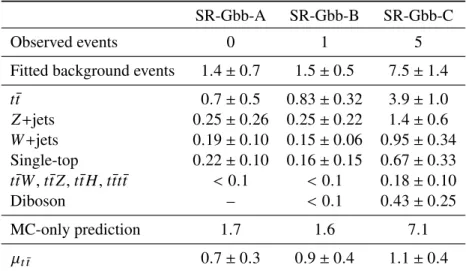
Tables 6 and 7 show the observed number of events and predicted number of background events from the
background-only fit in the Gbb and Gtt signal regions, respectively. The data and predicted background
VR_Gbb_AVR_Gbb_BVR_Gbb_CVR1_Gtt_0l_AVR2_Gtt_0l_AVR1_Gtt_0l_BVR2_Gtt_0l_BVR1_Gtt_0l_CVR2_Gtt_0l_CVR2_Gtt_1l_AVR4_Gtt_1l_AVR2_Gtt_1l_BVR4_Gtt_1l_B
Events
10 20 30 40 50 60
70 Data 2015 Total background
t
t Single top
+ W/Z/h t
t Z+jets
W+jets Diboson
=13 TeV, 3.3 fb-1
s
Preliminary ATLAS
VR-Gbb-AVR-Gbb-BVR-Gbb-CVR1L-Gtt-0L-AVR0L-Gtt-0L-AVR1L-Gtt-0L-BVR0L-Gtt-0L-BVR1L-Gtt-0L-CVR0L-Gtt-0L-C -Gtt-1L-A
T
VR-m
-Gtt-1L-A
b-jets T,min
VR-m T-Gtt-1L-B VR-m
-Gtt-1L-B
b-jets T,min
VR-m
totσ) / pred - n obs(n
−2 0 2
Figure 3: Results of the background-only fit in the validation regions. Thet¯tnormalisation is obtained from the fit to the control regions. The upper panel shows the observed number of events and the predicted background yield.
The lower panel shows the pulls in each validation region.