ATLAS-CONF-2012-083 07July2012
ATLAS NOTE
ATLAS-CONF-2012-083
July 5, 2012
Measurement of the cross section for t ¯t + jets production using a kinematic fit method with the ATLAS detector
The ATLAS Collaboration
Abstract
A measurement of the cross section for t¯t production in association with at least one additional jet in proton-proton collisions at a centre-of-mass energy of 7 TeV is presented.
The data were collected with the ATLAS detector at the CERN Large Hadron Collider.
The analysis is performed in the single-lepton channel, on a data sample corresponding to an integrated luminosity of 4.7 fb
−1. In each channel (e or
µ), two samples of eventsare selected by requiring exactly four or at least five jets with transverse momentum p
T >25 GeV and pseudorapidity
|η| <2.5. These samples together with templates obtained from Monte Carlo simulations, both for signal and background processes, are used to ex- tract the cross sections using a multivariate technique. Two definitions of t¯t events with additional jets (t¯tj events) are considered. In definition 1, particle jets are matched to par- tons (quarks, gluons and photons) originating from top quarks. If at least one particle jet cannot be matched to a parton from a top quark, the event is declared t¯tj. With this def- inition, the cross section for t¯t production with at least one additional jet is found to be
σt¯tj =102
±2 (stat.)
+23−26(syst.) pb, and the ratio of t¯tj to inclusive t¯t production cross sec- tion is found to be
σt¯tj/σinclt¯t =0.54
±0.01(stat.)
+0.05−0.08(syst.). In definition 2, all events with at least five particle jets are termed t¯tj. Measurements of the cross sections in fiducial re- gions defined by event selection criteria in the e+jets and
µ+jets channels are presented forboth t¯tj definitions.
c Copyright 2012 CERN for the benefit of the ATLAS Collaboration.
Reproduction of this article or parts of it is allowed as specified in the CC-BY-3.0 license.
1 Introduction
The large statistics of top-anti-top quark pair (t¯t) events produced at the LHC provides an opportunity to study production of t¯t in association with at least one additional jet (further referred to as t¯tj). A precise description of hard interactions at LHC energies involving top quarks is an important theoretical task. The t¯tj production is also a dominant background to some new physics searches. In addition, a detailed analysis of the t¯tj production characteristics helps to tune the Monte Carlo models which are used to simulate these physics processes at the LHC. The t¯tj cross section has been calculated up to next-to-leading order [1–3].
This note describes a measurement of the t¯tj production cross section carried out in the single- lepton final state using a multivariate technique on a dataset corresponding to an integrated luminosity of 4.7 fb
−1. This is the first t¯tj cross section measurement made at LHC energies. The CDF collaboration performed a similar measurement at the Tevatron [4] with a centre-of-mass energy of 1.96 TeV. At the LHC, ATLAS studied t¯t production with a central jet veto [5].
The strategy of the present analysis is as follows. First, the numbers of t¯t events with exactly 4 jets, and events with 5 or more jets are obtained from the data. This is done using likelihood templates derived from Monte Carlo (MC) simulations of signal and background processes. These results are converted into cross section measurements using a matrix of reconstruction efficiencies in various jet multiplicity bins obtained from the simulations.
2 Definition of additional jets
The definition of t¯tj events used here is based on MC particle jets. Jets are defined using the anti-k
talgorithm [6] with
∆R=0.4
1. Particle jets are built from stable particles, which are defined as those with a mean lifetime
τ >0.3
×10
−10s. Particles from overlaid soft proton-proton interactions (pile-up) are excluded whereas those associated to the underlying event are included. This definition includes muons and neutrinos from decaying hadrons. Jets are required to have transverse momentum p
T >25 GeV and pseudorapidity
|η|<2.5.
The t¯t events are classified into t¯tj and non-t¯tj using one of the two algorithms described below. In definition 1, if there are no partons (quarks, gluons or photons) with p
T >5 GeV originating from a top quark within a distance
∆R <0.4 of a given particle jet, such a jet is tagged as additional. An event is classified as t¯tj if it has at least one such jet. This definition is used in the measurement of the cross section for t¯t production in association with a jet both in the whole phase space (σ
t¯tj) as well as in given fiducial regions (σ
fiducialt¯tj→e+jetsand
σfiducialt¯tj→µ+jets
).
Definition 2 is a model independent t¯tj classification at the particle level similar to the one introduced in [5]. In definition 2, an event is classified as t¯tj if it has at least five particle jets; the t¯tj production cross sections in fiducial regions defined in this way are denoted by
σfiducialt¯tX→e+≥5jets
and
σfiducialt¯tX→µ+≥5jets
.
3 ATLAS detector
The ATLAS detector [7] at the LHC covers nearly the entire solid angle around the collision point.
It consists of an inner tracking detector surrounded by a thin superconducting solenoid, electromagnetic and hadronic calorimeters, and an external muon spectrometer incorporating three large superconducting toroid magnet assemblies.
Data were selected from the 2011 LHC running period, corresponding to a centre-of-mass en- ergy of 7 TeV. Basic data quality requirements were applied, resulting in an integrated luminosity of
1∆R= p
∆φ2+ ∆η2whereφis the azimuthal angle andηis the pseudorapidity.
4.71
±0.18 fb
−1[8]. Events were selected using unprescaled single lepton (electron or muon) triggers.
4 Monte Carlo simulations
The nominal Monte Carlo sample used for the simulation of t¯t events was made using the generator MC@NLO v4.01 [9] with the CT10 [10] parton distribution functions. The parton shower and the underlying event were simulated with HERWIG v6.520 [11] and JIMMY v4.31 [12], respectively, using the AUET2 tune [13]. In order to estimate the model dependence, samples of t¯t events were generated with POWHEG [14] interfaced to PYTHIA v6.4 [15] as well as with ALPGEN v2.13 (including up to three additional partons) [16] interfaced to HERWIG/JIMMY. The ACERMC generator v3.8 [17]
interfaced to PYTHIA was also used to study the effects of initial and final state radiation. All events were passed through a full GEANT4 [18] simulation and then processed with the same program chain as the data. Jet energies were corrected for the calorimeter response and other detector effects using energy- and pseudorapidity-dependent calibration factors derived from simulation and validated using data. Electrons and muons were corrected to reflect the performance observed in the data. MC events were overlaid with additional minimum bias events generated with PYTHIA to simulate the effect of pile-up interactions.
The backgrounds are expected to originate from vector boson production with associated jets (W+jets and Z/γ
∗+jets), single top, diboson (WW, WZ, ZZ), and multijet production. All backgrounds exceptmultijet were simulated with Monte Carlo. The dominant background (vector boson production with associated jets) was simulated using ALPGEN interfaced to HERWIG and JIMMY. The W
+jets normal-ization was derived from a fit to the data as explained in Section 6. The contribution from single top channels was simulated with MC@NLO and normalized to NNLO theoretical cross sections [19–21].
Finally, the diboson production was simulated with HERWIG.
5 Event selection
The present analysis relies on the properties of jets, electrons, muons and missing transverse momentum E
Tmiss. Jets were reconstructed using the anti-k
talgorithm with
∆R =0.4. Jets from additional proton- proton interactions were suppressed by requiring the jet vertex fraction (JVF) to be larger than 0.75. The JVF is defined for tracks matched to the jet as the ratio of the scalar sum of transverse momenta of tracks from the primary vertex to that of all tracks.
Electrons were identified as energy clusters in the electromagnetic calorimeter matched to a recon- structed track in the inner detector and fulfilling additional isolation requirements in both the calorimeter and the inner detector. Electrons were required to have to have p
T >25 GeV and pseudorapidity in the range
|η| <2.47 excluding the region 1.37
< |η| <1.52. Muons were reconstructed using information from the muon spectrometer and the inner tracker. They were required to have transverse momentum p
T >20 GeV and
|η| <2.5. As for electrons, isolation criteria were imposed on muons in both the calorimeter and the inner tracker. E
missTwas calculated from the vectorial energy sum of all topolog- ical clusters in the calorimeter and transverse momenta of reconstructed muons. More details on the reconstruction of objects can be found in [22].
The events were selected using the following criteria:
•
the unprescaled single-electron or single-muon trigger fired;
•
a primary vertex reconstructed from at least five tracks;
•
at least four jets with p
T >25 GeV and
|η|<2.5;
•
exactly one reconstructed lepton (muon or electron) matching the corresponding high level trigger object;
•
in the e+jets channel: E
missT >30 GeV and the transverse mass
2m
T(W)
>30 GeV;
•
in the
µ+jets channel: ETmiss>20 GeV and m
T(W)
+E
Tmiss>60 GeV.
The selected events were further classified into two categories: those with exactly four jets and those with at least five jets.
The multijet background was estimated using one of the two data-driven methods: the matrix method [23]
in the
µ+jets channel, and the jet-electron method [22] in the e+jets channel. The number of events ob-served in data as well as those predicted by the simulations are summarized in Table 1.
Channel t¯t W+jets Z+jets Dibosons Single top Multijet Total expected Data
e+4 jets 10900 12000 2000 188 1010 2500 28000
27599
+1100
−1200 ±
6000
±600
±9
±40
±1200
±6000
e+
≥5 jets 6900 2900 740 37 356 1000 11900
12778
+700
−700 ±
1600
±290
±2
±14
±500
±1800
µ+4 jets
17700 21000 1900 314 1170 4500 47000
47827
+1100
−1200 ±
10000
±600
±15
±50
±2200
±11000
µ+≥
5 jets 11300 5400 590 56 414 1200 19000
20985
+1100
−1200 ±
2900
±230
±3
±17
±600
±3200
Table 1: Expected and observed event yields in different jet multiplicity categories for the electron and muon channels. Uncertainties on the Monte Carlo predictions were calculated according to the variations of the theoretical cross sections for t¯t, single top and diboson production. For W
+jets and Z+jets, theuncertainties expected from Berends scaling [24] are shown. The multijet background has a
±50%
uncertainty. The theoretical uncertainties on t¯t and W
+jets are given for illustration. Their normalisationsare taken from the fit to the data.
6 Analysis
The analysis strategy is as follows. First, using the MC samples, reconstruction efficiencies
εi jare computed as the probabilities of observing a non-t¯tj (i
=0) or t¯tj (i
=1) event in the 4th exclusive ( j
=4) or 5th inclusive ( j
≥5) jet multiplicity bin. Next, the number of t¯t events in each jet multiplicity bin (N
t¯tj) is extracted from the data. Finally, the t¯tj and non-t¯tj production cross sections (denoted
σt¯tjand
σt¯t0, respectively) are obtained from the system of equations
N
4t¯t = Lσt¯t0ε04+Lσt¯tjε14N
5t¯t = Lσt¯t0ε05+Lσt¯tjε15,(1)
where
Lis the integrated luminosity.
For a single channel (e or
µ) the solution of the system is straightforward. For the combination ofthe two channels, the system is overconstrained; in this case the cross sections are determined from a log likelihood fit to the numbers of t¯t events in each jet multiplicity bin for each channel.
2The transverse mass is defined as mT(W)= q
2pℓTpνT(1−cos(φℓ−φν)), whereℓandνrefer to the charged lepton and to the components of missing energy, respectively.
The reconstruction efficiencies
εi jare determined for the two schemes outlined in Section 2 and summarized in Table 2. The efficiencies are higher in the
µ+jets channel than in the e+jets channel dueto differences in the event selection.
ε04 ε05 ε14 ε15
e+jets 2.40 0.40 2.81 2.87
µ+jets
4.21 0.72 4.82 5.03
ε04 ε05 ε14 ε15
e+jets 4.69 1.42 0.53 1.84
µ+jets
8.02 2.11 1.02 3.64
Table 2: Non-t¯tj and t¯tj reconstruction efficiencies (in %) for t¯tj definition 1 (left) and 2 (right).
The number of t¯t events in each jet multiplicity bin for each channel is obtained from the data using a likelihood discriminant template fit. The likelihood discriminant function LHW (likelihood discriminator against W+jets) is constructed using the projective likelihood method defined in the TMVA [25]. In this approach, the likelihood discriminant for event i is defined as the ratio of the signal L
sito the sum of signal and background likelihoods (L
is+L
bi):
LHW
i=L
is(L
is+L
bi) (2)
The signal and background likelihoods are defined as products of the corresponding probability density functions of each kinematic variable used in the likelihood. In the construction of LHW, t¯t (W
+jets)events are considered as the signal (background).
The variables used in the likelihood are the charged lepton pseudorapidity
ηland the transformed aplanarity A
′=exp(
−8A), where the (regular) aplanarity A is defined as A
= 32×λ3,
λ3being the smallest eigenvalue of the normalised momentum tensor. The A
→A
′transformation is done for uniformity as discussed in [26]. The agreement between data and MC for the LHW variables after the fit is shown in Figs. 1 and 2.
After the likelihood discriminant function LHW is constructed, binned distributions (templates) are made for the t¯t signal and each of the backgrounds. These templates are then fitted to the LHW distribu- tion in the data using the negative log likelihood method. The number of t¯t events in each jet multiplicity bin j is obtained by minimizing the quantity
2
Xi
νi j−
n
i j+n
i jln n
i j−n
i jln
νi j,(3)
where the sum is taken over all template histogram bins i, n
i jis the observed number of events, and
νi jis the expected number of events. The latter is defined as
νi j=
p
t¯tjs
i j+p
Wjb
i j+m
i j,(4)
where s
i j, b
i j, and m
i jare the predicted numbers of events for the t¯t signal, W+jets, and small back- grounds (Z+jets, single top, dibosons, and multijet), respectively, and p
t¯tj, p
Wjare the parameters of the fit. The resulting value of the fit parameter p
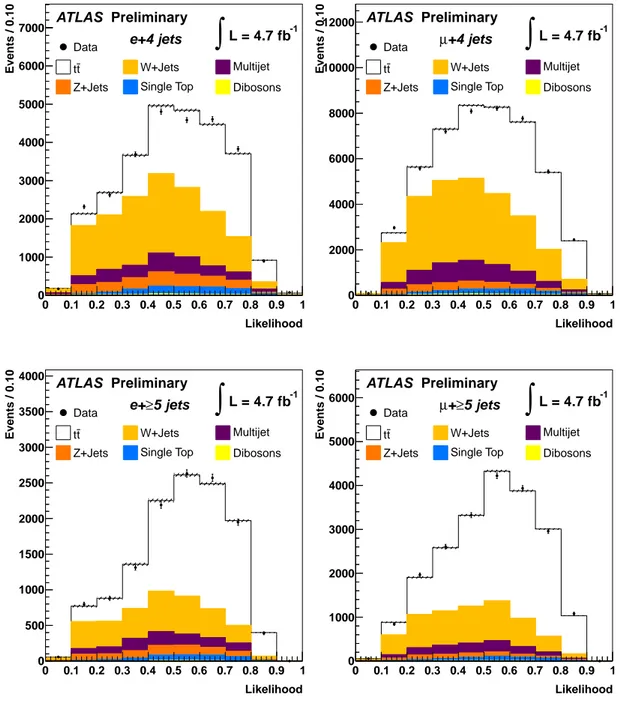
t¯tjis used to extract the number of t¯t events in each jet multiplicity bin from the data. The LHW fits to the data in the 4th exclusive and the 5th inclusive jet multiplicity bins in both electron and muon channels are shown in Fig. 3. The results of the fit are summarized in Table 3.
The t¯tj production cross section as per t¯tj definition 1 is found to be
σt¯tj =102
±2(stat.) pb.
exp(-8A) 0 0.2 0.4 0.6 0.8 1 1.2 1.4
Events / 0.05
0 500 1000 1500 2000 2500 3000 3500 4000
e+4 jets ATLAS Preliminary
L = 4.7 fb-1
∫
Data t
t W+Jets Multijet
Z+Jets Single Top Dibosons
η lepton
-4 -3 -2 -1 0 1 2 3 4
Events / 0.25
0 500 1000 1500 2000 2500
3000 e+4 jets
ATLAS Preliminary
L = 4.7 fb-1
∫
Data t
t W+Jets Multijet
Z+Jets Single Top Dibosons
exp(-8A) 0 0.2 0.4 0.6 0.8 1 1.2 1.4
Events / 0.05
0 200 400 600 800 1000 1200 1400 1600
1800 e+≥5 jets ATLAS Preliminary
L = 4.7 fb-1
∫
Data t
t W+Jets Multijet
Z+Jets Single Top Dibosons
η lepton
-4 -3 -2 -1 0 1 2 3 4
Events / 0.25
0 200 400 600 800 1000 1200 1400
1600 e+≥5 jets ATLAS Preliminary
L = 4.7 fb-1
∫
Data t
t W+Jets Multijet
Z+Jets Single Top Dibosons
Figure 1: Transformed aplanarity (left) and electron pseudorapidity (right) distributions in the e+jets
channel. The distributions in the data (dots) are compared to the MC simulations, which include both
signal and background processes. The hatched bands display the MC statistical uncertainty.
exp(-8A) 0 0.2 0.4 0.6 0.8 1 1.2 1.4
Events / 0.05
0 1000 2000 3000 4000 5000 6000
7000 µ+4 jets
ATLAS Preliminary
L = 4.7 fb-1
∫
Data t
t W+Jets Multijet
Z+Jets Single Top Dibosons
η lepton
-4 -3 -2 -1 0 1 2 3 4
Events / 0.25
0 500 1000 1500 2000 2500 3000 3500 4000 4500
+4 jets µ ATLAS Preliminary
L = 4.7 fb-1
∫
Data t
t W+Jets Multijet
Z+Jets Single Top Dibosons
exp(-8A) 0 0.2 0.4 0.6 0.8 1 1.2 1.4
Events / 0.05
0 500 1000 1500 2000 2500 3000
5 jets
≥ µ+
ATLAS Preliminary
L = 4.7 fb-1
∫
Data t
t W+Jets Multijet
Z+Jets Single Top Dibosons
η lepton
-4 -3 -2 -1 0 1 2 3 4
Events / 0.25
0 200 400 600 800 1000 1200 1400 1600 1800 2000 2200
5 jets
≥ µ+ ATLAS Preliminary
L = 4.7 fb-1
∫
Data t
t W+Jets Multijet
Z+Jets Single Top Dibosons
Figure 2: Transformed aplanarity (left) and muon pseudorapidity (right) distributions in the
µ+jets chan-nel. The measured distributions (dots) are compared to the MC simulations, which include both signal
and background processes. The hatched bands display the MC statistical uncertainty.
Likelihood 0 0.1 0.2 0.3 0.4 0.5 0.6 0.7 0.8 0.9 1
Events / 0.10
0 1000 2000 3000 4000 5000 6000
7000 e+4 jets
ATLAS Preliminary
L = 4.7 fb-1
∫
Data t
t W+Jets Multijet
Z+Jets Single Top Dibosons
Likelihood 0 0.1 0.2 0.3 0.4 0.5 0.6 0.7 0.8 0.9 1
Events / 0.10
0 2000 4000 6000 8000 10000 12000
+4 jets µ ATLAS Preliminary
L = 4.7 fb-1
∫
Data t
t W+Jets Multijet
Z+Jets Single Top Dibosons
Likelihood 0 0.1 0.2 0.3 0.4 0.5 0.6 0.7 0.8 0.9 1
Events / 0.10
0 500 1000 1500 2000 2500 3000 3500 4000
5 jets
≥ e+
ATLAS Preliminary
L = 4.7 fb-1
∫
Data t
t W+Jets Multijet
Z+Jets Single Top Dibosons
Likelihood 0 0.1 0.2 0.3 0.4 0.5 0.6 0.7 0.8 0.9 1
Events / 0.10
0 1000 2000 3000 4000 5000
6000 µ+≥5 jets ATLAS Preliminary
L = 4.7 fb-1
∫
Data t
t W+Jets Multijet
Z+Jets Single Top Dibosons
Figure 3: Likelihood LHW distributions in the e+jets (left) and
µ+jets (right) channels. The distribu-tions in the data (dots) are compared to the MC simulations, which include both signal and background
processes. The t¯t and W
+jets distributions are fitted to the data. The hatched bands display the MCstatistical uncertainty.
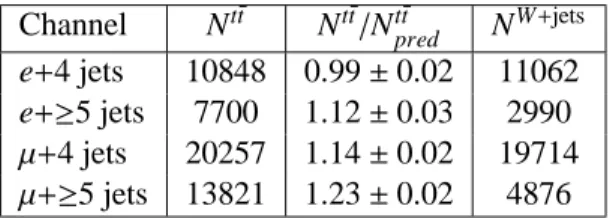
Channel N
t¯tN
t¯t/Nt¯tpredN
W+jetse+4 jets 10848 0.99
±0.02 11062 e+
≥5 jets 7700 1.12
±0.03 2990
µ+4 jets
20257 1.14
±0.02 19714
µ+≥
5 jets 13821 1.23
±0.02 4876
Table 3: Fitted numbers of t¯t events N
t¯t, the observed to predicted event ratios N
t¯t/Nt¯tpred, and W
+jetsevents N
W+jetsin the electron and muon channels in the 4th exclusive and 5th inclusive jet multiplicity bins. The uncertainties are statistical only.
The total cross section for t¯t production is found by minimizing the sum of (3) over both electron and muon channels and jet multiplicity bins. The result
σinclt¯t =189
±4 (stat.) pb is in a good agreement with the previous ATLAS measurement [27] performed on 0.7 fb
−1of data using profile likelihood. The present analysis uses seven times more statistics, and the methods used in the two analyses are quite different, so the systematic uncertainties are not strongly correlated.
The ratio of t¯tj to inclusive t¯t production cross section is
σt¯tj/σinclt¯t =0.54
±0.01(stat.).
The cross sections for t¯tj production in fiducial regions are also measured in each channel. The definitions of the fiducial regions are based on particle-level objects as described in Section 2. Jets with p
T >25 GeV and
|η| <2.5 are selected. Muons (electrons) are required to have p
T >20(25) GeV and
|η|<
2.5 and to be isolated, the distance
∆R between the muon (electron) and any particle jet being largerthan 0.4. To mimic the experimental selection, the following criteria are applied: E
Tmiss,part >30 GeV and m
partT(W)
>30 GeV in the e+jets channel and E
miss,partT >20 GeV and E
Tmiss,part+m
partT(W)
>60 GeV in the
µ+jets channel, where Emiss,partTand m
partT(W) are defined using the total momentum of all neutrinos originating from W bosons and that of the charged lepton. Finally, events with exactly one charged lepton (e or
µ) and at least five particle jets are considered to be in the fiducial region. The definitions ofthe fiducial region for the e+jets and
µ+jets channels are chosen differently to reflect the correspondingexperimental selections. As a consequence, the cross sections in fiducial regions for electrons and muons cannot be compared directly. The cross sections in fiducial regions for t¯tj production according to t¯tj definition 1 are measured to be
σfiducial
t¯tj→e+jets =
2.59
±0.09(stat.) pb, and
σfiducialt¯tj→µ+jets=
3.48
±0.08(stat.) pb, and according to t¯tj definition 2,
σfiducialt¯tX
→e+≥5jets =
4.09
±0.18(stat.) pb, and
σfiducialt¯tX→µ+≥5jets =
5.27
±0.16(stat.) pb.
7 Systematic uncertainties
The systematic uncertainties relevant to this analysis fall into several categories. The dominant uncer- tainty in the cross section measurements arises from the comparison of the results obtained with different MC generators; the largest difference in the results obtained using MC@NLO, POWHEG and ALPGEN is taken and amounts to 21% for the total t¯tj cross section, 8(10)% for
σfiducialt¯tj→e(µ)+jets
, and 13(18)% for
σfiducialt¯tX
→e(µ)+≥5jets
.
The uncertainty due to MC modelling of the signal originates mostly from the difference in the event
selection efficiencies in different generators, while the numbers of t¯t events obtained with different MC
templates vary at most by 8% .
The instrumental systematic uncertainties are related to the reconstruction of jets (jet energy scale, jet energy resolution, soft jet uncertainties in E
missTcalculations), and leptons (momentum/energy scale and resolution, trigger scale factor, reconstruction and lepton identification efficiency). All of these uncertainties are evaluated by performing ensemble tests using modified likelihood templates for signal and background. In this category the dominant contribution (12–14%) comes from the jet energy scale and resolution. Most of this uncertainty is due to variation of the acceptance since the change in shape of the template is small.
For the multijet contribution, a 50% uncertatinty on its rate is assigned. This results in a systematic uncertainty of 1–2% on
σt¯tj. In addition, the cross sections in the e+jets channel have a systematic uncertainty of 6% due to the variation of the shape in the modelling of the multijet contribution.
The systematic uncertainty due to single top, dibosons, and Z+jets production is evaluated by varying their event rates [23]. The effect on the t¯tj cross section is small (<1%).
The uncertainty due to the modelling of ISR/FSR is estimated separately using the ACERMC gen- erator interfaced with PYTHIA and varying the parameters controlling ISR/FSR by a factor two up and down.
The systematic uncertainties related to the modelling of W+jets, parton distribution functions and pile-up interactions are found to be small (<1%). For the measurements using t¯tj definition 1, the dif- ference between the results obtained using the baseline p
Tthreshold on the partons (5 GeV) and its variations by a factor two up and down is taken as an additional systematic uncertainty. The resulting uncertainty on the measured cross sections is 1–2%.
The systematic uncertainties on the ratio of
σt¯tjto
σinclt¯tare partially cancelled. The largest systematic uncertainty for the ratio measurement is related to jet reconstruction and energy calibration and is found to be 12%. The next largest uncertainty of 8.5% is due to Monte Carlo modelling of t¯t events. It is followed by 3% uncertainty on ISR/FSR and by 2.5% due to the variation of the shape in the modelling of the multijet contribution.
8 Summary of results
Measurements of cross sections for t¯tj production in pp collisions at
√s
=7 TeV using the ATLAS detector at the Large Hadron Collider are presented using an integrated luminosity of 4.7 fb
−1. Two different definitions of t¯tj events are considered. The cross section for t¯t production in association with at least one additional jet with p
T >25 GeV and
|η|<2.5 according to definition 1 is measured to be
σt¯tj=
102
±2(stat.)
+23−26(syst.) pb.
The largest systematic uncertainties in this measurement are due to jet energy scale, jet energy resolution, and MC modelling of the signal.
The cross sections in fiducial regions for t¯tj production in the e+jets and
µ+jets channels for the twodefinitions are measured to be
σfiducialt¯tj→e+jets =
2.59
±0.09(stat.)
+0.26−0.46(syst.) pb,
σfiducialt¯tj→µ+jets =
3.48
±0.08(stat.)
+0.43−0.61(syst.) pb,
σfiducialt¯tX→e+≥5jets =
4.09
±0.18(stat.)
+0.62−0.85(syst.) pb,
σfiducialt¯tX→µ+≥5jets =5.27
±0.16(stat.)
+1.04−1.20(syst.) pb.
The largest systematic uncertainties in these measurements are also due to jet energy scale, jet energy res-
olution, and MC modelling of the signal. As the two t¯tj definitions (t¯tj
→ℓ+jets and t¯tX
→ℓ+≥5 jets)
are different, those results cannot be directly compared to each other.
The large systematic uncertainties partially cancel in the measurement of the
σt¯tj/σinclt¯tratio. It is found to be
σt¯tj/σinclt¯t =
0.54
±0.01(stat.)
+0.05−0.08(syst.)
These results can be used to test state-of-the-art perturbative QCD calculations of jet activity in t¯t production at high energies. Furthermore, these results have the potential to help tuning the simulations of these processes so as to improve the precision with which observables related to top quarks can be measured.
References
[1] S. Dittmaier, P. Uwer, and S. Weinzierl, Hadronic top-quark pair production in association with a hard jet at next-to-leading order QCD: Phenomenological studies for the Tevatron and the LHC arXiv, 0810.0452[hep-ph, ], Eur.Phys.J. C59 (2009), 625–646.
[2] A. Kardos, C. Papadopoulos, and Z. Trocsanyi, Top quark pair production in association with a jet with NLO parton showering arXiv, 1101.2672[hep-ph, ], Phys.Lett. B705 (2011), 76–81.
[3] K. Melnikov, A. Scharf, and M. Schulze, Top quark pair production in association with a jet:
QCD corrections and jet radiation in top quark decays arXiv, 1111.4991[hep-ph, ], Phys.Rev. D85 (2012), 054002.
[4] CDF Collaboration, Measurement of the t-tbar
+jet Cross Section with 4.1 fb
−1, CDF Note 9850, 2009, http://www-cdf.fnal.gov/physics/new/top/2009/xsection/ttj 4.1invfb/.
[5] ATLAS Collaboration, Measurement of t¯t production with a veto on additional central jet activity in pp collisions at sqrt(s)
=7 TeV using the ATLAS detector arXiv, 1203.5015[hep-ex, ], (2012).
[6] M. Cacciari, G. P. Salam, and G. Soyez, The anti-kT jet clustering algorithm arXiv, 0802.1189[hep- ph, ], JHEP 04 (2008), 063.
[7] ATLAS Collaboration, The ATLAS Experiment at the CERN Large Hadron Collider, JINST 3 (2008), S08003.
[8] ATLAS Collaboration, Luminosity Determination in pp Collisions at
√s
=7 TeV using the ATLAS Detector in 2011, ATLAS-CONF-2011-116, (2011), https://cdsweb.cern.ch/record/1376384/files/ATLAS-CONF-2011-116.pdf.
[9] S. Frixione and B.R. Webber, Matching NLO QCD computations and parton shower simulations, hep-ph/0204244, JHEP 0206 (2002), 029.
[10] H.-L. Lai et al., New parton distributions for collider physics arXiv, 1007.2241[hep-ph, ], Phys.Rev.
D82 (2010), 074024.
[11] G. Corcella et al., HERWIG 6: An Event generator for hadron emission reactions with interfering gluons (including supersymmetric processes), hep-ph/0011363, JHEP 0101 (2001), 010.
[12] J. M. Butterworth, J. R. Forshaw, and M. H. Seymour, Multiparton interactions in photoproduction at HERA arXiv, hep-ph/9601371, Z. Phys. C72 (1996), 637–646.
[13] ATLAS Collaboration, New ATLAS event generator tunes to 2010 data, ATL-PHYS-PUB-2011-
008, 2010.
[14] S. Frixione, P. Nason and C. Oleari, Matching NLO QCD computations with Parton Shower simu- lations: the POWHEG method, arXiv:0709.2092[hep-ph], JHEP 0711 (2007), 070.
[15] T. Sjostrand and S. Mrenna and P.Z. Skands, PYTHIA 6.4 Physics and Manual, hep-ph/0603175, JHEP 05 (2006), 026.
[16] M.L. Mangano et al., ALPGEN, a generator for hard multiparton processes in hadronic collisions, hep-ex/0206293, JHEP 0307 (2003), 001.
[17] B.P. Kersevan and E. Richter-Wa¸s, The Monte Carlo event generator AcerMC version 2.0 with interfaces to PYTHIA 6.2 and HERWIG 6.5, hep-ph/0405247, (2004).
[18] S. Agostinelli et al., GEANT4 - A Simulation Toolkit, Nucl. Instr. and Meth. A506 (2003), 250.
[19] N. Kidonakis, Next-to-next-to-leading-order collinear and soft gluon corrections for t-channel sin- gle top quark production arXiv, 1103.2792[hep-ph, ], Phys.Rev. D83 (2011), 091503.
[20] N. Kidonakis, NNLL resummation for s-channel single top quark production arXiv, 1001.5034[hep- ph, ], Phys.Rev. D81 (2010), 054028.
[21] N. Kidonakis, Two-loop soft anomalous dimensions for single top quark associated production with a W- or H- arXiv, 1005.4451[hep-ph, ], Phys.Rev. D82 (2010), 054018.
[22] ATLAS Collaboration, Measurement of the t-channel single top-quark and top-antiquark produc- tion cross-sections and their ratio in pp collisions at
√s
=7 TeV, ATLAS-CONF-2012-056, (2012), https://cdsweb.cern.ch/record/1453783/files/ATLAS-CONF-2012-056.pdf.
[23] ATLAS Collaboration, Measurement of the top quark-pair production cross section with ATLAS in pp collisions at
√s
=7 TeV arXiv, 1012.1792[hep-ex, ], Eur. Phys. J. C71 (2011), 1577.
[24] F. A. Berends, H. Kuijf, B. Tausk, and W. Giele, On the production of a W and jets at hadron colliders, Nucl.Phys. B357 (1991), 32–64.
[25] A. H ¨ocker et al., TMVA: Toolkit for multivariate data analysis arXiv, physics/0703039, PoS ACAT (2007), 040.
[26] ATLAS Collaboration, Top Quark Pair Production Cross-section Measurement in ATLAS in the Single Lepton
+Jets Channel without b-tagging, ATLAS-CONF-2011-023, (2011), https://cdsweb.cern.ch/record/1336753/files/ATLAS-CONF-2011-023.pdf.
[27] ATLAS Collaboration, Measurement of the ttbar production cross-section in pp collisions at
√s
=