ATLAS-CONF-2016-003 14/03/2016
ATLAS NOTE
ATLAS-CONF-2016-003
14th March 2016
Measurement of the t ¯ t Z and t ¯ tW production cross sections in multilepton final states using 3.2 fb
−1of pp collisions
at 13 TeV at the LHC
The ATLAS Collaboration
Abstract
A measurement of thet¯tZ andt¯tWproduction cross sections in final states with either two same-charge muons, or three or four leptons (electrons or muons) is presented. The analysis uses a data sample of proton–proton collisions at √
s = 13 TeV recorded with the ATLAS detector at the Large Hadron Collider in 2015 corresponding to a total integrated luminosity of 3.2 fb−1. The inclusive cross sections are extracted using likelihood fits to signal and control regions, resulting inσttZ¯ = 0.9±0.3 pb andσt¯tW = 1.4±0.8 pb, in agreement with the Standard Model predictions.
c
2016 CERN for the benefit of the ATLAS Collaboration.
Reproduction of this article or parts of it is allowed as specified in the CC-BY-4.0 license.
1 Introduction
At the Large Hadron Collider (LHC), top quarks are copiously produced in quark-antiquark pairs (t¯t) and this process has been extensively studied at 7 and 8 TeV, and recently at 13 TeV [1] centre-of-mass energy.
Measurements of the associated production oft¯twith aZboson (t¯tZ) allow to extract information on the neutral current coupling of the top quark. The production rate of a top-quark pair with a massive vector boson could be altered in the presence of physics beyond the Standard Model (SM), such as vector-like quarks, strongly coupled Higgs bosons or technicolor, and therefore the measurements ofσt¯tZ andσt¯tW
are important checks for the validity of the SM at this new energy regime. Thet¯tZ andt¯tW processes have been established by ATLAS [2] and CMS [3] using the Run-1 dataset at √
s=8 TeV, with measured cross sections compatible with the SM prediction and uncertainties of∼30%. At √
s = 13 TeV, the SM cross sections of thet¯tZ andt¯tW processes increase by factors of 3.5 and 2.4, respectively, compared to √
s = 8 TeV. The cross sections, computed at next-to-leading order (NLO) QCD precision, using MadGraph5_aMC@NLO [4] (referred to in the following as MG5_aMC), areσt¯tZ =0.76 pb andσt¯tW = 0.57 pb with an uncertainty of 11%, primarily due to higher order corrections which are estimated by varying the renormalisation and factorisation scales.
This note presents measurements of thet¯tZ andt¯tW cross sections using 3.2 fb−1of proton–proton (pp) collision data at √
s= 13 TeV collected by the ATLAS detector. The decays of the top quarks,W, andZ bosons can produce between zero and four isolated, prompt leptons1. Decay modes with two same-sign charged muons, or three and four leptons are considered in this analysis. Table1lists the analysis channels and the targeted decay modes of thet¯tZandt¯tW processes. Each channel is divided in multiple analysis regions in order to enhance the sensitivity to the signal. Simultaneous fits are performed to the signal regions and selected control regions in order to extract the cross sections fort¯tZ andt¯tW production.
Additional validation regions are defined to check the agreement of the background estimation with data and are not used in the fit.
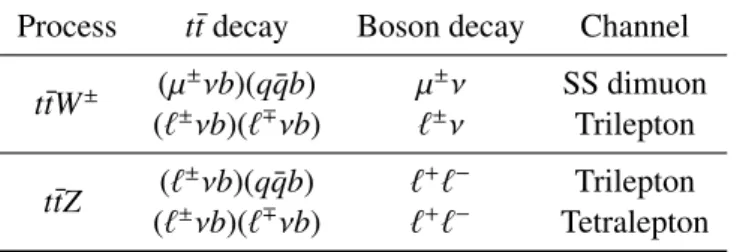
Table 1: List ofttW¯ andttZ¯ decay modes and analysis channels targeting them.
Process t¯tdecay Boson decay Channel
t¯tW± (µ±νb)(qqb)¯ µ±ν SS dimuon
(`±νb)(`∓νb) `±ν Trilepton
t¯tZ (`±νb)(qqb)¯ `+`− Trilepton
(`±νb)(`∓νb) `+`− Tetralepton
2 The ATLAS detector
The ATLAS detector [5] consists of four main subsystems: an inner tracking system, electromagnetic (EM) and hadronic calorimeters, and a muon spectrometer. The inner detector consists of a high-granu- larity silicon pixel detector, including the newly-installed Insertable B-layer [6] which is the innermost layer of the tracking system, and a silicon microstrip tracker, together providing precision tracking in the
1In this note, lepton is used to denote electron or muon, and prompt lepton is used to denote a lepton produced inW,Zor τ-lepton decays.
pseudorapidity2range|η| <2.5 and of a transition radiation tracker covering|η|<2.0, all immersed in a 2 T magnetic field provided by a superconducting solenoid. The EM sampling calorimeter uses lead and liquid argon (LAr) and is divided into barrel (|η|<1.475) and endcap (1.375<|η|<3.2) regions. Hadron calorimetry is provided by a steel/scintillator-tile calorimeter, segmented into three barrel structures, in the range|η|<1.7, and by two copper/LAr hadronic endcap calorimeters that cover the region 1.5<|η|<3.2.
The solid angle coverage is completed with forward copper/LAr and tungsten/LAr calorimeter modules, optimised for EM and hadronic measurements respectively, covering the region 3.1 < |η| < 4.9. The muon spectrometer measures the deflection of muon tracks in the range|η| < 2.7 using multiple layers of high-precision tracking chambers located in toroidal magnetic fields of approximately 0.5 T and 1 T in the central and endcap regions of ATLAS, respectively. The muon spectrometer is also instrumented with separate trigger chambers covering|η| < 2.4. A two-level trigger system, using custom hardware followed by a software-based level, is used to reduce the event rate to a maximum of around 1 kHz for offline storage.
3 Data and simulated event samples
The data were collected with the ATLAS detector during 2015 with a bunch spacing of 25 ns, and a mean number of 14ppinteractions per bunch crossing (pileup). After the application of beam, detector and strict data quality requirements, the integrated luminosity considered corresponds to 3.2 fb−1with an uncertainty of 5%.
Monte-Carlo simulation samples (MC) are used to model the expected signal and background distribu- tions in the different control, validation and signal regions described below. The heavy flavour decays involvingbandcquarks, particularly important to this measurement, are modelled using the EvtGen[7]
program, except for processes modelled using the Sherpagenerator. In all samples the top-quark mass is set to 172.5 GeV and the Higgs boson mass is set to 125 GeV. The response of the detector to stable3 particles is emulated by a dedicated simulation [8] based either fully on Geant[9] or on a faster para- meterisation [10] for the calorimeter response and Geantfor everything else. To account for additional ppinteractions from the same and close-by bunch crossings, a set of minimum-bias interactions gener- ated using Pythia8 [11] with the A2 [12] tune is superimposed to the hard scattering events. In order to reproduce the same pileup levels present in the data, the distribution of the number of additional pp interactions in the MC samples is reweighted to match the one in the data. All samples are processed through the same reconstruction software as the data. Simulated events are corrected so that the object identification, reconstruction and trigger efficiencies, energy scales and energy resolutions match those determined from data control samples.
The associated production of a top-quark pair with one or two vector bosons is generated at leading order (LO) with MG5_aMC interfaced to Pythia8, with up to two (t¯tW), one (t¯tZ) or no (t¯tWW) extra partons included in the matrix elements. Theγ?contribution and theZ/γ? interference are included in thet¯tZsamples. TheA14tune [13] is used together with theNNPDF2.3LOPDF set [14]. The samples are normalised to their cross sections at NLO in QCD using appropriatek-factors [15].
2ATLAS uses a right-handed coordinate system with its origin at the nominal interaction point (IP) in the centre of the detector and thez-axis coinciding with the axis of the beam pipe. Thex-axis points from the IP to the centre of the LHC ring, and they-axis points upward. Cylindrical coordinates (r,φ) are used in the transverse plane,φbeing the azimuthal angle around the beam pipe. The pseudorapidity is defined in terms of the polar angleθasη=−ln tan(θ/2). The rapidity is defined as y=0.5 ln[(E+pz)/(E−pz)] whereEdenotes the energy andpzis the component of the momentum along the beam direction.
3A particle is considered stable ifcτ≥1 cm.
The t-channel production of a single top quark in association with a Z boson (tZ) is generated using MG5_aMC interfaced with Pythia6 [16] with the CTEQ6L1 PDF [17] set and the Perugia2012[18]
tune at NLO in QCD. The Z/γ? interference is included, and the four-flavour scheme is used in the computation.
The Wt channel production of a single top quark together with a Z boson (tWZ) is generated with MG5_aMC and showered with Pythia8, using theNNPDF3.0NLOPDF set and theA14tune. The gener- ation is performed at NLO in QCD using the five-flavour scheme. Diagrams containing a top-quark pair are removed to avoid interference with thet¯tZprocess.
Diboson processes with four charged leptons (4`), three charged leptons and one neutrino (```ν) or two charged leptons and two neutrinos (``νν) are simulated using the Sherpa2.1 generator [19]. Mat- rix elements include all diagrams with four electroweak vertices. They are calculated for up to one (4`, ``νν) or no additional partons (```ν) at NLO and up to three partons at LO using the Comix [20]
and OpenLoops [21] matrix element generators and merged with the Sherpa parton shower using the ME+PS@NLO prescription [22]. The CT10 PDF set is used in conjunction with a dedicated parton shower tuning developed by the Sherpaauthors. The NLO cross sections calculated by the generator are used to normalise diboson processes. Alternative diboson samples are simulated using the Powheg-Box v2 [23] generator, interfaced to the Pythia8 parton shower model, and for which theCT10nloset is used in the matrix element, while theCTEQ6L1PDF set is used for the parton shower along with theAZNLO[24]
tune.
The production of three massive vector bosons with subsequent leptonic decays of all three bosons is modelled at LO with the Sherpa2.1 generator and theCT10PDF set. Up to two additional partons are included in the matrix element at LO and the full NLO accuracy is used for the inclusive process.
The samples for the gauge-invariant set of electroweak processes involving the vector boson scattering (VBS) diagram and producing two same-sign leptons, two neutrinos and two partons are modelled using Sherpa2.1 at LO accuracy and theCT10PDF set. Processes of orders four and six in the electroweak coupling constant are considered, and up to one additional parton is included in the matrix element.
For the generation oft¯tevents andWt channel single top-quark events the Powheg-Boxv2 generator is used with theCT10PDF set. The parton shower, fragmentation, and the underlying event are simulated using Pythia6 with theCTEQ6L1PDF set and the correspondingPerugia2012tune. Thet¯tsamples are normalised to their next-to-next-to-leading order (NNLO) prediction, including soft-gluon resummation to next-to-next-to-leading-log order, as calculated with theTop++2.0program (see [25] and references therein). For more efficient sample generation thet¯tsample is produced by selecting only true dilepton events in the final state. Moreover, an additional dileptont¯tsample requiring ab-hadron not coming from top-quark decays is generated afterb-jet selection. Diagram removal is employed to remove the overlap betweent¯tandWt.
Samples oft¯tH are generated using NLO matrix elements in MG5_aMC with theCT10NLOPDF set and interfaced with Herwig++[26] for the modelling of the parton shower. Higgs boson production via gluon fusion and vector boson fusion is generated using the Powheg-Box v2 generator withCT10 PDF. The parton shower, fragmentation, and underlying event are simulated using Pythia8 with theCTEQ6L1PDF set andAZNLOtune. Higgs boson production with a vector boson is generated at LO using Pythia8 with CTEQ6L1PDF. All Higgs boson samples are normalised to the theoretical calculations of Ref. [27].
Events containingZorWbosons with associated jets are simulated using the Sherpa2.1 generator. Matrix elements are calculated for up to two partons at NLO and four partons at LO. TheCT10PDF set is used
in conjunction with a dedicated parton shower tuning developed by the Sherpaauthors. TheZ/W+jets samples are normalised to the NNLO cross sections [28,29]. AlternativeZ/W+jets samples are simulated using MG5_aMC at LO interfaced to the Pythia8 parton shower model. TheA14tune is used together with theNNPDF2.3LOPDF set.
The SM production of three and four top quarks is generated at LO with MG5_aMC+Pythia8, using the A14 tune together with the NNPDF2.3LO PDF set. The samples are normalised to the NLO cross sections [30,31].
4 Object reconstruction
The final states of interest in this analysis contain electrons, muons, jets, b-jets and missing transverse momentum.
Electron candidates [32] are reconstructed from energy deposits (clusters) in the EM calorimeter that are associated with reconstructed tracks in the inner detector. The electron identification relies on a likelihood-based selection [33–35]. Electrons are required to pass the medium identification requirements and to have transverse momentumpT >7 GeV and|ηcluster|<2.47, whereηclusteris the pseudorapidity of the calorimeter energy deposit associated with the electron candidate. Candidates in the EM calorimeter barrel/endcap transition region 1.37<|ηcluster|<1.52 are excluded.
Muon candidates are reconstructed from track segments in the various layers of the muon spectrometer, matched with tracks identified in the inner detector. Muons are required to havepT>7 GeV and|η|<2.4 and to pass the medium identification requirements defined in Ref. [36]. Electron candidates sharing a track with a muon candidate are removed.
To reduce the background from non-prompt leptons from decays of hadrons or fake leptons (labelled as
“fake leptons” throughout this note), electron and muon candidates are required to be isolated. The total sum of track transverse momenta in a cone of radius min(10 GeV/pT,re,µ), excluding the track of the candidate, is required to be less than 6% of the candidatepT, wherere =0.2 andrµ=0.3. In addition, the sum of the cluster transverse energies in the calorimeter within a cone of∆Rη ≡ p
(∆η)2+(∆φ)2 < 0.2 of any electron candidate, excluding energy deposits of the candidate itself, is required to be less than 6%
of the candidatepT.
For both the electrons and muons, the longitudinal impact parameter of the associated track with respect to the primary vertex,4 z0, is required to satisfy|z0sinθ| < 0.5 mm. The significance of the transverse impact parameterd0 is required to satisfy |d0/σ(d0)| < 5 for electrons and |d0/σ(d0)| < 3 for muons, whereσ(d0) is the uncertainty ond0.
Jets are reconstructed using the anti-kt algorithm [37,38] with radius parameterR = 0.4, starting from topological clusters in the calorimeters [39]. The effect of pileup on jet energies is accounted for by a jet-area-based correction [40] and the resolution of the jets is improved by using global sequential corrections [41]. Jets are calibrated to the hadronic energy scale usingE- andη-dependent calibration factors based on MC simulations, with in-situ corrections based on Run-1 data [42,43] and checked with early Run-2 data [44]. Jets are accepted if they fulfil the requirements pT > 25 GeV and|η| < 2.5. To
4A primary vertex candidate is defined as a vertex with at least five associated tracks, consistent with the beam collision region. If more than one such vertex is found, the vertex candidate with the largest sum of squared transverse momenta of its associated tracks is taken as the primary vertex.
reduce the contribution from jets associated with pileup, jets withpT <50 GeV and|η|<2.4 are required to pass pileup rejection criteria (JVT) [45].
Jets areb-tagged as likely to containb-hadrons using theMV2c20algorithm, a multivariate discriminant making use of the long lifetime, large decay multiplicity, hard fragmentation and high mass ofbhadrons [46]. The average efficiency to correctly tag ab-jet is approximately 77% as determined in simulatedt¯t events, but it varies as function ofpTandη. In simulation, the tagging algorithm gives a rejection factor of about 130 against light-quark and gluon jets, and about 4.5 against jets containing charm quarks [47].
The efficiency of b-tagging in simulation is corrected to that in data using a t¯t based calibration using Run-1 data [48] and validated with Run-2 data [49].
The missing transverse momentumpmissT , with magnitudeEmissT , is a measure of the transverse momentum imbalance due to neutrinos escaping detection. It is computed [50] as the negative sum of transverse momenta of all electrons, muons and jets and an additional soft term. The soft term is constructed from all tracks that are not associated with any physics object, and that are associated with the primary vertex.
In this way, theEmissT is adjusted for the best calibration of the jets and the other identified physics objects above, while maintaining pileup independence in the soft term [51,52].
To prevent double-counting of electron energy deposits as jets, the closest jet within ∆Ry < 0.2 of a reconstructed electron is removed, where∆Ry ≡ p
(∆y)2+(∆φ)2. If the nearest jet surviving the above selection is within∆Ry<0.4 of an electron, the electron is discarded to ensure that selected electrons are sufficiently separated from nearby jet activity. To reduce the background from muons from heavy-flavour decays inside jets, muons are removed if they are separated from the nearest jet by∆Ry <0.4. However, if this jet has fewer than three associated tracks, the muon is kept and the jet is removed instead; this avoids an inefficiency for high-energy muons undergoing significant energy loss in the calorimeter.
5 Event selection and background estimation
Only events collected using single-electron or single-muon triggers are accepted. The trigger thresholds are set to be almost fully efficient for leptons with pT > 25 GeV passing offline selections. Events are required to have at least one reconstructed primary vertex. In all selections considered, at least one re- constructed lepton with pT > 25 GeV is required to match (∆Rη < 0.15) a lepton with the same flavour reconstructed by the trigger algorithm. Three channels are defined based on the number of reconstruc- ted leptons, which are sorted according to their transverse momentum in decreasing order. A subset of sensitive signal regions of the Run-1 analysis [2] is used, with very similar definitions.
Background events containing prompt leptons are modelled by simulation. The normalisations are taken from data control regions and included in the fit if the resulting normalisation uncertainty is lower than that from the theoretical prediction. The yields in the data control regions are extrapolated to the signal regions using expected yield ratios estimated using simulation. Systematic uncertainties on the extrapolation are taken into account in the overall uncertainty on the background estimate.
Background sources involving one or more fake leptons are modelled or validated using data events from control regions. For the same-sign dimuon and the trilepton analysis the fake lepton background is es- timated using the matrix method [53], where any combination of fake leptons among the selected leptons are considered. However, compared to Ref. [53] the real and fake lepton efficiencies used by the matrix method are estimated in a different way in this measurement. The lepton efficiencies are measured by
applying the matrix method in control regions, where the lepton efficiencies are extracted in a likelihood fit as free parameters, assuming Poisson statistics, and assuming that events with two fake leptons are neg- ligible. The control regions are defined in dilepton events, separately forb-tagged andb-vetoed events to take into account the different fake lepton efficiencies depending on whether the source is a light flavour jet or a heavy flavour jet. The real lepton efficiencies are measured in inclusive opposite-sign events, and fake lepton efficiencies in events with same-sign leptons andETmiss > 40 GeV (forb-tagged events ETmiss > 20 GeV), after subtracting the estimated contribution from events with misidentification of the charge of a lepton (denoted as “charge-flips” in the following), and excluding the 2µ-SS signal region.
The charge-flip events are subtracted using simulation. The extracted lepton efficiencies are found to be compatible with fake lepton efficiencies from a fully data-driven procedure where the charge-flip events are estimated from data. For the tetralepton channel the contribution from backgrounds containing fake leptons is estimated from simulation and corrected with scale factors determined in control regions.
The full selection requirements and the background evaluation strategies in the different channels are described below.
5.1 Same-sign dimuon analysis
The same-sign dimuon signal region (2µ-SS) targets thet¯tWprocess and has the highest sensitivity among all same-sign dilepton regions [2]. The main reason for this is that electrons have a much larger charge misidentification probability, inducing a significant background from top-quark pairs. Events are required to have two muon candidates with the same charge and pT >25 GeV,EmissT >40 GeV, the scalar sum of thepT of selected leptons and jets,HT, above 240 GeV and at least twob-tagged jets. Events containing additional leptons (withpT>7 GeV) are vetoed.
The dominant background in the 2µ-SS region arises from events containing fake leptons. Backgrounds from the production of prompt leptons with correctly identified charge come primarily fromWZproduc- tion, but the relative contribution of this background is small compared to the fake lepton background.
The charge-flip background is negligible in this signal region, as the probability of misidentifying the charge of a muon is negligible. A validation region defined by relaxing the signal region subleading lepton pT threshold to 20 GeV, the number of b-tags to at least one, and noEmissT requirement, is used to validate the fake lepton background estimate. TheEmissT and subleading leptonpTdistributions in this validation region are shown in Figure1. The expected numbers of events in the 2µ-SS signal region are shown in Table4, where nine events are observed in data.
5.2 Trilepton analysis
Four signal regions with exactly three leptons are considered. The first three are sensitive tot¯tZ; each of these requires an opposite-sign same flavour (OSSF) pair of leptons whose mass is within 10 GeV of the Zboson mass. The signal regions are categorised by their jet andb-jet multiplicities and have different signal-to-background ratios. In the 3`-Z-1b4j region, at least four jets are required, exactly one of which isb-tagged. In the 3`-Z-2b3j region, exactly three jets with at least twob-tagged jets are required. In the 3`-Z-2b4j region at least four jets are required, of which at least two areb-tagged.
In the 3`-noZ-2b region at least two and at most four jets are required, of which at least two jets are b-tagged, no OSSF lepton pair is allowed in theZmass window, and the sum of the lepton charges must be±1. This region primarily targets thet¯tW process but has also at¯tZcontribution comparable with that
[GeV]
T
Emiss
0 20 40 60 80 100 120 140 160 180 200
Data / Pred.
0 0.5 1 1.5 2
Events / 20 GeV
0 2 4 6 8 10 12
ATLAS Preliminary = 13 TeV, 3.2 fb-1
s
Data ttZ W
t
t WZ
ZZ tZ
tWZ ttH
Other Fake leptons Uncertainty
[GeV]
Subleading lepton pT
20 30 40 50 60 70 80
Data / Pred.
0 0.5 1 1.5 2
Events / 10 GeV
0 5 10 15 20 25
30 ATLAS Preliminary = 13 TeV, 3.2 fb-1
s
Data ttZ W
t
t WZ
ZZ tZ
tWZ ttH
Other Fake leptons Uncertainty
Figure 1: TheETmiss (left) and subleading lepton pT (right) distributions shown for theb-tagged 2µ-SS channel where the signal region requirements on subleading leptonpT, number ofb-tags, andEmissT are relaxed. Uncertainty includes statistical and systematic. The background denoted ‘Other’ contains other SM processes producing two same-sign prompt leptons. The last bin in each of the distributions includes the overflow. The bottom panels display the ratio between data and total prediction. The hatched area represents the uncertainty on the background.
of the 3`-Z-2b3j region. The trilepton channel signal region definitions are summarised in Table2, while the expected numbers of events in the signal regions are shown in Table4. The dominant backgrounds in the 3`-Z-1b4j, 3`-Z-2b3j and 3`-Z-2b4j signal regions arise fromZ+jets production with a fake lepton, diboson production and the production of a single top quark in association with aZboson.
Table 2: Summary of event selections in the trilepton signal regions.
Variable 3`-Z-1b4j 3`-Z-2b3j 3`-Z-2b4j 3`-noZ-2b
Leading leptonpT >25 GeV
Other leptons’pT >20 GeV
Sum of lepton charges ±1
Z-like OSSF pair |m``−mZ|<10 GeV |m``−mZ|>10 GeV
njets ≥4 3 ≥4 ≥2 and≤4
nb−jets 1 ≥2 ≥2 ≥2
A control region is used to constrain the normalisation of theWZbackground in data with exactly three leptons: an OSSF pair is required to have an invariant mass within 10 GeV of the Z boson mass, and exactly three jets, none of which passing theb-tagging requirement. With these requirements, the ex- pectedt¯tZ signal contribution is roughly 1% of the total number of events. This region is referred to as 3`-WZ-CR and it is included in the fit. Distributions comparing data and expectation are shown in Figure2.
Number of electrons
0 1 2 3
Data / Pred.
0 0.5 1 1.5 2
Events
0 5 10 15 20 25
ATLAS Preliminary = 13 TeV, 3.2 fb-1
s
Data ttZ W
t
t WZ
ZZ tZ
tWZ ttH
Other Fake leptons Uncertainty
[GeV]
Third lepton pT
20 30 40 50 60 70 80
Data / Pred.
0 0.5 1 1.5 2
Events / 10 GeV
0 5 10 15 20
25 ATLAS Preliminary = 13 TeV, 3.2 fb-1
s
Data ttZ W
t
t WZ
ZZ tZ
tWZ ttH
Other Fake leptons Uncertainty
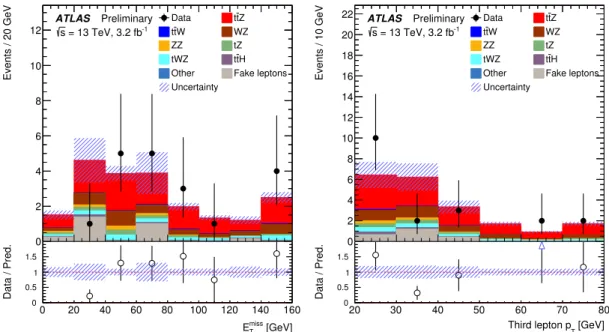
Figure 2: Number of electrons (left) and third leptonpT (right) in the 3`-WZ-CR. The distributions are shown before the fit. The background denoted ‘Other’ contains other SM processes producing three prompt leptons. The shaded bands include statistical and systematic uncertainties on the SM expectation. The last bin of the distribution shown in the right panel includes the overflow.
Two background validation regions are defined for the trilepton channel. In the first region, 3`-Z-VR, the presence of two OSSF leptons with an invariant mass within 10 GeV of the mass of theZ boson is required. The region requires the events to have at most three jets where exactly one is b-tagged, or exactly two jets where both jets areb-tagged. The main backgrounds areWZproduction and fakes from Z+jets events. In the second region, 3`-noZ-VR, events with such a pair of leptons are vetoed. This region requires the events to have at most three jets where exactly one isb-tagged, and it is dominated by the fake lepton background from top-quark pair production. Neither validation region is used in the fit.
The distributions of the number of electrons for each of the two validation regions are shown in Figure3, demonstrating a reasonable agreement between the estimated background and the data.
In total 29 events are observed in the four signal regions. Distributions of the number of jets, number of b-tagged jets, missing transverse momentum and transverse momentum of the third lepton are shown in Figures4and5.
5.3 Tetralepton analysis
The tetralepton channel targets thet¯tZprocess for the case where bothWbosons resulting from top-quark decays and theZ boson decay leptonically. Events with two pairs of opposite-sign leptons are selected, amongst which at least one pair is same flavour. The OSSF lepton pair with reconstructed invariant mass closest tomZ is attributed to theZ boson decay and denoted in the following asZ1. The two remaining leptons are used to defineZ2. Four signal regions are defined according to the relative flavour of the two Z2leptons, different flavour (DF) or same flavour (SF), and the number ofb-tagged jets: one, or at least two (1b, 2b). The signal regions are thus 4`-DF-1b, 4`-DF-2b, 4`-SF-1b and 4`-SF-2b.
Number of electrons
0 1 2 3
Data / Pred.
0 0.5 1 1.5 2
Events
0 2 4 6 8 10 12 14 16 18 20
22 ATLAS Preliminary = 13 TeV, 3.2 fb-1
s
Data ttZ W
t
t WZ
ZZ tZ
tWZ ttH
Other Fake leptons Uncertainty
Number of electrons
0 1 2 3
Data / Pred.
0 0.5 1 1.5 2
Events
0 5 10 15 20 25
ATLAS Preliminary = 13 TeV, 3.2 fb-1
s
Data ttZ W
t
t WZ
ZZ tZ
tWZ ttH
Other Fake leptons Uncertainty
Figure 3: Number of electrons in the 3`-Z-VR validation region (left) and the 3`-noZ-VR validation region (right).
The distributions are shown before the fit. The background denoted ‘Other’ contains other SM processes producing three prompt leptons. The shaded bands include statistical and systematic uncertainties on the SM expectation.
Number of jets
3 4 5 ≥6
Data / Pred.
0 0.5 1 1.5 2
Events
0 2 4 6 8 10 12 14 16 18
20 ATLAS Preliminary = 13 TeV, 3.2 fb-1
s
Data ttZ W
t
t WZ
ZZ tZ
tWZ ttH
Other Fake leptons Uncertainty
Number of b-tagged jets
1 2 ≥3
Data / Pred.
0 0.5 1 1.5 2
Events
0 2 4 6 8 10 12 14 16 18
20 ATLAS Preliminary = 13 TeV, 3.2 fb-1
s
Data ttZ W
t
t WZ
ZZ tZ
tWZ ttH
Other Fake leptons Uncertainty
Figure 4: Number of jets (left) andb-tagged jets (right) for events in the 3`-Z-1b4j, 3`-Z-2b3j and 3`-Z-2b4j signal regions. The distributions are shown before the fit. The background denoted ‘Other’ contains other SM processes producing three prompt leptons. The shaded bands include statistical and systematic uncertainties on the SM expectation.
[GeV]
T
Emiss
0 20 40 60 80 100 120 140 160
Data / Pred.
0 0.5 1 1.5 2
Events / 20 GeV
0 2 4 6 8 10 12
ATLAS Preliminary = 13 TeV, 3.2 fb-1
s
Data ttZ W
t
t WZ
ZZ tZ
tWZ ttH
Other Fake leptons Uncertainty
[GeV]
Third lepton pT
20 30 40 50 60 70 80
Data / Pred.
0 0.5 1 1.5 2
Events / 10 GeV
0 2 4 6 8 10 12 14 16 18 20
22 ATLAS Preliminary = 13 TeV, 3.2 fb-1
s
Data ttZ W
t
t WZ
ZZ tZ
tWZ ttH
Other Fake leptons Uncertainty
Figure 5: Missing transverse momentum (left) and third leptonpT(right) for events in the 3`-Z-1b4j, 3`-Z-2b3j and 3`-Z-2b4j signal regions. The distributions are shown before the fit. The background denoted ‘Other’ contains other SM processes producing three prompt leptons. The shaded bands include statistical and systematic uncertainties on the SM expectation. The last bin in each of the distributions includes the overflow.
To suppress events with fake leptons in the 1-b-tag multiplicity regions additional requirements on the scalar sum of the transverse momenta of the third and fourth leptons (pT34) are imposed. In the 4`-SF-1b and 4`-DF-1b regions, events are required to satisfypT34 >25 GeV andpT34 >35 GeV, respectively. In all regions, the invariant mass of any two reconstructed OS leptons is required to be larger than 10 GeV.
The tetralepton channel region definitions are summarised in Table3.
Table 3: Definitions of the four signal regions in the tetralepton channel. All leptons are required to satisfy pT >7 GeV and at least one lepton withpT>25 GeV is required to be trigger matched.
Region Z2leptons pT34 |mZ2 −mZ| EmissT Nb-jets
4`-DF-1b e±µ∓ >35 GeV - - 1
4`-DF-2b e±µ∓ - - - ≥2
4`-SF-1b e±e∓, µ±µ∓ >25 GeV
( >10 GeV
<10 GeV
>40 GeV
>80 GeV )
1
4`-SF-2b e±e∓, µ±µ∓ -
( >10 GeV
<10 GeV
-
>40 GeV )
≥2
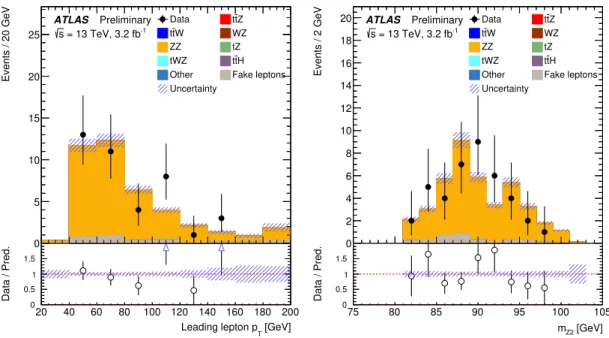
A control region used to constrain the ZZ normalisation, referred to as 4`-ZZ-CR, is defined to have exactly four reconstructed leptons, aZ2 pair with OSSF leptons, the value of bothmZ1 andmZ2 within 10 GeV of the mass of theZboson, andETmiss<50 GeV. The leading leptonpT, the invariant mass of the Z2lepton pair, the missing transverse momentum and the jet multiplicity in this control region are shown in Figures6and7, and good agreement is seen between data and prediction.
[GeV]
Leading lepton pT
20 40 60 80 100 120 140 160 180 200
Data / Pred.
0 0.5 1 1.5 2
Events / 20 GeV
0 5 10 15 20 25
ATLAS Preliminary = 13 TeV, 3.2 fb-1
s
Data ttZ W
t
t WZ
ZZ tZ
tWZ ttH
Other Fake leptons Uncertainty
[GeV]
mZ2
75 80 85 90 95 100 105
Data / Pred.
0 0.5 1 1.5 2
Events / 2 GeV
0 2 4 6 8 10 12 14 16 18
20 ATLAS Preliminary = 13 TeV, 3.2 fb-1
s
Data ttZ W
t
t WZ
ZZ tZ
tWZ ttH
Other Fake leptons Uncertainty
Figure 6: Leading leptonpT(left) andmZ2(right) distributions in the 4`-ZZ-CR region. The distributions are shown before the fit. The background denoted ‘Other’ contains other SM processes producing four prompt leptons. The shaded bands include statistical and systematic uncertainties. The last bin of the distribution shown in the left panel includes the overflow.
[GeV]
T
Emiss
0 10 20 30 40 50 60 70 80
Data / Pred.
0 0.5 1 1.5 2
Events / 20 GeV
0 10 20 30 40
50 ATLAS Preliminary = 13 TeV, 3.2 fb-1
s
Data ttZ W
t
t WZ
ZZ tZ
tWZ ttH
Other Fake leptons Uncertainty
Number of jets
0 1 2 ≥3
Data / Pred.
0 0.5 1 1.5 2
Events
0 10 20 30 40 50
ATLAS Preliminary = 13 TeV, 3.2 fb-1
s
Data ttZ W
t
t WZ
ZZ tZ
tWZ ttH
Other Fake leptons Uncertainty
Figure 7: Missing transverse momentum (left) and jet multiplicity (right) distributions in the 4`-ZZ-CR region. The distributions are shown before the fit. The background denoted ‘Other’ contains other SM processes producing four prompt leptons. The shaded bands include statistical and systematic uncertainties. The last bin of the distribution shown in the right panel includes the overflow.
The contribution from backgrounds containing fake leptons is estimated from simulation and corrected with scale factors determined in two control regions: one region enriched int¯tevents and thus in heavy flavour jets, and one region enriched inZ+jets events, and thus in light jets. The scale factors are calib- rated separately for electron and muon fake lepton candidates. The scale factors are applied to all MC simulation events with fewer than four prompt leptons according to the number and the flavour of the fake leptons. Thet¯tscale factors are applied to MC processes with real top quarks, while for all other processes theZ+jets scale factors are applied. Different generators are used when determining the scale factors and when applying them. The uncertainties on the scale factors are verified to include the differences between these generators.
The expected yields for the signal and control regions in the tetralepton channel are shown in Table4.
Five events are observed in the four signal regions. Figure8shows the data superimposed to the expected distributions for all four signal regions combined.
[GeV]
mZ1
60 70 80 90 100 110 120
Data / Pred.
0 0.5 1 1.5 2
Events / 4 GeV
0 1 2 3 4 5 6 7 8
9 ATLAS Preliminary = 13 TeV, 3.2 fb-1
s
Data ttZ W
t
t WZ
ZZ tZ
tWZ ttH
Other Fake leptons Uncertainty
Number of b-tagged jets
1 ≥2
Data / Pred.
0 0.5 1 1.5 2
Events
0 1 2 3 4 5 6 7 8
9 ATLAS Preliminary = 13 TeV, 3.2 fb-1
s
Data ttZ W
t
t WZ
ZZ tZ
tWZ ttH
Other Fake leptons Uncertainty
Figure 8: Distributions of the the invariant mass of the OSSF lepton pair closest to theZboson mass,mZ1 (left), and of the number ofb-tagged jets (right), for events in the tetralepton signal regions. The distributions are shown before the fit. The background denoted ‘Other’ contains other SM processes producing four prompt leptons. The first and last bin of the distribution shown in the left panel include the under- and overflow, respectively.
6 Systematic uncertainties
The normalisation of signal and background in each channel can be affected by several sources of sys- tematic uncertainty. These are described in the following.
6.1 Luminosity
The uncertainty on the integrated luminosity in the 2015 dataset is 5%. It is derived, following a methodo- logy similar to that detailed in Ref. [54], from a preliminary calibration of the luminosity scale usingx−y
Table 4: Expected event yields for signal and backgrounds, and the observed data in all control and signal regions used in the fit to extract thettZ¯ andttW¯ cross sections. The quoted uncertainties on expected event yields represent systematic uncertainties including MC statistical uncertainties. ThetZ,tWZ,t¯tH, three and four top-quark processes are denotedt+X. TheWZ,ZZ,H→ZZ,HWandHZand VBS processes are denoted ‘Bosons’.
Region t+X Bosons Fake leptons Total bkg. ttW¯ ttZ¯ Data
3`-WZ-CR 0.51±0.13 26.9±2.5 1.6±1.7 29.0±3.0 0.017±0.005 0.71±0.08 33 4`-ZZ-CR 0.007±0.006 37.9±2.5 3.1±0.9 41.0±2.7 <0.001 0.031±0.006 40 2µ-SS 1.00±0.19 0.14±0.06 1.7±1.5 2.9±1.5 2.28±0.34 0.65±0.07 9 3`-Z-2b4j 1.06±0.25 0.5±0.4 0.1±0.6 1.7±0.8 0.061±0.013 5.1±0.5 8 3`-Z-1b4j 1.23±0.26 3.4±2.2 2.0±1.7 6.6±2.8 0.037±0.010 4.0±0.4 7 3`-Z-2b3j 0.64±0.23 0.25±0.18 0.1±0.4 1.0±0.5 0.082±0.015 1.75±0.20 4 3`-noZ-2b 0.95±0.15 0.18±0.09 3.6±2.2 4.7±2.2 1.55±0.24 1.35±0.16 10 4`-SF-1b 0.198±0.035 0.22±0.08 0.112±0.032 0.53±0.09 <0.001 0.59±0.05 1 4`-SF-2b 0.130±0.035 0.11±0.05 0.053±0.016 0.29±0.07 <0.001 0.57±0.05 1 4`-DF-1b 0.21±0.04 0.022±0.011 0.105±0.027 0.34±0.05 <0.001 0.67±0.05 2 4`-DF-2b 0.15±0.05 <0.001 0.055±0.017 0.20±0.05 <0.001 0.58±0.05 1
beam-separation scans performed in August 2015. This systematic uncertainty is applied to all processes modelled using Monte Carlo simulations.
6.2 Uncertainties on reconstructed objects
Uncertainties associated with the lepton selection arise from the imperfect knowledge of the trigger, reconstruction, identification and isolation efficiencies, and lepton momentum scale and resolution [32–
36]. The uncertainty on the electron identification efficiency is the largest systematic uncertainty in the trilepton channel and among the most important ones in the tetralepton channel.
Uncertainties associated with the jet selection arise from the jet energy scale (JES), JVT requirement, jet energy resolution (JER) and jet reconstruction efficiency. Their estimations are based on Run-1 data and checked with early Run-2 data. The JES and its uncertainty are derived combining information from test-beam data, collision data and simulation [55]. JES uncertainty components arising from the in-situ calibration and the jet flavour composition are among the dominant uncertainties in the 2µ-SS and trilepton channels. The uncertainties in the JER and JVT have a significant effect at low jet pT. The JER uncertainty is the second largest uncertainty in the trilepton channel.
The efficiency of the flavour tagging algorithm is measured for each jet flavour using control samples in data and in simulation. From these measurements, correction factors are defined to correct the tagging rates in the simulation. In the case of b-jets, correction factors and their uncertainties are estimated based on observed and simulatedb-tagging rates int¯tdilepton events [48]. In the case ofc-jets, they are derived based on jets with identifiedD? mesons [56]. In the case of light-flavour jets, correction factors are derived using dijet events [56]. Sources of uncertainty affecting theb- andc-tagging efficiencies are considered as a function of jet pT, including bin-to-bin correlations [48]. An additional uncertainty is assigned to account for the extrapolation of theb-tagging efficiency measurement from the pT region used to determine the scale factors to regions with higher pT. For the light-jet tagging efficiency the
dependence of the uncertainty on the jetpT andηis considered. These systematic uncertainties are taken as uncorrelated betweenb-jets,c-jets, and light-flavour jets.
The treatment of the uncertainties on reconstructed objects is common to all three channels, and thus these are considered as correlated among different regions.
6.3 Uncertainties on signal modelling
From the nominal MG5_aMC+Pythia8 (A14tune) configuration, two parameters are varied to investig- ate uncertainties from the modelling of thet¯tV process: the renormalisation (µR) and factorisation (µF) scale. A simultaneous variation ofµR = µF by factors 2.0 and 0.5 has been considered. In addition, a set of variations in the tune parameters (A14eigentune variations) sensitive to initial and final state ra- diation, multiple parton interaction and colour reconnection are evaluated. Studies performed at particle level show that the largest impact comes from variations in initial state radiation [15]. The systematic uncertainty due to the choice of the generator for thet¯tV signals is estimated by comparing the nominal sample with one generated with Sherpav2.2 using the LO matrix element with up to one (two) additional parton(s) included in the matrix element calculation for t¯tZ (t¯tW) and merged with the Sherpa parton shower [57] using the ME+PS@LO prescription. TheNNPDF3.0NLOPDF [58] set is used in conjunction with a dedicated parton shower tune developed by the Sherpaauthors. Signal modelling uncertainties are treated as correlated among channels.
6.4 Uncertainties on background modelling
In the trilepton and 2µ-SS channels the diboson background is dominated byWZproduction, while in the tetralepton channelZZproduction is dominant.
In the trilepton and 2µ-SS channels, the normalisation of theWZbackground is treated as a free parameter in the fit used to extract the t¯tV signals. The uncertainty on the extrapolation of the WZ background estimate from the control region to signal regions with specific jet andb-tag multiplicities is evaluated by comparing predictions obtained varying the renormalisation, factorisation and resummation scales used to generate the simulation samples. The uncertainties vary across the different regions and an overall uncertainty of−50% and+100% is used.
The normalisation of theZZbackground is treated as a free parameter in the fit used to extract thet¯tVsig- nals. In the tetralepton channel, several uncertainties on theZZbackground estimate are considered. They arise from the extrapolation from the 4`-ZZ-CR control region (corresponding to on-shellZZproduction) to the signal region (with off-shellZZ background) and from the extrapolation from the control region without jets to the signal region with at least one jet, and are found to be 30% and 20%, respectively. An additional uncertainty of 10–30% is assigned to the normalisation of the heavy-flavour content of theZZ background, based on a data-to-simulation comparison of events with oneZboson and additional jets and cross-checked with a comparison between differentZZsimulations [2].
An uncertainty of 13% is assigned to thet¯tH production cross section in all channels, corresponding to the uncertainty on the theoretical prediction [59].
For thetZbackground, an overall normalisation uncertainty of 50% is assumed. An additional uncertainty that affects the distribution of this background as a function of jet andb-jet multiplicity is evaluated by
varying factorisation and renormalisation scales, as well as the amount of radiation in thePerugia2012 parton shower tune.
An uncertainty of+10% and−22% is assigned on thetWZ background cross section. The uncertainty is asymmetric due to the alternative estimate of the interference effect between this process and thet¯tZ production. The shape uncertainty is evaluated by varying the factorisation and renormalisation scales up and down by a factor of two with respect to the nominal value.
For other prompt lepton backgrounds, uncertainties of 20% are assigned to the normalisations of theW H andZHprocesses, based on calculations from Ref. [60]. An uncertainty of 50% is considered for triboson and same-signWW processes.
The fake lepton background uncertainty is evaluated as follows. The matrix method yield uncertainty on this background is estimated by propagating the statistical uncertainty on the measurement of the fake lepton efficiencies. Additionally, a 20% uncertainty is added on the subtracted charge-flip yields, and a 20 GeV variation is applied on theEmissT requirement used to enhance the single fake lepton fraction.
The main sources of muon fake leptons are light flavour hadron jets and heavy flavour hadron jets. For the 2µ-SS region, the flavour composition of the jets faking leptons is assumed to be unknown. To cover this uncertainty the central values for the fake lepton efficiencies extracted from theb-veto and theb-tag control region are used, with the efficiency difference assigned as an extra uncertainty. For the tetralepton channel, fake lepton systematic uncertainties are covered by the scale-factor uncertainties used to calibrate the simulated fake lepton yield in the control regions. Within a fake lepton estimation method all systematic uncertainties are considered to be correlated among analysis channels and regions. Thus 2µ-SS and trilepton fake lepton systematic uncertainties that use the matrix method, are uncorrelated to the tetralepton systematic uncertainties. The expected uncertainties on the fake lepton backgrounds with respect to the total backgrounds vary in each channel and signal region: 50% for the 2µ-SS region, 25–50% for the trilepton channel and 5–10% for the tetralepton channel.
7 Results
In order to extract thet¯tZcross section, eight signal regions (3`-Z-1b4j, 3`-Z-2b3j, 3`-Z-2b4j, 3`-noZ-2b, 4`-DF-1b, 4`-DF-2b, 4`-SF-1b, 4`-SF-2b) and two control regions (3`-WZ-CR, 4`-ZZ-CR) are fitted simultaneously. To extract thet¯tW cross section, two signal regions (3`-noZ-2b, 2µ-SS) and two control regions (3`-WZ-CR, 4`-ZZ-CR) are fitted. The production cross sectionsσt¯tZ andσttW¯ are determined using binned maximum-likelihood fits to the numbers of events in these regions, assuming the Standard Model cross section and its predicted uncertainty at NLO in QCD for the other process, t¯tW and t¯tZ, respectively. The fits are based on the profile likelihood technique, where systematic uncertainties are al- lowed to vary in the fits as nuisance parameters and take on their best-fit values. None of the uncertainties are found to be significantly constrained or pulled from their initial values. The measured cross sections areσt¯tZ =0.92±0.30 (stat.)±0.11 (syst.) pb andσttW¯ =1.38±0.70 (stat.)±0.33 (syst.) pb.
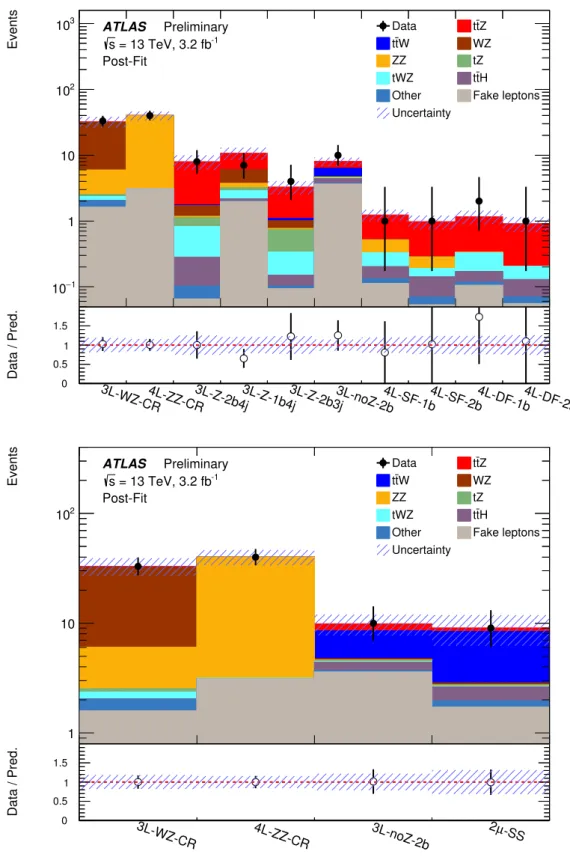
Summaries of the fits to all channels used to measure thet¯tZandt¯tWproduction cross sections are shown in Figure9. The normalisation correction for theWZ andZZ backgrounds with respect to the Standard Model expectations are obtained from the fits as described in Section5and found to be compatible with unity: 1.13±0.30 and 0.97±0.17 in thet¯tZfit, and 1.15±0.30 and 0.97±0.18 in thet¯tW fit.
3L-WZ-CR4L-ZZ-CR3L-Z-2b4j3L-Z-1b4j3L-Z-2b3j3L-noZ-2b4L-SF-1b4L-SF-2b4L-DF-1b4L-DF-2b
Data / Pred.
0 0.5 1 1.5
2
Events
1
10−
1 10 102
103 ATLAS Preliminary = 13 TeV, 3.2 fb-1
s Post-Fit
Data ttZ
W t
t WZ
ZZ tZ
tWZ ttH
Other Fake leptons Uncertainty
3L-WZ-CR 4L-ZZ-CR 3L-noZ-2b 2µ-SS
Data / Pred.
0 0.5 1 1.5
2
Events
1 10 102
ATLAS Preliminary = 13 TeV, 3.2 fb-1
s Post-Fit
Data ttZ
W t
t WZ
ZZ tZ
tWZ ttH
Other Fake leptons Uncertainty
Figure 9: Expected yields after the fits compared to data for the ttZ¯ (top) and ttW¯ (bottom) fit in the relevant signal regions and the two control regions used to constrain theWZandZZbackgrounds. The “Other” background summarises all other backgrounds described in Section3. The hatched area corresponds to the total uncertainty on the predicted yields.
Table5shows the leading and total uncertainties on the measuredt¯tZ andt¯tW cross sections. For both processes, the precision of the measurement is dominated by statistical uncertainties. For the t¯tZ fit, the different sources contribute with similar size to the total systematic uncertainty. For thet¯tW fit, the dominant systematic uncertainty source is the limited amount of data available for the estimation of the fake leptons. Thet¯tZ process is mainly measured in the trilepton and tetralepton channels, while the sensitivity to thet¯tW process is dominated by the 2µ-SS channel.
Table 5: List of leading and total uncertainties on the measured cross sections of thet¯tZandttW¯ processes from the fits. All uncertainties are symmetrised.
Uncertainty σt¯tZ σt¯tW
Luminosity 6.4% 7.0%
Reconstructed objects 7.0% 7.3%
Backgrounds from simulation 5.5% 3.7%
Fake leptons and charge misID 3.9% 21%
Total systematic 12% 24%
Statistical 32% 51%
Total 34% 56%
8 Conclusion
Measurements of the production cross sections of a top-quark pair in association with aZ orW boson using 3.2 fb−1 of data collected by the ATLAS detector in √
s = 13 TeV ppcollisions at the LHC have been presented. Final states with either two same-charge muons, or three or four leptons are analysed.
From a fit to eight signal regions and two control regions, thet¯tZproduction cross section is determined to beσttZ¯ =0.9±0.3 pb, while from a fit to two signal regions and two control regions, thet¯tW production cross section is determined to beσt¯tW = 1.4±0.8 pb. Both measurements are consistent with the NLO QCD theoretical calculations,σt¯tZ =0.76±0.08 pb andσttW¯ =0.57±0.06 pb.
References
[1] ATLAS Collaboration,Measurement of the tt production cross-section using eµ¯ events with b-tagged jets in pp collisions at √
s=13TeV with the ATLAS detector, ATLAS-CONF-2016-005, url:https://atlas.web.cern.ch/Atlas/GROUPS/PHYSICS/CONFNOTES/ATLAS-CONF- 2016-005/.
[2] ATLAS Collaboration,Measurement of the ttW and t¯¯ tZ production cross sections in pp collisions at √
s=8TeV with the ATLAS detector, JHEP1511(2015) 172, arXiv:1509.05276 [hep-ex].
[3] CMS Collaboration,Observation of top quark pairs produced in association with a vector boson in pp collisions at √
s=8TeV, JHEP01(2016) 096, arXiv:1510.01131 [hep-ex].