ATLAS-CONF-2015-033 27July2015
ATLAS NOTE
ATLAS-CONF-2015-033
25th July 2015
Measurement of the √ t t ¯ production cross-section in pp collisions at s = 13 TeV using eµ events with b-tagged jets
The ATLAS Collaboration
Abstract
This note describes a measurement of the inclusive top-pair production cross-section (σ
t¯t) with a data sample of 78 pb
√ −1of proton-proton collisions at a centre-of-mass energy of s
=13 TeV, collected in 2015 by the ATLAS detector, using t¯ t events with an opposite-sign electron–muon pair in the final state. Jets containing b-quarks are tagged using an algorithm based on track impact parameters and reconstructed secondary vertices. The numbers of events with exactly one and exactly two b-tagged jets are counted and used to determine simultaneously
σt¯tand the e
fficiency to reconstruct and b-tag a jet from a top quark decay, thereby minimising the associated systematic uncertainties. The cross-section is measured to be:
σt¯t=
825
±49 (stat)
±60 (syst)
±83 (lumi) pb,
where the three uncertainties arise from data statistics, experimental and theoretical system- atic effects, and the integrated luminosity, giving a total relative uncertainty of 14 %. The result is consistent with recent theoretical QCD calculations at next-to-next-to-leading order.
c
2015 CERN for the benefit of the ATLAS Collaboration.
Reproduction of this article or parts of it is allowed as specified in the CC-BY-3.0 license.
1 Introduction
The top quark is the heaviest known fundamental particle, with a mass (m
t) that is much larger than any of the other quarks and close to the scale of electroweak symmetry breaking. The study of its production and decay properties forms a core part of the ATLAS physics programme at the CERN Large Hadron Collider (LHC). At the LHC, top quarks are primarily produced in quark–antiquark pairs (t¯ t), and the precise pre- diction of the corresponding inclusive cross-section (σ
t¯t) is a substantial challenge for QCD calculational techniques. Precise measurements of
σt¯tare sensitive to the gluon parton distribution function (PDF), the strong coupling constant
αs, the top quark mass, and potential enhancements due to physics beyond the Standard Model.
Calculations of
σt¯tat hadron colliders are available at full next-to-next-to-leading order (NNLO) accuracy, including the resummation of next-to-next-to-leading logarithmic (NNLL) soft gluon terms [1–5]. At a centre-of-mass energy of
√s
=13 TeV and assuming m
t =172.5 GeV, these calculations give a prediction of 832
+40−46pb, including PDF,
αsand QCD scale uncertainties. This value has been calculated using the
top++ 2.0program [6]. The PDF and
αsuncertainties were calculated using the PDF4LHC prescription [7] with the MSTW2008 68 % CL NNLO [8, 9], CT10 NNLO [10, 11] and NNPDF2.3 5f FFN [12] PDF sets,
1and added in quadrature to the scale uncertainty to give a final relative uncertainty of
+4.8−5.5%. The cross-section at
√s
=13 TeV is predicted to be 3.3 times larger than the cross-section at
√s
=8 TeV.
Within the Standard Model, the top quark decays almost exclusively to a W boson and a b quark, so the final-state topologies in t¯ t production are governed by the decay modes of the two W bosons. This document describes a measurement in the dileptonic eµ channel, t¯ t
→W
+bW
−b ¯
→e
+µ−ννbb, ¯
2selecting events with an opposite-sign eµ pair, and one or two hadronic jets from the b-quarks. Jets originating from b-quarks are identified (‘tagged’) using a b-tagging algorithm exploiting the long lifetime, high decay multiplicity, hard fragmentation and high mass of b hadrons. The rates of events with an eµ pair and one or two b-tagged jets are used to measure simultaneously the t¯ t production cross-section and the combined probability to reconstruct and b-tag a jet from a top-quark decay. Events with electrons or muons produced via leptonically decaying taus, t
→Wb
→τνb→e/µνννb, are included as part of the t¯ t signal. The main background is Wt, the associated production of a W boson and a single top quark. Other background contributions arise from Z
→ττ→eµ
+jets production, diboson+jets production and eventswhere one reconstructed lepton does not arise from a W or Z decay.
The most precise ATLAS measurements of
σt¯tat
√s
=7 and 8 TeV were made using eµ events with b-tagged jets [13]. This note documents a preliminary measurement of
σt¯tusing the same final state and analysis technique. Wherever possible, the analysis builds on the studies and procedures used in this earlier publication. The data and Monte Carlo simulation samples are described in Section 2, followed by the object and event selection in Section 3 and the extraction of the t¯ t cross-section in Section 4.
Systematic uncertainties are discussed in Section 5, and the final result and conclusions are presented in Section 6.
1The values ofαsused are 0.1171±0.0014 for MSTW2008 and 0.1180±0.0012 for the CT10 and NNPDF2.3 PDF sets.
2Charge-conjugate modes are implied throughout.
2 Data and simulation samples
The ATLAS detector [14] at the LHC covers nearly the entire solid angle around the collision point, and consists of an inner tracking detector surrounded by a thin superconducting solenoid magnet producing a 2 T axial magnetic field, electromagnetic and hadronic calorimeters, and an external muon spectrometer incorporating three large toroid magnet assemblies. The inner detector consists of a high-granularity silicon pixel detector, including the newly-installed insertable B-layer (IBL) [15], and a silicon microstrip tracker, together providing precision tracking in the pseudorapidity
3range
|η|<2.5, complemented by a transition radiation tracker providing tracking and electron identification information for
|η|<2.0. A lead liquid-argon (LAr) electromagnetic calorimeter covers the region
|η| <3.2, and hadronic calorimetry is provided by steel
/scintillating tile calorimeters for
|η|<1.7 and copper
/LAr hadronic endcap calorimeters.
The forward region is covered by additional LAr calorimeters with copper and tungsten absorbers. The muon spectrometer consists of precision tracking chambers covering the region
|η| <2.7, and separate trigger chambers covering
|η| <2.4. A two-level trigger system, using custom hardware followed by a software-based level, is used to reduce the event rate to a maximum of around 1 kHz for offline storage.
The analysis is performed using data collected by the ATLAS detector between 13th June and 14th July during the early 2015 proton–proton collision run at
√s
=13 TeV with 50 ns proton bunch spacing. The data correspond to an integrated luminosity of 78 pb
−1after requiring that all detector subsystems were operational. Events are required to pass either a single electron or single muon trigger, with thresholds set to be almost fully efficient for leptons with p
T >25 GeV passing offline selections. Each triggered event also includes the signals from on average about 19 additional inelastic pp collisions in the same bunch crossing (known as pileup).
Monte Carlo simulated event samples are used to develop the analysis, to compare to the data and to evaluate signal and background e
fficiencies and uncertainties. Samples were processed either through the full ATLAS detector simulation [16] based on GEANT4 [17], or through a faster simulation making use of parameterised showers in the calorimeters [18]. Additional simulated pp collisions generated with P
ythia8.186 [19] were overlaid to model the e
ffects of both in- and out-of-time pileup, from additional pp collisions in the same and nearby bunch crossings. All simulated events were processed using the same reconstruction algorithms and analysis chain as the data, and small corrections were applied to lepton trigger and reconstruction efficiencies better to model the response observed in data.
The baseline t¯ t full simulation sample was produced using the next-to-leading-order (NLO) matrix ele- ment generator Powheg-Box v2 [20–22] using the CT10 set of parton distribution functions [10], and in- terfaced to P
ythia6.428 [23] for the parton showering and fragmentation. The Perugia 2012 (P2012) [24]
parameter set (tune) with the CTEQ6L PDF set [25] was used for the underlying event (UE) description.
All t¯ t final states involving at least one lepton are included. The EvtGen [26] package was used to model the decays of heavy flavour hadrons. The P
owhegmodel parameter h
damp, which controls matrix ele- ment to parton shower matching in P
owhegand e
ffectively regulates the high-p
Tradiation, was set to the top quark mass, 172.5 GeV, a setting which was found to give the best modelling of the t¯ t system p
Tat
√
s
=7 TeV [27]. The Standard Model expectation of 0.1082 was assumed for the W
→ `νbranching ratio [28]. Alternative t¯ t simulation samples were generated using P
owheginterfaced to H
erwig++[29]
3ATLAS uses a right-handed coordinate system with its origin at the nominal interaction point in the centre of the detector, and thezaxis along the beam line. Pseudorapidity is defined in terms of the polar angleθasη=−ln tanθ/2, and transverse momentum and energy are defined relative to the beamline aspT=psinθandET=Esinθ. The azimuthal angle around the beam line is denoted byφ, and distances in (η, φ) space by∆R= p
∆η2+ ∆φ2.
and M
adG
raph5_
aMC@NLO [30] interfaced to H
erwig++. The e
ffects of initial- and final-state radi- ation (ISR/FSR) were explored using two alternative Powheg + Pythia6 samples, one with h
dampset to 2m
t, the renormalisation scale set to half the nominal value and using the Perugia 2012 radHi UE tune, giving more radiation, and one with the Perugia 2012 radLo UE tune, h
damp=m
tand the renormalisation scale set to twice the nominal value, giving less radiation. These alternative t¯ t samples were produced using fast simulation and compared to a fast simulation version of the baseline sample. The top quark mass was set to 172.5 GeV in all the t¯ t simulation samples mentioned above.
Background events are classified into two types: those with two real prompt leptons from W or Z decays (including those produced via leptonic tau decays), and those where at least one of the reconstructed lepton candidates is misidentified or ‘fake’, i.e. a non-prompt lepton from the decay of a bottom or charm hadron, an electron from a photon conversion, hadronic jet activity misidentified as an electron, or a muon produced from an in-flight decay of a pion or kaon. The first category with two prompt leptons includes Wt single top production, Z
→ ττ+jets and dibosons (WW, WZ and ZZ). Wt production is modelled using P
owheg-B
ox v2
+P
ythia6 using the ‘diagram removal’ generation scheme, CT10 PDFs and the P2012 UE tune. Inclusive Z
→ττproduction (including additional jets) is modelled using P
owhegwith CT10 PDFs, interfaced to Pythia8.186 and the AZNLO UE tune [31] with CTEQ6L1 PDFs. Diboson production in association with jets is modelled using S
herpa2.1.1 [32] and CT10 PDFs, including matrix elements calculated for up to one (``νν and
````) or zero (```ν) partons at NLO and up to three partonsat leading order using the C
omix[33] and O
penL
oops[34] matrix element generators, merged with the Sherpa parton shower [35] using the ME+PS@NLO prescription [36].
The majority of backgrounds with at least one misidentified lepton in the selected sample arise from t¯ t production where only one of the top quarks decays leptonically, which was simulated in the same way as dileptonic t¯ t production. Other background processes with only one prompt lepton include t-channel single top production, modelled using P
owhegB
ox v1
+P
ythia6, and W
+jets with the W decaying to eν,
µνor
τνwhere the
τ-lepton subsequently decays leptonically. This background was modelled usingP
owheg +P
ythia8 as for Z
+jets production. Other backgrounds, including processes with two misidenti-fied leptons, are negligible for the event selections used in this analysis.
3 Object and event selection
This analysis makes use of reconstructed electrons, muons and b-tagged jets. The object and event selec- tions largely follow those used in the earlier publication, in particular the same kinematic cuts are used for electrons and jets, and very similar ones are used for muons.
Electron candidates
are reconstructed from an isolated electromagnetic calorimeter energy deposit match-
ed to an inner detector track and passing a medium likelihood-based requirement [37], within the fiducial
region of transverse energy E
T>25 GeV and pseudorapidity
|η|<2.47. Candidates within the transition
region between the barrel and endcap electromagnetic calorimeters, 1.37
<|η|<1.52, are removed. Elec-
trons are required to be isolated using requirements on the energy of calorimeter topological clusters in a
cone of
∆R
<0.2 around the electron (excluding the deposit from the electron itself) divided by the elec-
tron p
T, and on the sum of track p
Tin a variable-sized cone around the electron direction (again excluding
the electron track itself). The track isolation cone radius is given by the smaller of
∆R
=10 GeV/p
T(e)
and
∆R
=0.2, i.e. a cone which increases in size at low p
Tup to a maximum of 0.2 radians. Selection
criteria, dependent on p
Tand
η, are applied to produce a nominal efficiency of 90 % on electrons fromZ
→ee decays with p
Tof 25 GeV which rises to 99 % at 60 GeV. The efficiencies in t¯ t events are smaller,
due to the increased jet activity. To prevent double-counting of electron energy deposits as jets, the closest jet within
∆R
<0.2 of a reconstructed electron is removed. Finally, if the nearest jet surviving the above selection is within
∆R
<0.4 of the electron, the electron is discarded, to ensure it is su
fficiently separated from nearby jet activity.
Muon candidates
are reconstructed by combining matching tracks reconstructed in both the inner de- tector and muon spectrometer, and required to satisfy p
T >25 GeV and
|η| <2.4. Muons are also required to be isolated, using the same requirement as for electrons, with the selection criteria tuned to give similar efficiencies on Z
→ µµevents. To reduce the background from muons from heavy flavour decays inside jets, muons are removed if they are separated from the nearest jet by
∆R
<0.4. However, if this jet has fewer than three associated tracks, the muon is kept and the jet is removed instead; this avoids an inefficiency for high-energy muons undergoing significant energy loss in the calorimeter.
Jets
are reconstructed using the anti-k
talgorithm [38, 39] with radius parameter R
=0.4, starting from topological clusters in the calorimeters [40]. Jets are calibrated using an energy- and
η-dependentsimulation-based calibration scheme, with in-situ corrections based on Run 1 data [41], checked with early Run 2 data [42]. No corrections for semileptonic b-hadron decays are applied. Jets are accepted within the fiducial region p
T >25 GeV and
|η| <2.5. To reduce the contribution from jets associated with pileup, jets with p
T <50 GeV and
|η| <2.4 are required to pass pileup rejection criteria [43].
Reconstructed jets within
∆R
<0.2 of a selected electron are removed, as discussed earlier.
Jets are b-tagged as likely to contain b hadrons using the MV2c20 algorithm, a multivariate discriminant making use of track impact parameters and reconstructed secondary vertices [44–46]. Jets are defined as being b-tagged if the MV2c20 weight is larger than a cut value corresponding to approximately 70%
b-tagging efficiency for b-jets in t¯ t events, although the exact efficiency varies with p
T. In simulation, the tagging algorithm gives a rejection factor of about 440 against light-quark and gluon jets, and about eight against jets originating from charm quarks.
Events are rejected if the selected electron and muon are separated by
∆φ <0.15 and
∆θ <0.15, where
∆φ
and
∆θare the di
fferences in polar and azimuthal angles between the two leptons. This requirement rejects events where a muon undergoes significant energy loss in the electromagnetic calorimeter, thus leading to a reconstructed electron candidate. Events passing the above requirements, and having exactly one selected electron and one selected muon of opposite electric charge (OS), define the eµ preselected sample. The corresponding same-sign (SS) sample is used in the estimation of background from events with misidentified leptons. Events are then further classified into those with exactly one or exactly two b-tagged jets.
4 Extraction of the t t ¯ cross-section
The t¯ t production cross-section
σtt¯is determined as in the previous publication by counting the numbers of opposite-sign eµ events with exactly one (N
1) and exactly two (N
2) b-tagged jets, ignoring any jets that are not b-tagged which may be present, due e.g. to light-quark or gluon jets from QCD radiation or b-jets from top decays which are not b-tagged. The two event counts can be expressed as:
N
1 =Lσ
tt¯eµ2
b(1
−C
bb)
+N
1bkgN
2 =Lσ
tt¯eµC
bb2+N
2bkg(1)
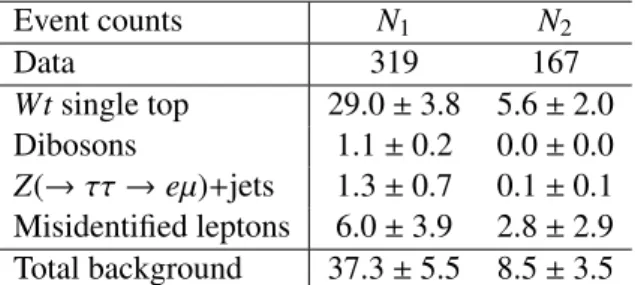
Event counts N
1N
2Data 319 167
Wt single top 29.0
±3.8 5.6
±2.0
Dibosons 1.1
±0.2 0.0
±0.0
Z(→
ττ→eµ)
+jets 1.3
±0.7 0.1
±0.1 Misidentified leptons 6.0
±3.9 2.8
±2.9 Total background 37.3
±5.5 8.5
±3.5
Table 1: Observed numbers of opposite-signeµevents with one and twob-tagged jets (N1andN2), together with the estimates of non-tt¯backgrounds and associated total uncertainties described in Section5. Yields smaller than 0.05 are rounded down to 0.0.
where L is the integrated luminosity of the sample and
eµthe e
fficiency for a t¯ t event to pass the opposite- sign eµ preselection. The combined probability for a jet from the quark q in the t
→Wq decay to fall within the acceptance of the detector, be reconstructed as a jet with transverse momentum above the selection threshold, and be tagged as a b-jet, is denoted by
b. Although this quark is almost always a b- quark,
balso accounts for the approximately 0.2 % of top quarks that decay to W s or Wd rather than Wb, slightly reducing the effective tagging efficiency. If the decays of the two top quarks and the subsequent reconstruction of the two b-tagged jets are completely independent, the probability to tag both b-jets
bbis given by
bb=b2. In practice, small correlations are present for both kinematic and instrumental reasons, and these are taken into account via the tagging correlation coefficient C
b, defined as C
b = bb/b2, or equivalently C
b =4N
eµt¯tN
2t¯t/(N1tt¯+2N
2tt¯)
2, where N
eµt¯tis the number of preselected eµ t¯ t events and N
1t¯tand N
2t¯tare the numbers of events with one and two b-tagged jets. This correlation term also accounts for the effect on N
1and N
2of the small number of mistagged light quark or gluon jets from radiation in the t¯ t events. Background from sources other than t¯ t
→eµννb b ¯ also contributes to the event counts N
1and N
2, and is given by the background terms N
1bkgand N
2bkg. The preselection e
fficiency
eµand tagging correlation C
bare taken from t¯ t event simulation, and the background contributions N
bkg1and N
2bkgare estimated using a combination of simulation and data-based methods, allowing the two equations (1) to be solved yielding
σt¯tand
b.
A total of 795 data events passed the eµ opposite-sign preselection. Table 1 shows the number of events with one and two b-tagged jets, together with the estimates of non-t¯ t background and their systematic un- certainties discussed in detail below. The sample with one b-tagged jet is expected to be about 89 % pure in t¯ t events, with the dominant background coming from Wt production, and smaller contributions from events with misidentified leptons, Z
+jets and dibosons. The sample with twob-tagged jets is expected to be about 96% pure in t¯ t events, with Wt production again being the dominant background.
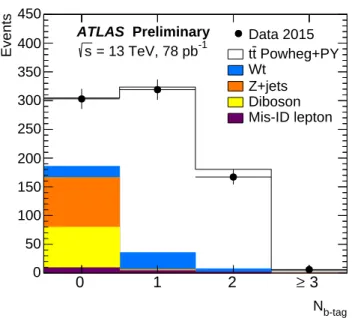
The distribution of the number of b-tagged jets in opposite-sign eµ events is shown in Figure 1, and com- pared to the baseline t¯ t and background simulation sample, normalised using the theoretical prediction of 832 pb for the t¯ t cross-section at
√s
=13 TeV. Distributions of the number of jets, the jet p
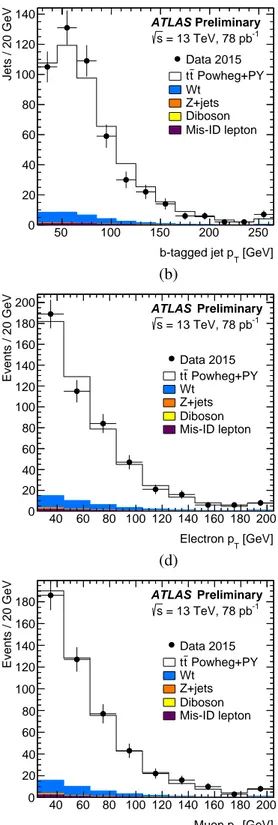
T, and the electron and muon
|η|and p
Tare shown for opposite-sign eµ events with at least one b-tagged jet in Figure 2, in which the simulation is normalised to the same number of events as the data. In general, the agreement between data and simulation is good.
The value of
σt¯textracted from Equation 1 is inversely proportional to the assumed value of
eµ, with the
derivative (dσ
t¯t/deµ)/(σ
t¯t/eµ)
= −1. The value ofeµis determined from simulation to be about 0.9 %,
including the t¯ t
→eµννb b ¯ branching ratio, and uncertainties on
eµtranslate directly into uncertainties on
σt¯t. Similarly,
σt¯tis directly sensitive to the value of C
b(determined from simulation to be about 1.005),
b-tag
N
0 1 2 ≥ 3
Events
0 50 100 150 200 250 300 350 400 450
ATLAS Preliminary = 13 TeV, 78 pb-1
s
Data 2015 Powheg+PY t
t Wt Z+jets Diboson Mis-ID lepton
Figure 1: Distributions of the number of b-tagged jets in preselected opposite-sign eµ events. The data are shown compared to the expectation from simulation, broken down into contributions fromtt¯(using the baseline Powheg+Pythia6 sample),Wtsingle top,Z+jets, dibosons, and events with fake electrons or muons, normalised to the same integrated luminosity as the data.
but with the opposite sign, (dσ
t¯t/dCb)/(σ
t¯t/Cb)
=1. The systematic uncertainties on these quantities are discussed in Section 5.
4.1 Background estimation
Most background contributions are estimated from simulation. The Wt single top background is normal- ised to the approximate NNLO cross-section of 71.7
±3.8 pb, determined as in Ref. [47]. The diboson background normalisation is estimated using Sherpa as discussed in Section 2. The normalisation of the Z
+jets background, originating from events with aZ
→ ττ →eµ decay accompanied by one or two b-tagged jets, is estimated from the P
owheg+P
ythia8 simulation samples and cross-checked with data, as described in Section 5.
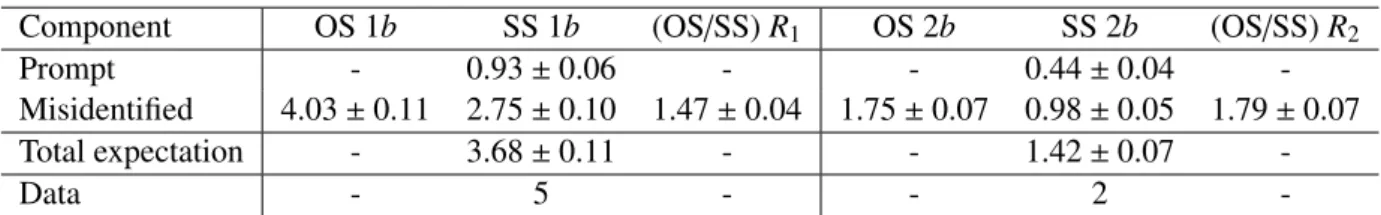
The background from events with one real and one misidentified lepton is estimated from a combination
of data and simulation, using the method employed in the previous publication. Simulation studies show
that the samples with a same-sign eµ pair and one or two b-tagged jets are dominated by events with a
misidentified lepton, with rates comparable to those in the opposite-sign sample. The contributions of
events with misidentified leptons are therefore estimated using the same-sign event counts in data after
subtraction of the estimated prompt same-sign contributions, multiplied by the opposite- to same-sign
fake-lepton ratios R
jfor j
=1 and 2 b-tagged jets predicted from simulation. This procedure is illustrated
in Table 2, which shows the expected breakdown of same-sign event counts in terms of prompt and
misidentified lepton events, and the corresponding predictions for misidentified leptons in the opposite-
sign sample. The values of R
jare taken to be R
1 =1.5
±0.5 and R
2 =1.8
±1.0. The uncertainties
encompass the di
fferent values of R
jpredicted for the various sub-components of the misidentified lepton
background, which is dominated by electrons from photon conversions, followed by electrons and muons
Njet
1 2 3 4 5 ≥ 6
Events
0 20 40 60 80 100 120 140 160 180
200 ATLAS Preliminary
= 13 TeV, 78 pb-1
s
Data 2015 Powheg+PY t
t Wt Z+jets Diboson Mis-ID lepton
(a)
[GeV]
b-tagged jet pT
50 100 150 200 250
Jets / 20 GeV
0 20 40 60 80 100 120
140 ATLAS Preliminary
= 13 TeV, 78 pb-1
s
Data 2015 Powheg+PY t
t Wt Z+jets Diboson Mis-ID lepton
(b)
η| Electron |
0 0.5 1 1.5 2 2.5
Events / 0.25
0 20 40 60 80 100 120
ATLAS Preliminary = 13 TeV, 78 pb-1
s
Data 2015 Powheg+PY t
t Wt Z+jets Diboson Mis-ID lepton
(c)
[GeV]
Electron pT
40 60 80 100 120 140 160 180 200
Events / 20 GeV
0 20 40 60 80 100 120 140 160 180
200 ATLAS Preliminary
= 13 TeV, 78 pb-1
s
Data 2015 Powheg+PY t
t Wt Z+jets Diboson Mis-ID lepton
(d)
η| Muon |
0 0.5 1 1.5 2 2.5
Events / 0.25
0 20 40 60 80 100
120 ATLAS Preliminary
= 13 TeV, 78 pb-1
s
Data 2015 Powheg+PY t
t Wt Z+jets Diboson Mis-ID lepton
(e)
[GeV]
Muon pT
40 60 80 100 120 140 160 180 200
Events / 20 GeV
0 20 40 60 80 100 120 140 160
180 ATLAS Preliminary
= 13 TeV, 78 pb-1
s
Data 2015 Powheg+PY t
t Wt Z+jets Diboson Mis-ID lepton
(f)
Figure 2: Distributions of (a) the number of jets, (b) the transverse momentum pT of theb-tagged jets, (c) the|η|
of the electron, (d) thepT of the electron, (e) the|η|of the muon and (f) the pT of the muon, in events with an opposite-signeµpair and at least one b-tagged jet. The data are compared to the expectation from simulation, broken down into contributions fromtt¯(using the baseline Powheg+Pythia6 sample), single top,Z+jets, dibosons, and events with fake electrons or muons, normalised to the same number of entries as the data. The last histogram bin includes the overflow.
Component OS 1b SS 1b (OS/SS) R
1OS 2b SS 2b (OS/SS) R
2Prompt - 0.93
±0.06 - - 0.44
±0.04 -
Misidentified 4.03
±0.11 2.75
±0.10 1.47
±0.04 1.75
±0.07 0.98
±0.05 1.79
±0.07
Total expectation - 3.68
±0.11 - - 1.42
±0.07 -
Data - 5 - - 2 -
Table 2: The expected numbers of events with at least one misidentified lepton in the one and twob-tag opposite- and same-signeµsamples, together with the opposite- to same-sign ratiosR1 andR2. The expected numbers of same-sign events with two prompt leptons, and the total numbers of same-sign events in simulation and data are also shown. The uncertainties are due to limited simulation statistics.
from the decays of bottom and charm hadrons. A 50 % uncertainty is assigned to the prompt same- sign contribution, which includes events where the charge of the electron was misidentified. The final uncertainties on the misidentified lepton background shown in Table 1 are dominated by the statistical uncertainties on the numbers of same-sign events observed in data.
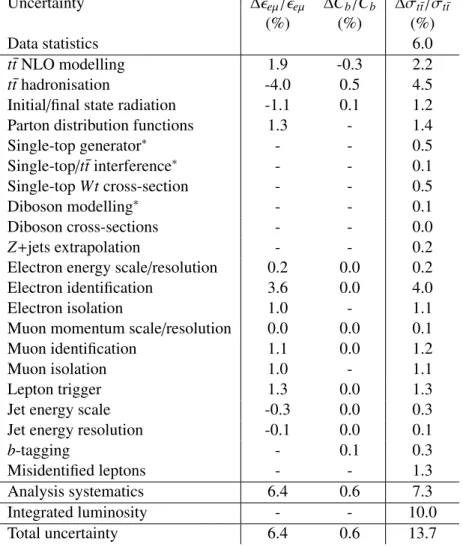
5 Systematic uncertainties
The systematic uncertainties on the extracted cross-section
σtt¯are shown in Table 3, together with their effects (where relevant) on the t¯ t preselection efficiency
eµand tagging correlation C
b. Each source of uncertainty is evaluated by repeating the cross-section extraction with all relevant input parameters simultaneously changed by
±1 standard deviation. Systematic correlations between input parameters (in particular significant anti-correlations between
eµand C
bwhich contribute with opposite signs to
σt¯t) are thus taken into account. The total uncertainties on
σt¯tand
bare calculated by adding the e
ffects of all the individual systematic components in quadrature, assuming them to be independent. The sources of systematic uncertainty are discussed in detail below.
t¯tmodelling:
The modelling uncertainties on
eµdue to the choice of t¯ t generator are assessed by comparing the predictions of the baseline P
owheg +P
ythia6 sample with the various alternative samples discussed in Section 2, all processed using fast simulation. Three separate uncertain- ties are considered: the NLO generator uncertainty (evaluated by considering the relative dif- ference between
aMC@NLO
+H
erwig++and P
owheg +H
erwig++), the shower and hadronisa- tion uncertainty (evaluated by considering the relative di
fference between P
owheg +P
ythia6 and P
owheg +H
erwig++), and the radiation uncertainty (evaluated by considering half the relative dif- ference between the P
owheg +P
ythia6 samples with more or less radiation).
Parton distribution functions:
The uncertainties on
eµand C
bdue to limited knowledge of the proton PDFs are evaluated by reweighting simulated events produced with MadGraph5_aMC@NLO us- ing the error sets of the CT10 [10], MSTW 2008 68 % CL NLO [8, 9] and NNPDF 2.3 PDF [12]
PDF sets. The final uncertainty was calculated as half the envelope encompassing the predictions of all three PDF sets along with their associated uncertainties, following the PDF4LHC recommend- ations [7]. The acceptance uncertainties on the single top backgrounds are taken from the previous publication, where they were evaluated using similar recipes applied to
√s
=8 TeV simulation.
Single top modelling:
These uncertainties are taken from the
√s
=8 TeV publication; the relative dif- ference between generators at
√s
=13 TeV are expected to be similar. In the previous publica-
tion, uncertainties related to Wt single top modelling were assessed by comparing the predictions
Uncertainty
∆eµ/eµ ∆C
b/Cb ∆σt¯t/σt¯t(%) (%) (%)
Data statistics 6.0
t¯ t NLO modelling 1.9 -0.3 2.2
t¯ t hadronisation -4.0 0.5 4.5
Initial
/final state radiation -1.1 0.1 1.2
Parton distribution functions 1.3 - 1.4
Single-top generator
∗- - 0.5
Single-top
/t¯ t interference
∗- - 0.1
Single-top Wt cross-section - - 0.5
Diboson modelling
∗- - 0.1
Diboson cross-sections - - 0.0
Z
+jets extrapolation - - 0.2
Electron energy scale/resolution 0.2 0.0 0.2
Electron identification 3.6 0.0 4.0
Electron isolation 1.0 - 1.1
Muon momentum scale/resolution 0.0 0.0 0.1
Muon identification 1.1 0.0 1.2
Muon isolation 1.0 - 1.1
Lepton trigger 1.3 0.0 1.3
Jet energy scale -0.3 0.0 0.3
Jet energy resolution -0.1 0.0 0.1
b-tagging - 0.1 0.3
Misidentified leptons - - 1.3
Analysis systematics 6.4 0.6 7.3
Integrated luminosity - - 10.0
Total uncertainty 6.4 0.6 13.7
Table 3: Summary of the statistical, systematic and total uncertainties on thett¯production cross-section σt¯t at
√s=13 TeV. The systematic uncertainties on theeµpreselection efficiencyeµand the tagging correlationCbare also shown, with relative signs given where relevant. Uncertainties listed with an asterisk are extrapolated from
√s=8 TeV results, and values given as 0.0 are smaller than 0.05.
between generators and comparing the diagram removal and diagram subtraction schemes for deal- ing with the interference between the t¯ t and Wt final states [48, 49]. Production of single top quarks via the t- and s-channels gives rise to final states with only one prompt lepton, and is accounted for as part of the misidentified-lepton background.
Background cross-sections:
The uncertainties on the Wt single top and diboson cross-sections are taken to be 5.3 % and 10 %, based on the corresponding theoretical predictions.
Diboson modelling:
This uncertainty is taken from the
√s
=8 TeV publication; the numbers at
√s
=13 TeV are expected to be similar. The uncertainties in the backgrounds from dibosons with one
or two additional b-tagged jets were assessed by comparing the baseline prediction from S
herpawith that of Alpgen+Herwig. A diboson modelling uncertainty of 22 % on the one b-tagged jet and
13 % on the two b-tagged jets contribution is used. These uncertainties have a limited effect on the
cross-section measurement due to the low number of diboson background events.
Z+jets modelling:
The cross-sections for Z
+jets and especially Z
+heavy flavour are subject to large theoretical uncertainties, making simulation-based estimates unreliable without validation in data.
This background is cross-checked in data by measuring the rates of Z
→ee and Z
→µµevents with one and two b-tagged jets. Events are selected using the object definitions described in Section 3, requiring b-tagged jets and an opposite-sign electron or muon pair with a dilepton invariant mass in the range 60
<m
`` <120 GeV. In order to extract the Z yields from these samples, the m
``distributions are fitted using two templates derived from simulation, one for Z decays and the other for all other contributions (mainly t¯ t and events with misidentified leptons). The normalisations of the two components are fitted in data. Within the statistics available, the predictions from simulation are compatible with data in the one b-tagged jet channel, and about half the rate seen in data for the two b-tagged jet channel. Given these results, obtained with limited data statistics, the Z
→ττ→eµ
+jets background prediction from simulation is used for both channels, with a 50 % uncertainty for the one b-tagged jet background and a 100 % uncertainty for the two b-tagged jet background.
Lepton-related uncertainties:
The modelling of the electron and muon trigger e
fficiencies, identifica- tion efficiencies, energy scales and resolutions are studied using Z
→ee and Z
→ µµdecays in data and simulation using both
√s
=8 TeV and
√s
=13 TeV data. Small corrections are applied to the simulation better to model the performance seen in data. These corrections have associated uncertainties that are propagated to the cross-section measurement. The uncertainty on the trigger efficiency is small compared to those for electron and muon identification since most events are triggered redundantly by both leptons. The modelling of the isolation requirements made on elec- trons and muons is studied in
√s
=13 TeV data using Z decays, and parameterised as functions of the lepton p
T,
ηand the hadronic activity near the lepton. The isolation efficiencies are found to be generally well modelled, and the measurements are extrapolated to the t¯ t environment to give un- certainties of 1% for both electrons and muons, limited by the size of the available Z
→``samples in data.
Jet-related uncertainties:
Although the e
fficiency to reconstruct and b-tag jets from t¯ t events is ex- tracted from the data, uncertainties in the jet energy scale, energy resolution and reconstruction efficiency affect the backgrounds estimated from simulation and the estimate of the tagging cor- relation C
b. They also have a small e
ffect on
eµvia the lepton-jet
∆R separation cuts. The jet energy scale is varied in simulation according to the uncertainties derived from the
√s
=8 TeV simulation and in-situ calibration, and the uncertainties are extrapolated to
√s
=13 TeV [42]. The uncertainties are evaluated using a simplified model with three orthogonal components which are then added in quadrature. The jet energy resolution uncertainty is assessed using
√s
=8 TeV data, and extrapolated to
√s
=13 TeV.
b-tagging uncertainties:
The correlation C
bdepends weakly on the b-tagging and mistagging e
fficien- cies predicted by the simulation, as it is evaluated from the numbers of events with one and two b-tagged jets. The uncertainties are determined from
√s
=8 TeV data, with some additional uncer- tainties to account for the presence of the new IBL detector and the extrapolation to
√s
=13 TeV.
Since the definition of
eµdoes not involve b-tagged jets, it has no b-tagging or mistagging-related uncertainties.
Misidentified leptons:
The uncertainties on the number of events with misidentified leptons in the one
and two b-tagged samples were derived from the statistical uncertainties on the numbers of same-
sign lepton events, the systematic uncertainties on the opposite- to same-sign ratios R
j, and the
uncertainties on the numbers of prompt same-sign events, as discussed in detail in Section 4.1.
Integrated luminosity:
The uncertainty on the integrated luminosity is 9 %. It is derived, following a methodology similar to that detailed in Ref. [50], from a preliminary calibration of the luminosity scale using a pair of x-y beam-separation scans performed in June 2015. The e
ffect on the cross- section measurement is slightly larger than 9 % because the Wt single top and diboson backgrounds are evaluated from simulation, so they are also sensitive to the assumed integrated luminosity.
The total systematic uncertainties on
eµ, C
band the fitted value of
σt¯tare shown in Table 3, and the total systematic uncertainties on the individual background components are shown in Table 1. The dom- inant uncertainties on the cross-section result come from the luminosity determination, the statistical uncertainty due to the small available dataset, t¯ t modelling and electron identification uncertainties. The uncertainty on the LHC beam energy and the dependence of the cross-section on the assumed mass of the top quark have not been evaluated for this preliminary result, but are expected to be small compared with the total uncertainty.
6 Results and conclusion
The inclusive t¯ t production cross-section is measured using an ATLAS pp collision data sample of 78 pb
−1at
√s
=13 TeV, in the dilepton t¯ t
→eµννb b ¯ decay channel. The numbers of opposite-sign eµ events with one and two b-tagged jets are counted, allowing a simultaneous determination of the t¯ t cross-section
σt¯tand the probability to reconstruct and b-tag a jet from a t¯ t decay. Assuming a top quark mass of m
t =172.5 GeV, the result is:
σt¯t =
825
±49 (stat)
±60 (syst)
±83 (lumi) pb,
where the three uncertainties are due to data statistics, experimental and theoretical systematic effects, and the integrated luminosity, giving a total relative uncertainty of 14 %. This measurement is consistent with the theoretical prediction based on recent NNLO
+NNLL calculations of 832
+−4640pb at m
t =172.5 GeV.
The combined probability for a jet from a top decay to be within the detector acceptance and tagged as a b-jet is measured to be
b =0.527
±0.026
±0.006, where the first error is statistical and the second systematic, in good agreement with the nominal simulation prediction of 0.543.
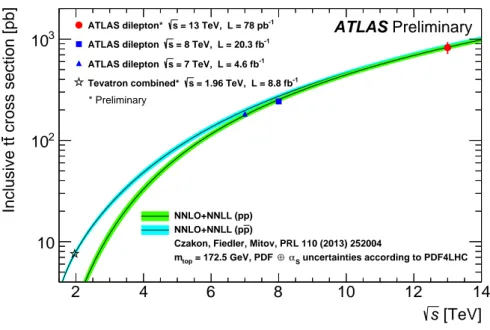
Figure 3 shows the result for
σtt¯together with the most precise ATLAS results at
√s
=7–8 TeV [13]
and the combination of the Tevatron measurements [51]. The data are compared to the NNLO
+NNLL predictions as a function of
√s for both pp and p p ¯ collisions.
References
[1] M. Cacciari et al., Top-pair production at hadron colliders with next-to-next-to-leading logarithmic soft-gluon resummation, Phys. Lett.
B710(2012) 612, arXiv:1111.5869 [hep-ph].
[2] P. Barnreuther et al., Percent Level Precision Physics at the Tevatron: First Genuine NNLO QCD Corrections to q q ¯
→t¯ t
+X, Phys. Rev. Lett.
109(2012) 132001, arXiv:1204.5201 [hep-ph].
[3] M. Czakon and A. Mitov, NNLO corrections to top-pair production at hadron colliders: the
all-fermionic scattering channels, JHEP
1212(2012) 054, arXiv:1207.0236 [hep-ph].
[TeV]
s
2 4 6 8 10 12 14
cross section [pb]tInclusive t
10 102
103 ATLAS Preliminary
* Preliminary
= 13 TeV, L = 78 pb-1
s ATLAS dilepton*
= 8 TeV, L = 20.3 fb-1
s ATLAS dilepton
= 7 TeV, L = 4.6 fb-1
s ATLAS dilepton
= 1.96 TeV, L = 8.8 fb-1
s Tevatron combined*
NNLO+NNLL (pp) ) p NNLO+NNLL (p
Czakon, Fiedler, Mitov, PRL 110 (2013) 252004
uncertainties according to PDF4LHC αS
⊕ = 172.5 GeV, PDF mtop
Figure 3: Cross-section fort¯t pair production in pp and pp¯ collisions as a function of centre-of-mass energy.
ATLAS results in the dileptoneµchannel at √
s=13, 8 and 7 TeV, as well as the Tevatron combination at √ s= 1.96 TeV, are compared to the NNLO+NNLL theory predictions.
[4] M. Czakon and A. Mitov, NNLO corrections to top pair production at hadron colliders: the quark-gluon reaction, JHEP
1301(2013) 080, arXiv:1210.6832 [hep-ph].
[5] M. Czakon, P. Fiedler, and A. Mitov, The total top quark pair production cross-section at hadron colliders through
O(α4S), Phys. Rev. Lett.
110(2013) 252004, arXiv:1303.6254 [hep-ph].
[6] M. Czakon and A. Mitov, Top
++: A Program for the Calculation of the Top-Pair Cross-Section at Hadron Colliders, Comput.Phys.Commun.
185(2014) 2930, arXiv:1112.5675 [hep-ph].
[7] M. Botje et al., The PDF4LHC Working Group Interim Recommendations, arXiv:1101.0538 [hep-ph].
[8] A. Martin, W. Stirling, R. Thorne, and G. Watt, Parton distributions for the LHC, Eur. Phys. J.
C63(2009) 189, arXiv:0901.0002 [hep-ph].
[9] A. Martin, W. Stirling, R. Thorne, and G. Watt, Uncertainties on
αSin global PDF analyses and implications for predicted hadronic cross sections, Eur. Phys. J C
64(2009) 653,
arXiv:0905.3531 [hep-ph].
[10] H.-L. Lai et al., New parton distributions for collider physics, Phys. Rev. D
82(2010) 074024, arXiv:1007.2241 [hep-ph].
[11] J. Gao et al., The CT10 next-to-next-to-leading order global analysis of QCD, Phys.Rev.
D89(2014) 033009, arXiv:1302.6246 [hep-ph].
[12] R. D. Ball et al., Parton distributions with LHC data, Nucl. Phys.
B867(2013) 244,
arXiv:1207.1303 [hep-ph].
[13] ATLAS Collaboration, Measurement of the t t production cross-section using eµ ¯ events with b-tagged jets in pp collisions at
√s
=7 and 8 TeV with the ATLAS detector, Eur. Phys. J. C
74(2014) 3109, arXiv:1406.5375 [hep-ex].
[14] ATLAS Collaboration, The ATLAS Experiment at the CERN Large Hadron Collider, JINST
3(2008) S08003.
[15] ATLAS Collaboration, ATLAS Insertable B-Layer Technical Design Report, ATLAS-TDR-19.
[16] ATLAS Collaboration, The ATLAS Simulation Infrastructure, Eur. Phys. J C
70(2010) 823, arXiv:1005.4568 [physics.ins-det].
[17] S. Agostinelli et al., Geant4: a simulation toolkit, Nucl. Instrum. Meth.
506(2003) 250.
[18] ATLAS Collaboration, The simulation principle and performance of the ATLAS fast calorimeter simulation FastCaloSim, ATLAS-PHYS-PUB-2010-013.
[19] T. Sjöstrand, S. Mrenna, and P. Skands, A Brief Introduction to Pythia 8.1, Comput. Phys.
Commun.
178(2008) 852, arXiv:0710.3820 [hep-ph].
[20] P. Nason, A new method for combining NLO QCD with shower Monte Carlo algorithms, JHEP
0411(2004) 040, arXiv:hep-ph/0409146.
[21] S. Frixione, P. Nason, and C. Oleari, Matching NLO QCD computations with Parton Shower simulations: the POWHEG method, JHEP
0711(2007) 070, arXiv:0709.2092 [hep-ph].
[22] S. Alioli, P. Nason, C. Oleari, and E. Re, A general framework for implementing NLO calculations in shower Monte Carlo programs: the POWHEG BOX, JHEP
1006(2010) 043,
arXiv:1002.2581 [hep-ph].
[23] T. Sjöstrand, S. Mrenna, and P. Skands, Pythia 6.4 Physics and Manual, JHEP
0605(2006) 026, arXiv:hep-ph/0603175.
[24] P. Z. Skands, Tuning Monte Carlo Generators: The Perugia Tunes, Phys.Rev.
D82(2010) 074018, arXiv:1005.3457 [hep-ph].
[25] J. Pumplin et al., New generation of parton distributions with uncertainties from global QCD analysis, JHEP
0207(2002) 012, arXiv:hep-ph/0201195.
[26] D. J. Lange, The EvtGen particle decay simulation package, Nucl. Instrum. Meth.
A462(2001) 152–155.
[27] ATLAS Collaboration, Comparison of Monte Carlo generator predictions to ATLAS measurements of top pair production at
√s
=7 TeV, ATLAS-PHYS-PUB-2015-002.
[28] Particle Data Group Collaboration, J. Beringer et al., Review of Particle Physics (RPP), Phys. Rev.
D86