ATLAS-CONF-2014-007 16March2014
ATLAS NOTE
ATLAS-CONF-2014-007
March 16, 2014
Measurement of the Inclusive and Fiducial Cross-Section of Single Top-Quark t-Channel Events in pp Collisions at √
s = 8 TeV.
The ATLAS Collaboration
Abstract
This note presents the measurement of a t-channel single top-quark production fiducial cross-section in the lepton+jets channel with 20.3 fb
−1of 8 TeV data using a neural-network discriminant. Events are selected by requiring exactly two jets, where one of the jets is re- quired to be b-tagged. Signal events from t-channel single top-quark processes are enhanced using a neural-network discriminant based on final-state observables. The t-channel produc- tion cross-section in the fiducial region is obtained from a binned maximum-likelihood fit to the neural-network discriminant.
A fiducial cross-section quoted within the detector acceptance of
σfid=3.37
±0.05 (stat.)
±0.47 (syst.)
±0.09 (lumi.) pb is obtained. The total inclusive t-channel cross-section is cal- culated using the acceptance predicted by various Monte Carlo generators. If the accep- tance from the aMC@NLO
+H
erwigevent generator is used, a value of
σt =82.6
±1.2 (stat.)
±11.4 (syst.)
±3.1 (PDF)
±2.3 (lumi.) pb is obtained, consistent with the Stan- dard Model prediction. Using the ratio of the measured inclusive cross-section to the pre- dicted cross-section and assuming that the top-quark-related CKM matrix elements obey the relation
|V
tb| ≫ |V
ts|,|V
td|, the coupling strength at the W-t-b vertex is determined to be
|
V
tb|=0.97
+0.09−0.10. Assuming that
|V
tb| ≤1 a lower limit of
|V
tb|>0.78 is obtained at the 95%
confidence level.
c Copyright 2014 CERN for the benefit of the ATLAS Collaboration.
Reproduction of this article or parts of it is allowed as specified in the CC-BY-3.0 license.
1 Introduction
Top quarks can be produced singly via electroweak, charged-current interactions. The cross-section in proton-proton collisions at
√s
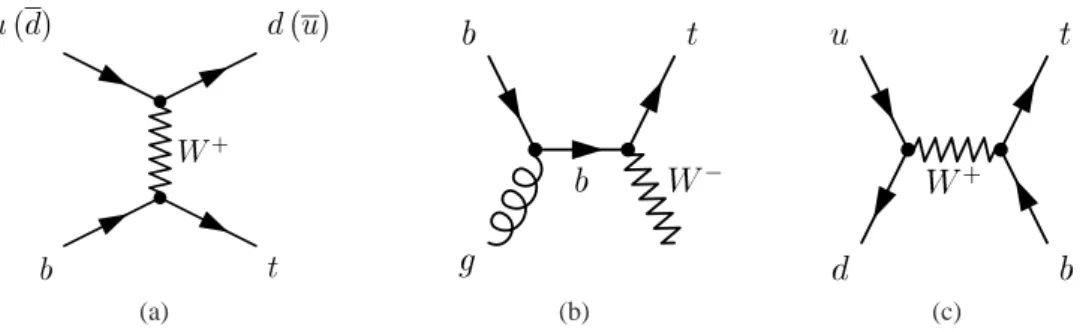
=8 TeV is about half of that for t¯t pair production mediated via the strong interaction. There are three relevant single top-quark subprocesses that are distinguished in leading- order (LO) perturbation theory by the virtuality of the exchanged W boson. The dominant process is the t-channel exchange of a virtual W boson, depicted in Figure 1(a). This mode was measured by ATLAS and CMS at
√s
=7 TeV [1, 2] and at
√s
=8 TeV [3, 4]. The other two processes are Wt production, shown in Figure 1(b), measured for the first time at the LHC with
√s
=7 TeV [5, 6], and s-channel production, presented in Figure 1(c), observed at the Tevatron [7].
W +
b u(d)
t d(u)
(a)
b W
g
b t
(b)
W +
d u
b t
(c)
Figure 1: Feynman diagrams of single top-quark production processes: (a) t-channel production, (b) associated Wt production, and (c) s-channel production.
The single top-quark final state provides a direct probe of the W-t-b coupling and is sensitive to many models of new physics [8]. The measurement of the production cross-section constrains the absolute value of the quark-mixing matrix element V
tb[9, 10] without assumptions about the number of quark generations.
At the LHC for a center-of-mass energy of
√s
=8 TeV, the sum of the t and ¯t cross-sections is predicted at next-to-leading order plus contribution due to the resummation of soft-gluon bremsstrahlung (NLO+NNLL) to be
σt =87.8
+3.4−1.9pb [11] for the t-channel process. The contributions due to the resummation of soft-gluon bremsstrahlung is of the order of 1% and the cross-section predictions are therefore very close to the plain next-to-leading order (NLO) calculation [12]. The predicted cross- sections for Wt associated production at
√s
=8 TeV are
σWt=22.4
±1.5 pb [13] and for the s-channel
σs =5.6
±0.2 pb [14] also calculated at NLO+NNLL precision. The analysis presented in this note considers only the t-channel process as signal, while the other two single top-quark processes are treated as backgrounds with a very small contribution to the total data sample.
Events are selected using the t
→lνb decay mode of the top quark t, where the lepton
ℓcan be either an electron or a muon originating from the W-boson decay. Fully-hadronic final states are not considered because of the overwhelming multijet background. The analysis also has acceptance for signal events involving W
→ τνdecays if the
τdecays leptonically to either eν
eντor
µνµντ. The acceptance for t- channel events is dominated by the two-jet signature, where one jet is a b-quark jet, while the second jet is from a light quark produced together with the top quark, see Fig. 1(a). Thus, the experimental signature of candidate events is given by one charged lepton (electron or muon), large missing transverse momentum, E
missT, and two hadronic jets with high transverse momentum p
T. One of the jets is required to originate from a b-quark, which usually comes from the top-quark decay.
The most important background for single top-quark processes in the lepton+jets channel is the production of a W boson in association with jets ( W
+jets ) production. If one of the jets contains heavy-flavour hadrons, these events have the same signature as signal events. Due to possible misidentification of a light jet as a b-quark jet, W+light jets production also contributes to the background. Another
1
important background comes from t¯t events, which are difficult to separate from single top-quark events.
The next-largest background comes from multijet production, where a hadronic jet is misidentified as an electron or muon, or a real high-p
Tlepton is produced in the semileptonic decay of a heavy-flavour hadron and passes the lepton identification criteria. Other smaller backgrounds come from diboson production (WW, WZ, and ZZ) and Z+jets events.
This note is organised as follows. Section 2 gives an overview of the real and simulated event samples used. The definition of physics objects and the event selection are summarised in Section 3, while the background estimation is detailed in Section 4. Signal and background discrimination using a neural network (NN) is presented in Section 5. Section 6 describes the systematic uncertainties considered in the analysis. The measurement of the t-channel single top-quark cross-section in a fiducial volume defined by the detector acceptance, the estimation of the sensitivity and the uncertainties on the measured cross-section are discussed in Section 7. The results together with the extrapolation of the measured cross-section to the full phase space and the extraction of
|V
tb|are summarised in Section 8.
2 The ATLAS detector and simulated event samples
The ATLAS detector [15] is composed of an inner tracking system close to the interaction point, sur- rounded by a superconducting solenoid providing a 2 T axial magnetic field, electromagnetic and hadronic calorimeters, and a muon spectrometer
1. The electromagnetic calorimeter is a lead/liquid-argon sampling calorimeter (LAr) with high granularity. An steel/scintillator tile calorimeter provides hadronic energy measurements in the central pseudorapidity range. The endcap and forward regions are instrumented with LAr calorimeters for both electromagnetic and hadronic energy measurements. The muon spec- trometer consists of three large superconducting toroids, each with 8 coils, a system of trigger chambers, and precision tracking chambers.
This analysis is performed using proton-proton (pp) collision data recorded at a centre-of-mass en- ergy of
√s
=8 TeV by ATLAS between April 5th and December 6th, 2012. Only the periods in which all the sub-detectors were operational are considered, resulting in a data sample with a total integrated luminosity
L=20.3 fb
−1. The mean number of interactions per bunch crossing for this dataset is about 21.
Detector and trigger simulations are performed within the GEANT4 framework [16, 17]. The same offline reconstruction methods used with data events are applied to the simulated samples. Minimum bias events generated by P
ythia8 [18] are used to simulate multiple pp interactions in the same and nearby bunch crossings, corresponding to the LHC operation with 50 ns bunch separation and an average of 18 additional pp interactions per bunch crossing. The simulated pileup conditions are reweighted to match the conditions of the data sample.
Electroweak t-channel single top-quark events are generated using the A
cerMC [19] generator and the leading order (LO) parton density functions (PDFs) from CTEQ6L1 [20]. A
cerMC includes two t-channel subprocesses: qb
→q
′t and qg
→q
′t ¯b. Events generated according to the 2
→2 and 2
→3 processes are combined to one consistent sample based on an implementation of the ACOT [21] matching prescription to avoid kinematic overlaps. The factorisation
µfand renormalisation
µrscales are set to
µr = µf =m
t, with a top-quark mass m
tof 172.5 GeV, and the parton shower and the underlying event are simulated using P
ythia6 [22] with the CTEQ6L1 PDF sets and the corresponding Perugia 2011C tune [23].
1In the right-handed ATLAS coordinate system, the pseudorapidityηis defined asη = −ln[tan(θ/2)], where the polar angleθis measured with respect to the LHC beam-line. The azimuthal angleφis measured with respect to the x-axis, which points towards the centre of the LHC ring. The z-axis is parallel to the anti-clockwise beam viewed from above. Transverse momentum and energy are defined as pT = p sinθand ET = E sinθ, respectively. The angular distance∆R is defined as
∆R=p
(∆η)2+(∆φ)2.
Since this analysis is used, after measuring a fiducial cross-section, to compare available generators with each other, alternative t-channel single top-quark samples are generated. With the aMC@NLO event generator [24] a sample of events are produced, which implements the next-to-leading order (NLO) cal- culation of 2
→3 process in four-flavour schema. The events are generated using the fixed four-flavour PDF set CT104f [25] and the scales are calculated event-by-event [26] with
µr = µf =4
·q
m
2b+p
2T,b, where m
band p
T,bare the mass and p
Tof the b-quark from the initial gluon splitting. The parton shower, hadronisation and underlying event are modelled with the generators H
erwig(v6.520) [27] and J
immy(v4.31) [28] together with the ATLAS AUET2 tune [29].
A second generator capable of generating t-channel single top-quark events at NLO is the P
owheggenerator. Events are generated either in the four-flavour schema [26] using the CT104f PDF sets and renormalisation and factorisation scales are set to be the same as for the samples generated with aMC@NLO or in the five-flavour schema [30] using the CT10 PDF sets and
µr =µf =m
t. In both cases the parton shower and the underlying event are simulated using P
ythia6 with the CTEQ6L1 PDF sets and the corresponding Perugia 2011C tune.
The P
owheg[31] generator with the CT10 PDF set is used to generate t¯t, Wt and s-channel single top- quark events. The parton shower with the underlying event is added using P
ythia6 and the Perugia2011C tune. For systematic studies of the t¯t, Wt and s-channel single top-quark processes the same events are interfaced to the H
erwig(v6.520) and J
immy(v4.31) generators with the ATLAS AUET2 tune. Initial and final state radiation (ISR/FSR) effects in t¯t events are studied with the A
cerMC generator interfaced to P
ythia6 for the hadronisation. Under this schema, ISR and FSR can be adjusted separately via variation of 1/Λ
IS RQCD, the coherence imposed to the first emission in space-like parton shower, the
ΛFS RQCDscale and the FSR parton shower cut-off. All top-quark processes are produced with a top-quark mass of 172.5 GeV.
To model the W boson and Z boson backgrounds dedicated generators are used. In order to gener- ate exclusive processes of the same order in pertubation theory for different observed jet multiplicities, processes with a different number of additional partons are merged together. Similar approaches are implemented in the S
herpa[32] and ALPGEN [33] generators. For this analysis S
herpa(v.1.4.1), which is used to generate the hard process, the parton shower and hadronisation, and the underlying event, is used with the CT10 PDF set. S
herpauses the CKKW method [34] to remove overlaps between the n and n
+1 parton samples. The removal of double counting between the inclusive W
+n parton samples and samples with associated heavy-flavour quark pair-production (W/Z
+HF) is done consistently by using massive c and b quarks in the shower.
Finally, di-boson events (WW, WZ and ZZ) are produced using the H
erwigand J
immy(v4.31) gen- erators with the ATLAS AUET2 tune.
3 Event selection
Based on the expected signature of signal events, we select events with exactly one isolated electron or muon, missing transverse momentum and two jets, of which one is required to be identified as a b-quark jet. Events are considered only if they are accepted by a single-lepton trigger [35]. We employed two single-electron triggers, with thresholds of E
T >24 GeV for isolated electrons or E
T >60 GeV with no isolation criteria, and two single-muon triggers with p
T >24 GeV with, or p
T >36 GeV with- out, isolation criteria. Offline electron candidates are defined as clusters of cells in the electromagnetic calorimeter associated with a well-measured track fulfilling several quality requirements [36]. Electron candidates are required to satisfy p
T >25 GeV and
|ηclus|<2.47, where
ηclusis the pseudorapidity of the cluster of energy deposits in the calorimeter. A veto is placed on electron candidates in the calorimeter barrel-endcap transition region, 1.37
< |ηclus| <1.52, which has a limited calorimeter instrumentation.
3
High-p
Telectrons associated from the W-boson decay can be mimicked by hadronic jets, electrons from the decay of heavy quarks, and photon conversions. These backgrounds can be suppressed by isolation criteria which require minimal calorimeter activity and only low-p
Ttracks in an
η-φcone around the electron candidate. Isolation cuts optimized to achieve a uniform isolation efficiency across
ηclusand the transverse energy E
Tare applied to the electron candidates. For the calorimeter isolation a cone size of
∆R= p
(∆η)
2+(∆φ)
2 =0.2 is used. In addition, the p
Tof all tracks within a cone of radius
∆R=0.3 around the electron direction, excluding the track belonging to the electron, is restricted to be below an E
T-dependent threshold.
Muon candidates are reconstructed by matching track segments or complete tracks in the muon spec- trometer with inner detector tracks. The final candidates are required to have a transverse momentum p
T >25 GeV and to be in the pseudorapidity region of
|η|<2.5. Isolation criteria are applied to reduce background events in which a high-p
Tmuon is produced in the decay of a heavy flavour quark. An isola- tion with variable cone size [37] (mini-isolation) is defined as the scalar sum of the transverse momenta from all tracks with p
Tabove 1 GeV (except the one matched to the muon) within a cone with radius R
iso =10 GeV/ p
T(µ). Muon candidates are accepted with a mini-isolation to muon p
Tratio of less than 0.05.
Jets are reconstructed using the anti-k
talgorithm [38] with a width parameter of 0.4, starting from calorimeter energy clusters calibrated using the local cluster weighting method [39], and corrected for the effects of pileup as described in [40]. Jets were calibrated using an energy- and
η-dependentsimulation-based calibration scheme, with in-situ corrections based on data [41], and required to satisfy p
T >30 GeV and
|η| <4.5. Jets in the endcap-forward calorimeter transition region, corresponding to 2.75
<|η|<3.5, must have p
T >35 GeV. If any jets fall within
∆R<0.2 of an electron, the closest jet is removed, as in these cases the jet and the electron are very likely to correspond to the same physical object. Remaining electron candidates overlapping with jets within
∆R<0.4 are subsequently rejected.
To reject jets from pile-up events, a so-called jet-vertex fraction criterion is applied, where at least 50%
of the scalar sum of the p
Tof tracks matched to a jet is required to be from tracks compatible with the primary vertex
2. This criterion is only applied to jets with p
T <50 GeV and
|η| <2.4. One of the selected jets is required to have p
T >30 GeV and be identified (b-tagged) as a b-quark jet. The tagging algorithm exploits the properties of a b-quark decay in a jet using neural-network techniques and the reconstruction of a secondary vertex [42] and is optimized to reject c-quark induced jets as well as light- quark jets. The b- and c-tagging efficiencies, and the mis-tag rate for the taggers, are measured using the methods described in Ref. [43, 44, 45, 46] updated using the 2012 data set. The b-tagging algorithm has an efficiency of about 50% for b-jets in simulated t¯t events, while only 0.1% of light-quark jets and 3.7%
of c-quark jets are mis-tagged as b-quark jets.
The magnitude of the missing transverse momentum vector is defined as E
missT = |E
~missT |, where E
~missTis calculated using the calibrated three-dimensional calorimeter energy clusters associated with the jets together with either the calibrated calorimeter energy cluster associated with an electron or the p
Tof a muon track [47]. Transverse energy deposited in calorimeter cells but not associated with any high-p
Tobject is also included in the E
missTcalculation. Due to the presence of a neutrino in the final state of the signal process, candidate events must have E
Tmiss >30 GeV. In order to reduce the number of multijet background events, which are characterised by low E
missTand low transverse W-boson mass
3m
T(W), the event selection requires m
T(W)
>50 GeV. Multijet events are further reduced by applying an additional isolation cut to the lepton for leptons with low p
T. This is realised by the following condition between
2The primary vertex is defined as the vertex with the largestP
p2T of the associated tracks and is taken to be the hard- scattering collision.
3The transverse W boson mass is defined as: mT(W) = q
2h
pT(ℓ)EmissT −~pT(ℓ)·E~missT i
, where~pT(ℓ) denotes the transverse momentum of the lepton and pT(ℓ)=|~pT(ℓ)|
the lepton p
Tand the
∆φ( j
1, ℓ):p
T(ℓ)
>40 GeV 1
− π− |∆φ( j
1, ℓ)| π−1
!
,
(1)
where
ℓdenotes the identified charged lepton and j
1the reconstructed jet with the highest p
T.
Three kinematical regions are defined in this analysis, all three being subject to the same event selection requiring exactly one lepton, missing transverse momentum from the neutrino and exactly one or two b-tagged jets:
•
The signal region (SR) using the default b-tagging requirement and selecting exactly one b-tagged jet.
•
The W-boson control region (W CR) selects exactly one b-tagged jet, but with a less stringent b- tagging requirement with a b-tagging efficiency of 85%. Events contained in the SR are rejected.
The control region definition means that the composition of the resulting sample is dominated by W+jets production and that the same object definitions can be used as in the signal region in order to check the correct modelling of kinematic variables.
•
Events in the t¯t control region (t¯t CR) are required to have exactly two b-tagged jets using the default b-tagging requirement. This control region is defined to be highly enriched in t¯t events.
4 Background estimation
For all background processes, except the multijet background, the normalisations are estimated by using Monte Carlo simulation scaled to the theoretical cross-section predictions. SM single top-quark produc- tion cross-sections are calculated at approximate NNLO as detailed in Section 1. The t¯t cross-section is
σt¯t=253 pb. It has been calculated at next-to-next-to leading order (NNLO) in QCD including resum- mation of next-to-next-to-leading logarithmic (NNLL) soft gluon terms with top++2.0 [48, 49, 50, 51, 52, 53]. The PDF and
αSuncertainties were calculated using the PDF4LHC prescription [54] with the MSTW2008 NNLO [55], CT10 NNLO [56] and NNPDF2.3 PDF sets added in quadrature to the scale uncertainty and yield 5.9%.
The inclusive cross-sections of W/Z-boson production are calculated to NNLO with FEWZ [57] with an uncertainty of
±4%. For the W+jets and Z+jets backgrounds in association with two additional jets the uncertainty is conservatively estimated from the Berends-Giele scaling [58, 59] (W
+n
+1/W
+n) and yields
±34%.
Diboson events (WW, WZ and ZZ) are normalised to the NLO cross-section prediction. The cross- section uncertainty for these processes is 5%.
Multijet events may be selected if a jet is misidentified as an isolated lepton or if the event has a non- prompt lepton that appears to be isolated. Different methods are used to estimate this background in the electron and muon channels. In the electron channel a jet-lepton model is obtained by selecting simulated multi-jet events with jets that have similar properties to the ones of the selected electrons. Each jet has to fulfill the same p
Tand
ηrequirements as a signal lepton, contain at least four tracks to reduce the contri- bution from converted photons, and deposit 80–95% of its energy in the electromagnetic calorimeter. To avoid a contamination of the jet-electron sample by real electrons, events are vetoed if they contain one or more leptons that are identified according to high-efficiency but low-purity identification criteria. The event is accepted if exactly one ‘jet-lepton’ is found.
In the muon channel, an anti-muon method, which builds a multijet model derived from collision data, is used. In order to select a sample that is highly enriched with muons from multijet events, some of the muon identification cuts are inverted or changed.
5
To determine the normalisation of the multijets background template, a binned maximum likelihood fit is performed to the observed data in the E
missTdistribution after applying all selection criteria, leav- ing out the cut on E
Tmissonly. In the electron channel, the fits are performed separately in the endcap (
|η| >1.5) and central (
|η| <1.5) region of the electromagnetic calorimeter. The multijet template is fitted together with templates derived from MC simulation for all other background processes whose rate uncertainties are accounted for in the fitting process in the form of additional constrained nuisance parameters. For the purpose of these fits the contributions from W
+jets, the contributions from t¯t andsingle top-quark production (top), and the contributions from Z
+jets and diboson production, were eachjoined into one template. To account for the similar shape of the Z+jets contributions with respect to the W+jets backgrounds in the E
Tmissdistribution, the rate for Z+jets is fixed in the fitting process. Based on comparisons of the rates obtained using alternative methods, a systematic uncertainty of 50% on the estimated multijet fractions is assigned. The alternative methods consist of using the matrix method [60]
or interchanging the models used for electrons with the ones used for muons and vice versa, as well as choosing different variables, i.e. m
T(W) instead of E
Tmissfor the binned maximum-likelihood fit. The corresponding E
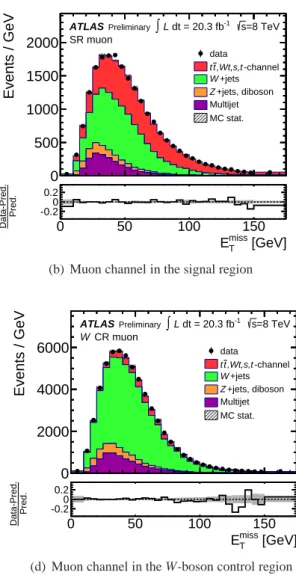
missTdistributions after rescaling the different backgrounds and the multijets template to their respective fit results are shown in Figure 2 for both the electron and muon channel. The estimated event rates obtained from the binned maximum-likelihood fit for the combined contributions of W
+jetsand W+HF jets and of t¯t and single top-quark production are not used in the later analysis and are only applied to scale the respective backgrounds in order to check the modelling of the kinematic distribu- tions. For the later neural-network training, as well as for the final statistical analysis, the normalisation for all but the multijets background is taken solely from MC simulations scaled to their respective theory cross-section predictions.
In the signal region 143332 events are observed in data while the expectation from SM backgrounds amounts to 142000
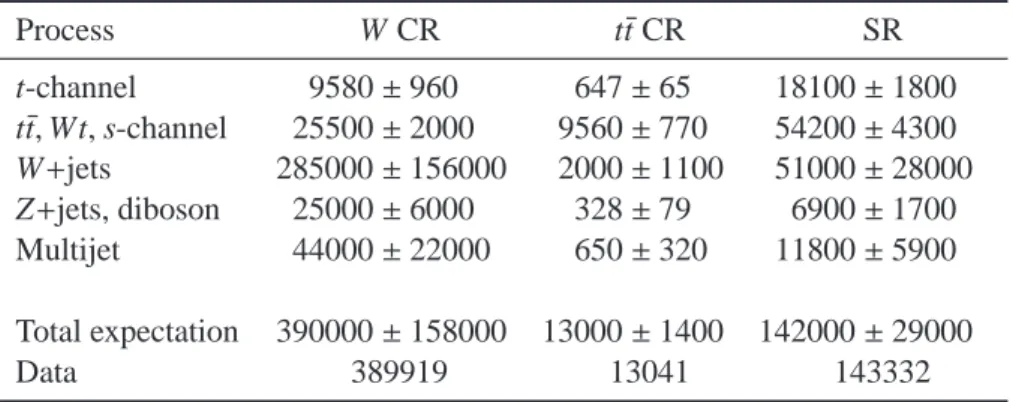
±29000 events. Table 1 summarises the event yields in the signal region and the two control regions for each of the background processes considered together with the event yields for the signal process. The yields in the signal and control regions are calculated using the acceptance from MC samples normalised to their respective theoretical cross-sections including the (N)NLO k factors. Each event yield uncertainty is defined by the uncertainty of the theoretical cross-section or, in case of the multijet background, the uncertainty of the normalisation.
Table 1: Predicted and observed event yields for the signal region and the two control regions, where the electron and muon channels are added together. The multijet background estimation is derived from collision data based on the two fitting methods in the electron channels and in the muon channels. All the other expectations are derived using theoretical cross-sections, and the uncertainties listed are theoretical.
Process W CR t¯t CR SR
t-channel 9580
±960 647
±65 18100
±1800
t¯t
,Wt, s-channel 25500
±2000 9560
±770 54200
±4300 W+jets 285000
±156000 2000
±1100 51000
±28000 Z+jets, diboson 25000
±6000 328
±79 6900
±1700
Multijet 44000
±22000 650
±320 11800
±5900
Total expectation 390000
±158000 13000
±1400 142000
±29000
Data 389919 13041 143332
[GeV]
miss
ET
Events / GeV
0 500 1000
[GeV]
miss
ET
0 50 100 150
Pred.Data-Pred.
-0.20.20
SR central electron Preliminary
ATLAS ∫L dt = 20.3 fb-1 s=8 TeV
data
-channel ,Wt,s,t t t
+jets W
+jets, diboson Z
Multijet MC stat.
(a) Central electron channel in the signal region
[GeV]
miss
ET
Events / GeV
0 500 1000 1500 2000
[GeV]
miss
ET
0 50 100 150
Pred.Data-Pred.
-0.20.20
SR muon Preliminary
ATLAS ∫L dt = 20.3 fb-1 s=8 TeV
data
-channel ,Wt,s,t t t
+jets W
+jets, diboson Z
Multijet MC stat.
(b) Muon channel in the signal region
[GeV]
miss
ET
Events / GeV
0 1000 2000 3000 4000
[GeV]
miss
ET
0 50 100 150
Pred.Data-Pred.
-0.20.20
CR central electron W
Preliminary
ATLAS ∫L dt = 20.3 fb-1 s=8 TeV
data
-channel ,Wt,s,t t t
+jets W
+jets, diboson Z
Multijet MC stat.
(c) Central electron channel in the W-boson control re- gion
[GeV]
miss
ET
Events / GeV
0 2000 4000 6000
[GeV]
miss
ET
0 50 100 150
Pred.Data-Pred.
-0.20.20
CR muon W
Preliminary
ATLAS ∫L dt = 20.3 fb-1 s=8 TeV
data
-channel ,Wt,s,t t t
+jets W
+jets, diboson Z
Multijet MC stat.
(d) Muon channel in the W-boson control region
[GeV]
miss
ET
Events / GeV
0 20 40 60 80
[GeV]
miss
ET
0 50 100 150
Pred.Data-Pred.
-0.20.20
CR central electron t
t
Preliminary
ATLAS ∫L dt = 20.3 fb-1 s=8 TeV
data
-channel ,Wt,s,t t t
+jets W
+jets, diboson Z
Multijet MC stat.
(e) Central electron channel in the top control region
[GeV]
miss
ET
Events / GeV
0 50 100 150
[GeV]
miss
ET
0 50 100 150
Pred.Data-Pred.
-0.20.20
CR muon t t
Preliminary
ATLAS ∫L dt = 20.3 fb-1 s=8 TeV
data
-channel ,Wt,s,t t t
+jets W
+jets, diboson Z
Multijet MC stat.
(f) Muon channel in the top control region
Figure 2: Observed and simulated E
missTdistributions for the signal region ((a),(b)), the W-boson control- region ((c),(d)), and the t¯t control-region ((e),(f)) for electrons (left) and muons (right), respectively. The normalisation is obtained from the maximum binned-likelihood fit to the E
missTdistributions. The hatched error band represents the uncertainty on the limited sample size. The relative difference (O
i −E
i)/E
ibetween the observed O
iand expected E
inumber of events in each bin i is shown in the lower histogram.
Events beyond the axis range are included in the last bin. 7
5 Signal discrimination
To separate t-channel single top-quark signal events from the expected background, several kinematic variables are combined into one discriminant by employing a neural network. A large number of po- tential input variables have been studied, including kinematic variables of the identified physics objects, but also variables obtained from the reconstruction of the W-boson and the top-quark. In this calculation the transverse momentum of the neutrino is given by the x- and
y-components of the EmissTvector, while the unmeasured z-component of the neutrino momentum p
z(ν) is inferred by imposing a W-boson mass constraint on the lepton-neutrino system. Since the constraint leads to a quadratic equation for p
z(ν), a two-fold ambiguity arises. In the case of two real solutions, the one with the lower
|p
z|is chosen. In the case of complex solutions which can occur due to the limited E
missTresolution, a fit is performed that rescales the neutrino p
xand p
ysuch that the imaginary radical vanishes and at the same time keeps the transverse components of the neutrino as close as possible to the x- and
y-components of ETmiss.
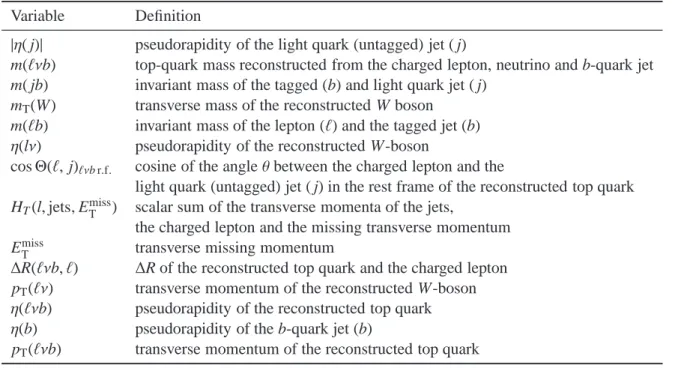
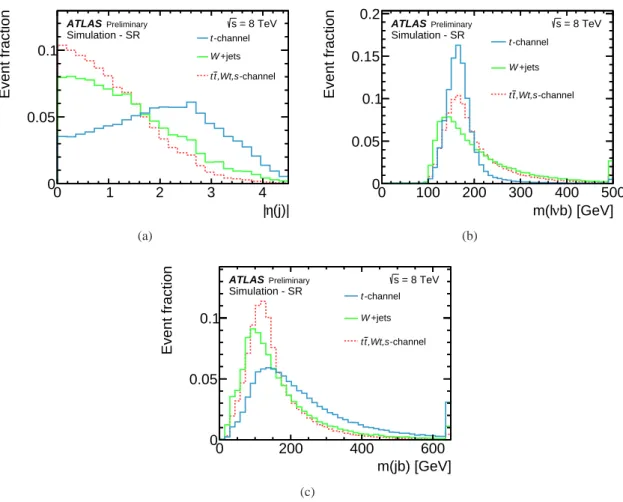
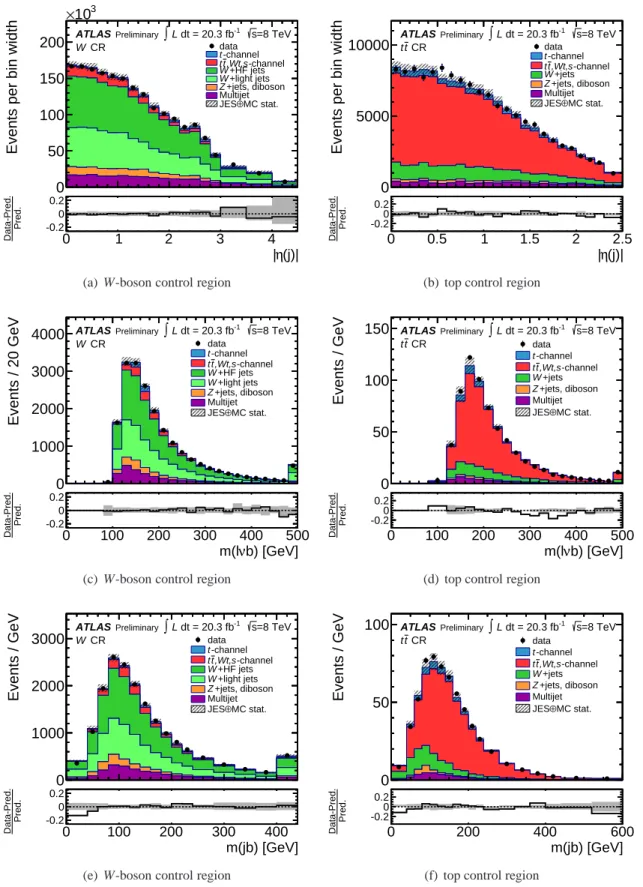
As a compromise between discrimination power and the need for a manageable number of variables, the 14 highest-ranking variables are chosen and are listed in Table 2. The distributions of the three most important variables are shown in Figure 3 normalised to unit area and in Figure 4 normalised to the number of expected events, obtained from the fit on the E
Tmissdistributions described in Section 4, compared with the distribution obtained from collision data.
Table 2: The 14 variables which are used in the training of the neural network ordered by their impor- tance.
Variable Definition
|η( j)|
pseudorapidity of the light quark (untagged) jet ( j)
m(ℓνb) top-quark mass reconstructed from the charged lepton, neutrino and b-quark jet m( jb) invariant mass of the tagged (b) and light quark jet ( j)
m
T(W) transverse mass of the reconstructed W boson m(ℓb) invariant mass of the lepton (ℓ) and the tagged jet (b)
η(lν)
pseudorapidity of the reconstructed W-boson
cos
Θ(ℓ,j)
ℓνb r.f.cosine of the angle
θbetween the charged lepton and the
light quark (untagged) jet ( j) in the rest frame of the reconstructed top quark H
T(l, jets, E
missT) scalar sum of the transverse momenta of the jets,
the charged lepton and the missing transverse momentum E
Tmisstransverse missing momentum
∆R(ℓνb, ℓ) ∆R of the reconstructed top quark and the charged lepton
p
T(ℓν) transverse momentum of the reconstructed W-boson
η(ℓνb)
pseudorapidity of the reconstructed top quark
η(b)
pseudorapidity of the b-quark jet (b)
p
T(ℓνb) transverse momentum of the reconstructed top quark
This analysis uses the NeuroBayes [61, 62] tool which combines a three-layer feed-forward NN with
complex preprocessing of the input variables. NeuroBayes uses Bayesian regularisation techniques for
the training process. The network infrastructure consists of one input node for each input variable plus
one bias node, an arbitrary, user-defined number of hidden nodes, and one output node which gives
a continuous output in the interval [0, 1]. In this specific case 15 nodes in the hidden layer are used
and the ratio of signal to background events in the training was chosen to be 50:50, where the different
η(j)|
|
0 1 2 3 4
Event fraction
0 0.05 0.1
-channel t
+jets W
-channel ,Wt,s t t Simulation - SR
Preliminary
ATLAS s = 8 TeV
(a)
b) [GeV]
ν m(l
0 100 200 300 400 500
Event fraction
0 0.05 0.1 0.15
0.2
-channel t
+jets W
-channel ,Wt,s t t Simulation - SR
Preliminary
ATLAS s = 8 TeV
(b)
m(jb) [GeV]
0 200 400 600
Event fraction
0 0.05 0.1
-channel t
+jets W
-channel ,Wt,s t t Simulation - SR
Preliminary
ATLAS s = 8 TeV
(c)
Figure 3: Distributions of the three most important discriminating variables: (a) the
ηof the untagged jet, (b) the reconstructed top-quark mass, and (c) the invariant mass of the jet pair. The signal shape is shown together with the shape of the two largest backgrounds. Each shape is normalized to unit area.
Events beyond the axis range are included in the last bin.
background processes are weighted according to their number of expected events.
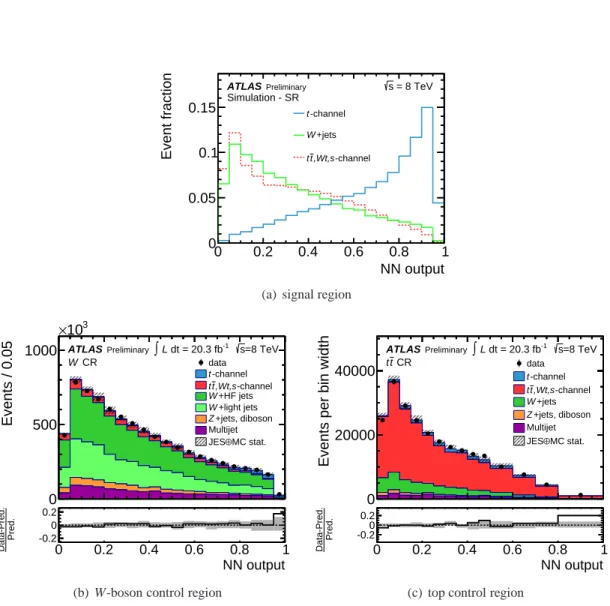
The shape of the resulting NN output distributions for the signal and the two largest backgrounds are shown in Figure 5 together with the data distributions and compared to the prediction in the control regions.
9
η(j)|
|
Events per bin width
0 50 100 150 200
103
×
η(j)|
|
0 1 2 3 4
Pred.Data-Pred.
-0.2 0 0.2
CR W
Preliminary
ATLAS ∫L dt = 20.3 fb-1 s=8 TeV data
-channel t
-channel ,Wt,s t t +HF jets W
+light jets W+jets, diboson ZMultijet
MC stat.
⊕ JES
(a) W-boson control region
η(j)|
|
Events per bin width
0 5000 10000
η(j)|
|
0 0.5 1 1.5 2 2.5
Pred.Data-Pred.
-0.20.20 CR t t
Preliminary
ATLAS ∫L dt = 20.3 fb-1 s=8 TeV data
-channel t
-channel ,Wt,s t t +jets W
+jets, diboson Z
Multijet MC stat.
⊕ JES
(b) top control region
b) [GeV]
ν m(l
Events / 20 GeV
0 1000 2000 3000 4000
b) [GeV]
ν m(l
0 100 200 300 400 500
Pred.Data-Pred.
-0.2 0 0.2
CR W
Preliminary
ATLAS ∫L dt = 20.3 fb-1 s=8 TeV data
-channel t
-channel ,Wt,s t t
+HF jets W
+light jets W
+jets, diboson Z
Multijet MC stat.
⊕ JES
(c) W-boson control region
b) [GeV]
ν m(l
Events / GeV
0 50 100 150
b) [GeV]
ν m(l
0 100 200 300 400 500
Pred.Data-Pred.
-0.20.20 CR t t
Preliminary
ATLAS ∫L dt = 20.3 fb-1 s=8 TeV data
-channel t
-channel ,Wt,s t t
+jets W
+jets, diboson Z
Multijet MC stat.
⊕ JES
(d) top control region
m(jb) [GeV]
Events / GeV
0 1000 2000 3000
m(jb) [GeV]
0 100 200 300 400
Pred.Data-Pred.
-0.2 0 0.2
CR W
Preliminary
ATLAS ∫L dt = 20.3 fb-1 s=8 TeV data
-channel t
-channel ,Wt,s t t +HF jets W
+light jets W
+jets, diboson Z
Multijet MC stat.
⊕ JES
(e) W-boson control region
m(jb) [GeV]
Events / GeV
0 50 100
m(jb) [GeV]
0 200 400 600
Pred.Data-Pred.
-0.20.20 CR t t
Preliminary
ATLAS ∫L dt = 20.3 fb-1 s=8 TeV data
-channel t
-channel ,Wt,s t t
+jets W
+jets, diboson Z
Multijet MC stat.
⊕ JES
(f) top control region
Figure 4: Distributions of the three most important variables normalized to the number of expected events
for the W-boson control region (left) and the t¯t control region (right). The hatched error band represents
the uncertainty on the combined jet energy scale and the uncertainty on the limited sample size. The
relative difference (O
i−E
i)/E
ibetween the observed O
iand expected E
inumber of events in each bin i
is shown in the lower histogram. Events beyond the axis range are included in the last bin.
NN output
0 0.2 0.4 0.6 0.8 1
Event fraction
0 0.05 0.1
0.15 t-channel
+jets W
-channel ,Wt,s t t Simulation - SR
Preliminary
ATLAS s = 8 TeV
(a) signal region
NN output
Events / 0.05
0 500 1000
103
×
NN output
0 0.2 0.4 0.6 0.8 1
Pred.Data-Pred.
-0.2 0 0.2
CR W
Preliminary
ATLAS ∫L dt = 20.3 fb-1 s=8 TeV data
-channel t
-channel ,Wt,s t t
+HF jets W
+light jets W
+jets, diboson Z
Multijet MC stat.
⊕ JES
(b) W-boson control region
NN output
Events per bin width
0 20000 40000
NN output
0 0.2 0.4 0.6 0.8 1
Pred.Data-Pred.
-0.20.20 CR t t
Preliminary
ATLAS ∫L dt = 20.3 fb-1 s=8 TeV data
-channel t
-channel ,Wt,s t t
+jets W
+jets, diboson Z
Multijet MC stat.
⊕ JES
(c) top control region
Figure 5: Distributions of the neural-network output: Signal and background discriminant distributions normalized to unit area (a). Observed signal and simulated background output distribution normalised to the number of expected events in the W+jets control region (b) and the t¯t control region (c). The hatched error band represents the uncertainty on the combined jet energy scale and the uncertainty on the limited sample size. The relative difference (O
i −E
i)/E
ibetween the observed O
iand expected E
inumber of events in each bin i is shown in the lower panel.
11
6 Systematic uncertainties
Systematic uncertainties on the normalisation of the individual backgrounds and on the signal accep- tance as well as uncertainties on the shape of the individual predictions affect the measured t-channel cross-section. Both rate and shape uncertainties are taken into account by generating correlated pseudo- experiments. The impact of the systematic uncertainties on the t-channel cross-section measurement is estimated from these pseudo-experiments. The uncertainties are split into the following categories:
Object modelling
Systematic uncertainties for the reconstruction and energy calibration of jets, elec- trons and muons are propagated through the analysis. The main source of object modelling uncertainty comes from the jet energy scale (JES), including the modelling of pile-up, as well as b-jet identification.
Other components include lepton energy scale and lepton and jet identification efficiencies.
The mis-modelling of lepton trigger, reconstruction and selection efficiencies in simulations are cor- rected for by factors derived from efficiency measurements using Z
→ee or Z
→µµdecays in collision data. Those Z
→ℓℓprocesses are also used to measure the lepton momentum scale and resolution. Cor- rection factors and associated uncertainties are derived to match the simulation to observed distributions in collision data.
The JES uncertainty has been evaluated for the in-situ jet calibration [39, 41], that uses Z+jet,
γ+jet,and dijet p
T-balance measurements in data. The uncertainty is evaluated in several categories: detec- tor, statistical, physics modelling,
ηintercalibration, mixed detector and modelling, and single particle.
The
η-intercalibration technique tests the calibration of the forward region, exploiting the transverse mo-mentum balance in events with two high-p
Tjets. The dominant systematics uncertainty comes from the modelling of additional parton radiation and is estimated by comparing dijet events simulated with P
ythia6 and H
erwig. A detailed description of the different categories can be found in Refs. [41, 63].
Additional contributions to this uncertainty due to the larger pile-up effects in 2012 data are included and range from less than 2% to 7% as a function of jet p
Tand
η[40]. For b-quark induced jets, an addi- tional flavour-specific jet energy scale uncertainty of 0.8% to 2.5%, depending on the jet p
T, is added in quadrature to the JES uncertainty. The uncertainty on the limited knowledge of the jet energy resolution is modelled by varying the p
Tof the jets according to the systematic uncertainties of the resolution mea- surement performed on data using the dijet balance method [64]. The effect of uncertainties associated with the jet vertex fraction is also considered for each jet.
The impact of a possible miscalibration of the E
Tmissis assessed by changing the energy scale and resolution of the soft calorimeter energy deposits within their uncertainties. These energy deposits, which are not included in the reconstructed jets and leptons, only contribute to E
missT.
Correction factors evaluated from collision data are applied to correct the b-tagging performance in simulated events to match the data. Both b-jets and c-jets in simulation use correction factors with uncertainties that depend on the p
Tand
ηof the jet. The uncertainties on the correction factors vary from 2% to 8% for b-quark jets [65], and 10% to 20% for c-quark jets [43, 44], while for light jets the mis- tagging uncertainty ranges from 20% to 40% as a function of jet p
Tand
η[45]. Other minor uncertainties are assigned to the reconstruction of E
missTand to account for the impact of pile-up collisions on E
missT.
Monte Carlo generatorsSystematic effects from MC modelling of the t¯t production, s-channel and Wt single top-quark production are estimated by comparing samples produced with MC@NLO
+H
erwigand P
owheg+P
ythia6 to account for differences in the modelling of the parton shower and hadroniza- tion. The generator uncertainty on the signal sample is estimated by comparing the A
cerMC
+Pythia6 sample with a sample generated with aMC@NLO
+Herwigaccounting for differences of the parton shower and hadronization as well as for the scale choice. More details about the two samples are given in Section 2.
An additional contribution for t¯t production comes from the modelling of initial-state and final-state
radiation, estimated using dedicated A
cerMC samples interfaced to PYTHIA where parameters control- ling the ISR/FSR emission are varied up and down in accordance with data [66]. The impact of using simulation samples of limited size is also taken into account.
The systematic uncertainties related to the parton distribution functions are taken into account for all single top-quark processes, the t¯t production and the W
+jets process. The events are reweightedaccording to each of the PDF uncertainty eigenvectors. The uncertainties are calculated using the formula given in Equation 43 of Ref. [67]. The envelope of the estimated uncertainties for the CT10 PDF set, the MSTW2008nlo [68] PDF set and the NNPDF2.3 [69] is taken as the final PDF uncertainty. A shape uncertainty constructed by the maximum bin-by-bin deviation to either PDF set is taken into account in the measurement. The resulting envelope of maximum deviation is then symmetrized.
Background normalisation
The t¯t, single top Wt- and s-channel backgrounds are normalised to their theory predictions, to which a combined uncertainty of 6.6% is assigned. The uncertainty on the com- bined Z+jets and diboson background is 10% with an additional heavy flavour uncertainty for Z+jets of 50%, while the uncertainties of the W
+jets background including HF fraction are 60% The multijetbackground estimate has an uncertainty of 50%. More details of the theoretical uncertainties are given in Section 4.
Luminosity
The uncertainty on the integrated luminosity is 2.8%. It was estimated using the tech- niques described in Reference [70].
The systematic uncertainties discussed above cause variations in the signal acceptance, the back- ground rates and the shape of the neural-network output-distribution. As an example, Figure 6 shows the shape variation for the t-channel signal and W+ jets process due to the variation of the dominating contribution of the jet energy scale and the
η-intercalibration term.Event Fraction
0 0.05 0.1 0.15
0.2
SR
Preliminary
ATLAS ∫L dt = 20.3 fb-1 s=8 TeV -channel single top
t
intercalib. up η
JES
intercalib. down η
JES
NN output
0 0.2 0.4 0.6 0.8 1
rel. diff. -0.2
0 0.2
(a)
Event Fraction
0 0.05 0.1 0.15
SR
Preliminary
ATLAS ∫L dt = 20.3 fb-1 s=8 TeV +jets
W
intercalib. up η
JES
intercalib. down η
JES
NN output
0 0.2 0.4 0.6 0.8 1
rel. diff. -0.2
0 0.2
(b)
Figure 6: Shape variation of the NN discriminant for the JES
η-intercalibration uncertainty, (a) for thesignal and (b) the W
+jets sample. The bottom panel shows the relative difference between the distributionof the systematic variation and the central sample. The gray error band represents the uncertainty on the limited sample size of the nominal sample.
13
7 Cross-section measurement
The extraction of the t-channel single top-quark cross-section in this analysis is done in a fiducial vol- ume within the detector acceptance. The cross-section includes top-quark and top-antiquark production.
The benefit of measuring a production cross-section
σfidwithin a fiducial volume is that uncertainties connected with event generation can be reduced to differences within the fiducial volume. Differences between generators, hadronisation models or PDFs can be separated into components visible in the mea- sured phase space and in the non-visible phase space. The fiducial cross-section
σfidis defined as:
σfid= ǫcorr,sel
ǫcorr,fid · ν
ˆ
L =
R
f · νˆ
L,
(2)
where
ǫcorr,selis the fraction of events which are selected by the offline selection to be within the fiducial volume and
ǫcorr,fidis the fraction of events within the fiducial volume to be selected by the offline selection. The ratio of these two quantities is defined as R
fand is of the order of 3.5. The estimated number of expected t-channel single top-quark events is named ˆ
νand obtained by the binned maximum- likelihood fit. The fiducial cross-section can be extrapolated to the total inclusive cross-section
σwith:
σ=
1
ǫfid ·σfid,
(3)
where
ǫfidis the selection efficiency of the particle-level selection as defined in the next section.
7.1 Definition of particle-level objects and the fiducial volume
All objects are defined on particle level using stable particles, namely particles with a mean lifetime greater than 30 ps. The particle-level lepton is defined as the electron or the muon coming from the W boson decay, i.e. leptons from hadron decays either directly or via a
τdecay are rejected, while electrons or muons from
τdecays are accepted. In t-channel single top-quark events exactly one electron or muon passing the above criteria is present. The selected lepton is dressed with photons within a cone of
∆R <0.1. The missing transverse momentum E
missTis defined as the vectorial sum of all neutrinos present in the event, where a neutrino is defined in the same way as the particle-level lepton. Neutrinos from hadron decays either directly or via a
τdecay are rejected. Particle level jets are reconstructed using the anti-k
talgorithm, implemented in the FASTJET [71] package, with a width parameter of R
=0.4 . For the clustering all stable particles, except the selected leptons and dressing photons associated with them, are used. Reconstructed particle-level jets are tagged using a B-hadron matching, where tagged means that at least one B-hadron is found within the jet. Events are rejected where a selected lepton is identified within a
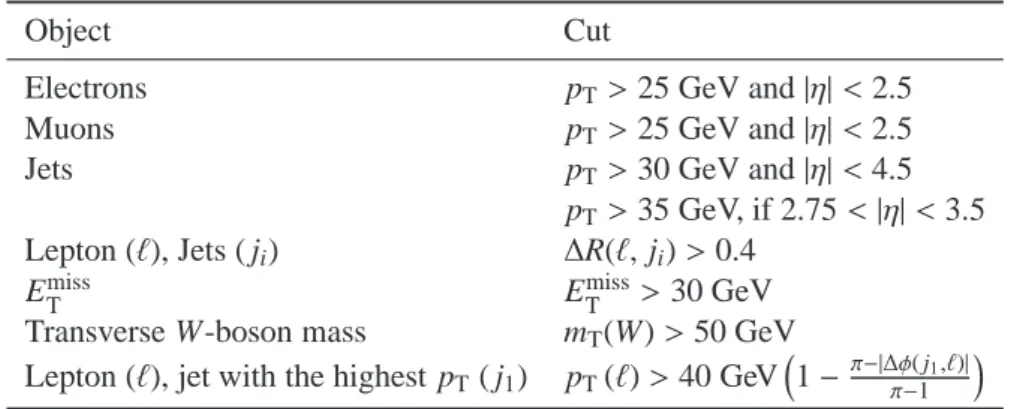
∆R of 0.4 of a selected jet.The definition of the fiducial phase space is close to the phase space of the reconstructed and selected data set. The applied cuts on the leptons, the E
Tmissand jets are detailed in Table 3.
7.2 Extraction of number of t-channel events
A binned maximum-likelihood fit to the NN output distribution is performed to extract the fiducial cross- section
σfid. Gaussian priors are added multiplicatively to the maximum-likelihood function to constrain the rates of the W+jets and top-quark background processes. The fit parameters of the likelihood func- tion are scale factors
βjthat multiply the expected value for each fitted process j. The background normalisation constraints are 60% for W
+jets production, and 6.6% for top-quark backgrounds (t¯t, Wtand s-channel), while the contributions from diboson and Z
+jets processes are fixed to their predictions.The background rates are determined by the background-dominated region with low discriminant values.
Table 3: Selection cuts of the fiducial volume. Electrons and muons from
τcontributes with about 3% to the acceptance.
Object Cut
Electrons p
T >25 GeV and
|η|<2.5
Muons p
T >25 GeV and
|η|<2.5
Jets p
T >30 GeV and
|η|<4.5
p
T >35 GeV, if 2.75
<|η|<3.5 Lepton (ℓ), Jets ( j
i)
∆R(ℓ,j
i)
>0.4
E
missTE
missT >30 GeV
Transverse W-boson mass m
T(W)
>50 GeV Lepton (ℓ), jet with the highest p
T( j
1) p
T(ℓ)
>40 GeV
1
−π−|∆φ( jπ−11,ℓ)|
The fit finds the minimum of the negative log likelihood function for the parameter values shown in Table 4.
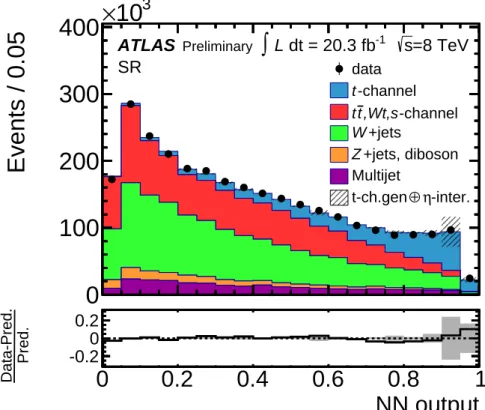
Figure 7 compares the observed NN output distributions to the compound model of signal and back- ground with each contribution normalised to the fit results from Table 4. The model agrees with the data, with residual differences covered by the various rate and shape uncertainties. Separate fits in the electron and muon channel yield compatible fit parameters.
Table 4: Estimators ˆ
βof the parameters of the likelihood function as obtained from the maximum like- lihood fit to data. The ˆ
βestimators are scale factors that multiply the expected rate for each process and the excepted number of events scaled by the fitted scale factor of process j is named ˆ
νj. The quoted uncertainties are statistical only. The systematic uncertainty on t¯t, Wt, s
−channel is 12 %, and on W+
jets 60 %.
Process
βˆ
νˆ
t channel 1.07
±0.02 19260
±290
W+ jets 1.14
±0.04 58000
±1900
Z+ jets, diboson – 6900
±1700
t¯t, Wt, s
−channel 0.87
±0.03 47000
±1800 QCD-multijets background – 11800
±5900
Total sum – 143000
±2600
Total observed – 143332
7.3 Estimation of the systematic uncertainties
The systematic uncertainties on the cross-section measurement are determined using a frequentist method based on pseudo-experiments that accounts for variations of the signal acceptance, the background rates
15
NN output
Events / 0.05
0 100 200 300 400
10
3×
NN output
0 0.2 0.4 0.6 0.8 1
Pred.Data-Pred.
-0.2 0 0.2
SR
Preliminary
ATLAS ∫ L dt = 20.3 fb
-1s =8 TeV
data-channel t
-channel ,Wt,s
t t
+jets W
+jets, diboson Z
Multijet
-inter.
η
⊕ t-ch.gen
Figure 7: Neural-network output-distribution for the combined electron and muon channel. The signal and backgrounds are normalised to the fit result. The bottom panel shows the relative difference between observed data and expectation. The grey shaded band reflects the t-channel generator uncertainty and the uncertainty on the jet energy scale
η-intercalibration.and the shape of the NN output. In case of the signal acceptance, only the uncertainty on R
fneeds to be considered within the fiducial volume. The correlations between the different analysis channels are fully accounted for by applying correlated systematic shifts across all channels. The RMS of the distribution of fit results for the pseudo-experiments is an estimator for the expected uncertainty. The systematic uncertainty on the measured parameters is similarly estimated using the measured
βvalues for the single top-quark t-channel signal and the backgrounds.
Table 5 shows the contributions to the total uncertainty on the cross-section measurement. The table provides the uncertainties evaluated for the observed signal and background rates as obtained from the maximum likelihood fit to the observed collision data.
7.4 Estimation of the fiducial cross-section
The estimated number of t-channel single top-quark events ˆ
νobtained from the binned maximum- likelihood fit of the network output distribution is used to calculate the fiducial cross-section, defined in Table 3,
σfid =