https://doi.org/10.1140/epjc/s10052-017-5349-9
Regular Article - Experimental Physics
Measurement of lepton differential distributions and the top quark mass in t t ¯ production in pp collisions at √
s = 8 TeV with the ATLAS detector
ATLAS Collaboration
CERN, 1211 Geneva 23, SwitzerlandReceived: 28 September 2017 / Accepted: 1 November 2017 / Published online: 25 November 2017
© CERN for the benefit of the ATLAS collaboration 2017. This article is an open access publication
Abstract This paper presents single lepton and dilepton kinematic distributions measured in dileptonic t t ¯ events pro- duced in 20.2 fb
−1of √
s = 8 TeV pp collisions recorded by the ATLAS experiment at the LHC. Both absolute and normalised differential cross-sections are measured, using events with an opposite-charge eμ pair and one or two b- tagged jets. The cross-sections are measured in a fiducial region corresponding to the detector acceptance for lep- tons, and are compared to the predictions from a variety of Monte Carlo event generators, as well as fixed-order QCD calculations, exploring the sensitivity of the cross-sections to the gluon parton distribution function. Some of the dis- tributions are also sensitive to the top quark pole mass;
a combined fit of NLO fixed-order predictions to all the measured distributions yields a top quark mass value of m
polet= 173.2 ± 0.9 ±0.8 ±1.2 GeV, where the three uncer- tainties arise from data statistics, experimental systematics, and theoretical sources.
1 Introduction
The top quark is the heaviest known fundamental particle, with a mass (m
t) that is much larger than any of the other quarks, and close to the scale of electroweak symmetry break- ing. The study of its production and decay properties in proton–proton (pp) collisions forms an important part of the ATLAS physics program at the CERN Large Hadron Collider (LHC). Due to its large mass and production cross-section, top quark production is also a significant background to many searches for physics beyond the Standard Model, making pre- cise predictions of absolute rates and differential distributions for top quark production a vital tool in fully exploiting the discovery potential of the LHC.
e-mail:atlas.publications@cern.ch
At the LHC, top quarks are primarily produced as quark- antiquark pairs (t t). The inclusive ¯ t t ¯ production cross-section σ
tt¯has been calculated at full next-to-next-to-leading-order (NNLO) accuracy in the strong coupling constant α
S, includ- ing the resummation of next-to-next-to-leading logarithmic (NNLL) soft gluon terms [1–5]. The resulting prediction at a centre-of-mass energy √
s = 8 TeV is σ
tt¯= 252.9 ± 11.7
+−68,.64pb for a top quark mass of 172.5 GeV, calculated using the top++ 2.0 program [6]. The first uncertainty is due to parton distribution function (PDF) and α
Suncer- tainties, calculated using the PDF4LHC prescription [7]
with the MSTW2008 68% [8,9], CT10 NNLO [10,11] and NNPDF 2.3 5f FFN [12] PDF sets, and the second to quantum chromodynamics (QCD) scale variations. This prediction, which has a relative precision of 5.5%, agrees with measure- ments from ATLAS and CMS at √
s = 8 TeV [13–15] which have reached a precision of 3–4%. Measurements in LHC
pp collisions at √
s = 7 TeV [13,15] and more recently at
√ s = 13 TeV [16,17] are also in good agreement with the corresponding NNLO + NNLL predictions.
Going beyond the inclusive production cross-section,
measurements of t t ¯ production as a function of the top quark
and t t ¯ system kinematics properties allow the predictions
of QCD calculations and Monte Carlo event-generator pro-
grams to be probed in more detail. These comparisons are
typically more sensitive at the level of normalised differ-
ential cross-sections, i.e. shape comparisons, where both
experimental and theoretical uncertainties are reduced. Mea-
surements by ATLAS [18–21] and CMS [22–24] have gen-
erally demonstrated good agreement with the predictions
of leading-order (LO) multi-leg and next-to-leading-order
(NLO) event generators and calculations, though the top
quark p
Tspectrum is measured to be softer than the pre-
dictions by both experiments; this distribution appears to be
sensitive to the additional corrections contributing at NNLO
[25]. Measurements of jet activity in t t ¯ events [26–29] are
also sensitive to gluon radiation and hence the t t ¯ production
dynamics, without the need to fully reconstruct the kine- matics of the t t ¯ system. However, all these measurements require sophisticated unfolding procedures to correct for the detector acceptance and resolution. This leads to significant systematic uncertainties, especially due to modelling of the showers and hadronisation of the quarks produced in the top quark decays, and the measurement of the resulting jets in the detector.
In the Standard Model (SM), the top quark decays almost exclusively to a W boson and a b quark, and the final state topologies in t t ¯ production are governed by the decay modes of the W bosons. The channel where one W boson decays to an electron (W → eν) and the other to a muon (W → μν), giving rise to the e
+μ
−ν ν ¯ b b ¯ final state,
1is particularly clean and was exploited to make the most precise ATLAS measure- ments of σ
tt¯[13,17]. The leptons carry information about the underlying top quark kinematics, are free of the uncertainties related to the hadronic part of the final state, and are precisely measured in the detector. Measurements of the t t ¯ differential cross-section as a function of the lepton kinematics there- fore have the potential to provide a complementary view of t t ¯ production and decay dynamics to that provided by the complete reconstruction of the t t ¯ final state.
This paper reports such a measurement of the absolute and normalised differential cross-sections for t t ¯ → eμν νb ¯ b ¯ produced in pp collisions at √
s = 8 TeV, as a function of the kinematics of the single leptons and of the dilepton sys- tem. Eight differential cross-section distributions are mea- sured: the transverse momentum p
Tand absolute pseudora- pidity |η
| of the single leptons (identical for electrons and muons), the p
T, invariant mass and absolute rapidity of the dilepton system (p
eTμ, m
eμand | y
eμ| ), the azimuthal angle in the transverse plane φ
eμbetween the two leptons, the scalar sum p
Te+ p
μTof the p
Tof the two leptons, and the sum E
e+ E
μof the energies of the two leptons.
2The mea- surements are corrected to particle level and reported in a fiducial volume where both leptons have p
T> 25 GeV and
|η| < 2.5, avoiding extrapolations into regions of leptonic phase space which are not measured. The particle-level def- inition includes the contribution of events where one or both W bosons decay to electrons or muons via leptonic decays of τ -leptons (t → W → τ → e/μ), but an alternative set of
1Charge-conjugate decay modes are implied unless otherwise stated.
2ATLAS uses a right-handed coordinate system with its origin at the nominal interaction point in the centre of the detector, and thezaxis along the beam line. Pseudorapidity is defined in terms of the polar angleθasη= −ln tanθ/2, and transverse momentum and energy are defined relative to the beamline aspT=psinθandET=Esinθ. The azimuthal angle around the beam line is denoted byφ, and distances in(η, φ)space byR=
(η)2+(φ)2. The rapidity is defined as y=12ln
E+p
z E−pz
, wherepzis thez-component of the momentum and Eis the energy of the relevant object or system.
results is provided where the contributions of τ -leptons are removed with a correction derived from simulation. The def- inition of the fiducial volume does not make any requirement on the presence of jets from the hadronic decay products of the t t ¯ system. The measurements are made using events with an opposite-charge eμ pair and one or two b-tagged jets, and extrapolated to the fiducial volume (without jet require- ments), using an extension of the double-tagging technique used in the inclusive t t ¯ cross-section measurement [13]. This approach minimises the systematic uncertainties due to the use of jets and b-tagging in the experimental event selection.
Since the lepton kinematics are precisely measured in the ATLAS detector, a simple bin-by-bin correction technique is adequate to correct for efficiency and resolution effects, without the need for a full unfolding procedure.
The results are compared to the predictions of various NLO and LO multi-leg t t ¯ event generators, and to fixed-order perturbative QCD predictions from the MCFM [30] program, which is used to explore the sensitivity to PDFs and QCD scale uncertainties. These comparisons are complementary to previous ATLAS analyses exploring how well t t ¯ event generators can describe the jet activity [27] and production of extra heavy-flavour jets [31] in the √
s = 8 TeV t t ¯ dilepton sample.
Some of the cross-section distributions are sensitive to the top quark mass, as suggested in Ref. [32], and mass measure- ments are made by comparing the measured distributions to predictions from both NLO plus parton shower event gener- ators and fixed-order QCD calculations. The former are sim- ilar to traditional measurements where the top quark mass is reconstructed from its decay products [33–36], but rely only on the leptonic decay products of the t t ¯ system and are less sensitive to experimental uncertainties related to the hadronic part of the final state. The measurements based on fixed-order QCD predictions in a well-defined renormalisation scheme correspond more directly to a measurement of the top quark pole mass m
polet, the mass definition corresponding to that of a free particle, which may differ from that measured in direct reconstruction of the decay products by O(1 GeV) [37–39].
Previous determinations of m
poletfrom inclusive and differen- tial t t ¯ cross-section measurements are compatible with the top quark mass measured from direct reconstruction, with uncertainties of 2–3 GeV [13,15,40,41].
The data and Monte Carlo simulation samples used in
this analysis are described in Sect. 2, followed by the event
reconstruction and selection in Sect. 3, definition and deter-
mination of the fiducial differential cross-sections in Sect. 4
and systematic uncertainties in Sect. 5. Results and compar-
isons with predictions are given in Sect. 6. The ability of
the data to constrain the gluon PDF is investigated in Sect. 7
and the determination of the top quark mass is discussed in
Sect. 8. Finally, conclusions are given in Sect. 9.
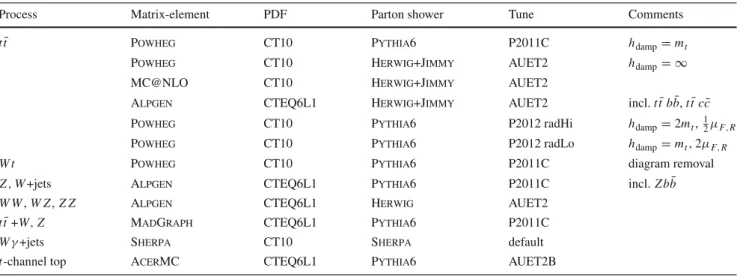
Table 1 Summary of simulated event samples used fortt¯signal and background modelling, giving the matrix-element event generator, PDF set, parton shower and associated tune parameter set. More details, including generator version numbers and references, are given in the text
Process Matrix-element PDF Parton shower Tune Comments
t¯t Powheg CT10 Pythia6 P2011C hdamp=mt
Powheg CT10 Herwig+Jimmy AUET2 hdamp= ∞
MC@NLO CT10 Herwig+Jimmy AUET2
Alpgen CTEQ6L1 Herwig+Jimmy AUET2 incl.tt b¯ b,¯ tt c¯ c¯
Powheg CT10 Pythia6 P2012 radHi hdamp=2mt,12μF,R
Powheg CT10 Pythia6 P2012 radLo hdamp=mt, 2μF,R
W t Powheg CT10 Pythia6 P2011C diagram removal
Z,W+jets Alpgen CTEQ6L1 Pythia6 P2011C incl.Z bb¯
W W,W Z,Z Z Alpgen CTEQ6L1 Herwig AUET2
tt¯+W,Z MadGraph CTEQ6L1 Pythia6 P2011C
Wγ+jets Sherpa CT10 Sherpa default
t-channel top AcerMC CTEQ6L1 Pythia6 AUET2B
2 Data and simulated samples
The ATLAS detector [42] at the LHC covers nearly the entire solid angle around the collision point, and consists of an inner tracking detector surrounded by a thin superconduct- ing solenoid magnet producing a 2 T axial magnetic field, electromagnetic and hadronic calorimeters, and an external muon spectrometer incorporating three large toroidal mag- net assemblies. The analysis was performed on a sample of proton–proton collision data at √
s = 8 TeV recorded by the ATLAS detector in 2012, corresponding to an inte- grated luminosity of 20.2 fb
−1. Events were required to pass a single-electron or single-muon trigger, with thresholds set to be fully efficient for leptons with p
T> 25 GeV passing offline selections. Each triggered event also includes the sig- nals from on average 20 additional inelastic pp collisions in the same bunch crossing, referred to as pileup.
Monte Carlo simulated event samples were used to develop the analysis procedures, to compare with data, and to evaluate signal efficiencies and background contributions.
An overview of the samples used for signal and background modelling is shown in Table 1, and further details are given below. Samples were processed using either the full ATLAS detector simulation [43] based on GEANT4 [44], or a faster simulation making use of parameterised showers in the calorimeters [45]. The effects of pileup were simulated by generating additional inelastic pp collisions with Pythia8 [46] using the A2 parameter set (tune) [47] and overlay- ing them on the primary simulated events. These combined events were then processed using the same reconstruction and analysis chain as the data. Small corrections were applied to the lepton trigger and selection efficiencies better to model the performance measured in data.
The baseline simulated t t ¯ sample was produced using the NLO matrix element event generator Powheg- Box v1.0 (referred to hereafter as Powheg ) [48–51] using the CT10 PDFs [10], interfaced to Pythia6 (version 6.426) [52] with the CTEQ6L1 PDF set [53] and the Perugia 2011C (P2011C) tune [54] for parton shower, hadronisation and underlying event modelling. This setup provides an NLO QCD predic- tion of the t t ¯ production process, a leading-order prediction for the top quark decays, and an approximate treatment of the spin correlations between the quark and antiquark. The Powheg parameter h
damp, used in the damping function that limits the resummation of higher-order effects incorporated into the Sudakov form factor, was set to m
t. This value was found to give a better modelling of the t t ¯ system p
Tat √
s = 7 TeV [55] than the setting of h
damp= ∞ used for the baseline t t ¯ sample in Ref. [13], which corresponds to no damping.
Alternative t t ¯ simulation samples used to evaluate sys- tematic uncertainties were generated with Powheg inter- faced to Herwig (version 6.520) [56,57] with the ATLAS AUET2 tune [58] and Jimmy (version 4.31) [59] for underly- ing event modelling, with MC@NLO (version 4.01) [60,61]
interfaced to Herwig + Jimmy , and with the leading-order
‘multi-leg’ event generator Alpgen (version 2.13) [62], also
interfaced to Herwig + Jimmy . The Alpgen samples used
leading-order matrix elements for t t ¯ production accompa-
nied by up to three additional light partons, and dedicated
matrix elements for t t ¯ plus b b ¯ or c c ¯ production, together
with the MLM parton-jet matching scheme [63] to account
for double-counting of configurations generated by both the
parton shower and matrix-element calculation. The effects of
additional radiation in t t ¯ events were further studied using
two additional Powheg + Pythia6 samples, one using the
Perugia 2012 radHi tune [54], with h
dampset to 2m
tand
factorisation and renormalisation scales μ
Fand μ
Rreduced from their event generator defaults by a factor of two, giv- ing more parton shower radiation; and one with the Perugia 2012 radLo tune [54], μ
Fand μ
Rincreased by a factor of two and h
damp= m
t, giving less parton shower radiation.
The parameters of these samples were chosen to span the uncertainties in jet observables measured by ATLAS in t t ¯ events at √
s = 7 TeV [26,55,64]. The top quark mass was set to 172.5 GeV in all these samples, consistent with recent measurements by ATLAS [35] and CMS [36]. They were all normalised to the NNLO + NNLL cross-section predic- tion discussed in Sect. 1 when comparing simulation with data. Further t t ¯ simulation samples with different event gen- erator setups were used for comparisons with the measured differential cross-sections as discussed in Sect. 6.2, and in the extraction of the top quark mass as discussed in Sect. 8.
Backgrounds to the t t ¯ event selection are classified into two types: those with two real prompt leptons from W or Z boson decays (including those produced via leptonic τ decays), and those where one of the reconstructed lepton candidates is misidentified, i.e. a non-prompt lepton from the decay of a bottom or charm hadron, an electron from a photon conversion, hadronic jet activity misidentified as an electron, or a muon produced from the decay in flight of a pion or kaon. The first category is dominated by the associated pro- duction of a W boson and a single top quark, W t, that is sim- ulated using Powheg + Pythia6 with the CT10 PDFs and the P2011C tune. The ‘diagram removal’ scheme was used to handle the interference between the t t ¯ and W t final states that occurs at NLO [65,66]. Smaller backgrounds result from Z → ττ(→ eμ)+jets, modelled using Alpgen + Pythia6 including leading-order matrix elements for Z b b ¯ production, and diboson (W W , W Z and Z Z ) production in association with jets, modelled with Alpgen + Herwig + Jimmy . The W t background was normalised to the approximate NNLO cross-section of 22 . 4 ± 1 . 5 pb, determined as in Ref. [67].
The inclusive Z cross-section was set to the NNLO predic- tion from FEWZ [68], but the normalisation of the Z → ττ background with b-tagged jets was determined with the help of data control samples as discussed in Sect. 4.2. The small diboson background was normalised to the NLO QCD inclu- sive cross-section predictions calculated with MCFM [69], using the Alpgen + Herwig prediction for the fraction of diboson events with extra jets. Production of t t ¯ in association with a W or Z boson, which contributes to the control sample with two same-charge leptons, was simulated with Mad- Graph [70] interfaced to Pythia6 with CTEQ6L1 PDFs, and normalised to NLO cross-section predictions [71,72].
Backgrounds with one real and one misidentified lep- ton arise from t t ¯ events with one hadronically-decaying W ; W +jets production, modelled as described above for Z+jets;
W γ +jets, modelled with Sherpa 1.4.1 [73] with CT10 PDFs;
andt -channel single top production, modelled with AcerMC
[74] with the AUET2B tune [75] and CTEQ6L1 PDFs inter- faced to Pythia6 . The normalisations of these backgrounds in the opposite-charge eμ samples were determined with the help of the corresponding same-charge eμ samples in data.
Other backgrounds, including processes with two misidenti- fied leptons, are negligible after the event selections used in this analysis.
3 Event reconstruction and selection
The analysis makes use of reconstructed electrons, muons, and b-tagged jets, selected exactly as described in Ref. [13].
In brief, electron candidates [76] were required to satisfy E
T> 25 GeV and |η| < 2.47, and to not lie within the transi- tion region 1.37 < |η| < 1.52 between the barrel and endcap electromagnetic calorimeters. Muon candidates [77] were required to satisfy p
T> 25 GeV and |η| < 2.5. In order to reduce background from non-prompt leptons, electrons were required to be isolated from nearby hadronic activity using both calorimeter and tracking information, and muons were required to be isolated using tracking information alone. Jets were reconstructed using the anti-k
talgorithm [78,79] with radius parameter R = 0.4 using calorimeter energy clusters calibrated with the local cluster weighting method [80]. Jets were further calibrated using information from both simula- tion and data [81,82], and required to satisfy p
T> 25 GeV and |η| < 2.5. Jets satisfying p
T< 50 GeV and |η| < 2.4 were additionally required to pass pileup rejection criteria based on their associated tracks [82]. To further suppress non-isolated leptons likely to originate from heavy-flavour decays within jets, electron and muon candidates within R < 0.4 of selected jets were discarded. Finally, jets likely to contain b-hadrons were b-tagged using the MV1 algo- rithm [83], a multivariate discriminant making use of track impact parameters and reconstructed secondary vertices. A tagging working point corresponding to a 70% efficiency for tagging b-quark jets from top decays in t t ¯ events was used, giving a rejection factor of about 140 against light-quark and gluon jets, and about five against jets originating from charm quarks.
As in Ref. [13], events were required to have at least one reconstructed primary vertex
3and to have no jets with p
T> 20 GeV failing jet quality requirements [81]. Events having muons compatible with cosmic-ray interactions or losing substantial energy following bremsstrahlung in the calorimeter material were rejected. A preselection requir- ing exactly one electron and one muon selected as described above was then applied, requiring at least one selected lep- ton to be matched to a corresponding electron or muon
3 The reconstructed vertex with the largest sum ofpT2for the constituent tracks was selected as the primary vertex.
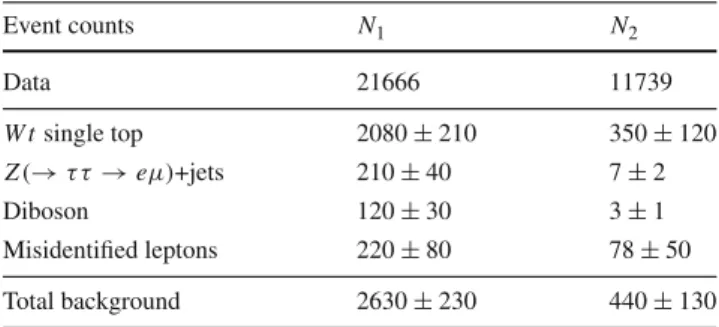
Table 2 Observed numbers of opposite-signeμevents with one and twob-tagged jets (N1and N2) together with the estimates of back- grounds and associated total uncertainties described in Sect.5
Event counts N1 N2
Data 21666 11739
W tsingle top 2080±210 350±120
Z(→ττ→eμ)+jets 210±40 7±2
Diboson 120±30 3±1
Misidentified leptons 220±80 78±50
Total background 2630±230 440±130
trigger signature. Events with an opposite-charge-sign eμ pair formed the main analysis sample, with events having a same-sign pair being used to estimate the background from misidentified leptons.
A total of 66,453 data events passed the opposite-sign eμ preselection. Events were then further sub-divided accord- ing to the number of b-tagged jets, irrespective of the num- ber of untagged jets, and events having one or two b- tagged jets were retained for further analysis. The num- bers of one and two b-tagged jet events selected in data are shown in Table 2, compared with expected non-t t ¯ contri- butions from W t and dibosons evaluated from simulation, and Z (→ ττ → eμ)+jets and misidentified leptons eval- uated from data and simulation, as discussed in detail in Sects. 4.2 and 5 below.
4In simulation, the one b-tagged sam- ple is about 88% pure and the two b-tagged sample 96% pure in t t ¯ events, with the largest backgrounds coming from W t production in both cases. The distribution of the number of b-tagged jets in preselected opposite-sign eμ events is shown in Fig. 1a, compared to the predictions from simulation using Powheg + Pythia6 (PY6), MC@NLO + Herwig (HW) and Alpgen + Herwig t t ¯ samples, normalising the total simula- tion prediction in each case using the integrated luminosity of the data sample. The distributions of the p
Tof b-tagged jets, and the reconstructed electron and muon p
Tand |η| in events with at least one b-tagged jet are shown in Fig. 1b–f, with the total simulation prediction normalised to the same number of events as the data to facilitate shape comparisons.
The distributions of the reconstructed dilepton variables p
eTμ, m
eμ, |y
eμ|, φ
eμ, p
eT+ p
Tμand E
e+ E
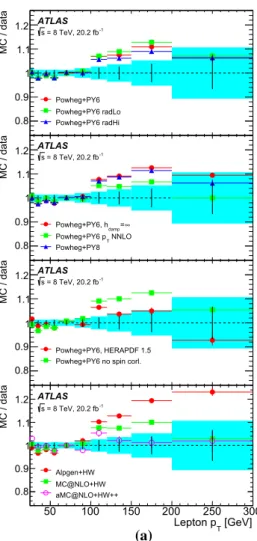
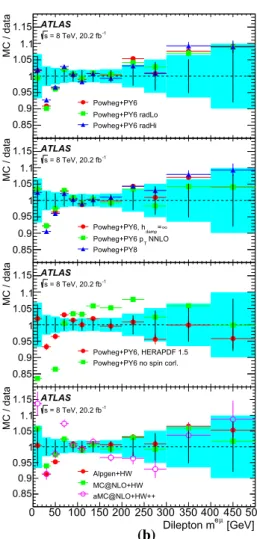
μare shown in Fig. 2, with the simulation normalised as for Fig. 1b–f. In general the data are well described by the predictions using the different t t ¯ models, but a few differences are visible. The lepton p
Tspectra are softer in data than in simulation, the lepton |η
| and dilepton |y
eμ| distributions are more central than the Powheg + Pythia6 and MC@NLO + Herwig predictions,
4The background event counts and uncertainties shown in Table2differ from those in Ref. [13] due to the use of different simulation samples and the estimation of the background in bins of lepton kinematic variables.
and the φ
eμdistribution is slightly flatter in data than in all the predictions.
4 Fiducial cross-section determination
The cross-section measurements were made for a fiducial region, where the particle-level electron and muon were required to have opposite charge signs, to each come from W decays either directly or via W → τ → e/μ and to each satisfy p
T> 25 GeV and |η| < 2 . 5. The lepton four- momenta were taken after final-state radiation, and ‘dressed’
by including the four-momenta of any photons within a cone of size R = 0 . 1 around the lepton direction, excluding pho- tons produced from hadronic decays or interactions with the detector material. The total cross-section within this fidu- cial volume corresponds to the fiducial cross-section mea- sured in Ref. [13]. According to the predictions of the base- line Powheg + Pythia6 t t ¯ simulation, it is about 44% of the total t t ¯ → eμν νb ¯ b ¯ cross-section without restrictions on the lepton acceptance and including contributions via W → τ → e/μ.
4.1 Cross-section extraction
The differential cross-sections were measured using an extension of the technique used in Ref. [13], counting the number of leptons or events with one ( N
1i) or two (N
2i) b- tagged jets where the lepton(s) fall in bin i of a differential distribution at reconstruction level. For the single-lepton dis- tributions p
Tand |η
|, there are two counts per event, in the two bins corresponding to the electron and muon. For the dilepton distributions, each event contributes a single count corresponding to the bin in which the appropriate dilepton variable falls. For each measured distribution, these counts satisfy the tagging equations:
N
1i= Lσ
tit¯G
ieμ2
bi(1 − C
bibi
) + N
1i,bkg,
N
2i= Lσ
tit¯G
ieμC
bi(
bi)
2+ N
2i,bkg, (1) where σ
tit¯is the absolute fiducial differential cross-section in bin i , and L is the integrated luminosity of the sample.
The reconstruction efficiency G
ieμrepresents the ratio of the number of reconstructed eμ events (or leptons for p
Tand
|η
|) falling in bin i at reconstruction level to the number of
true eμ events (or leptons) falling in the same bin at parti-
cle level, evaluated using t t ¯ simulation without making any
requirements on reconstructed or particle-level jets. It there-
fore corrects for both the lepton reconstruction efficiency and
bin migration, where events corresponding to bin j at par-
ticle level appear in a different bin i = j at reconstruction
level. The values of G
ieμin simulation are typically in the
b-tag
N
0 1 2 3
Events
0 5000 10000 15000 20000 25000 30000 35000
40000 ATLAS
= 8 TeV, 20.2 fb-1
s
Data 2012 Powheg+PY6 t
t Wt Z+jets Diboson Mis-ID lepton Powheg+PY6 MC@NLO+HW Alpgen+HW
b-tag
N
0 1 2 ≥ 3
MC / Data 0.5
1
1.5 Stat. uncert.
(a)
[GeV]
T
b-tagged jet p
50 100 150 200 250
Jets / 10 GeV
0 1000 2000 3000 4000 5000
6000 ATLAS
= 8 TeV, 20.2 fb-1
s
Data 2012 Powheg+PY6 t
t Wt Z+jets Diboson Mis-ID lepton Powheg+PY6 MC@NLO+HW Alpgen+HW
[GeV]
b-tagged jet pT
50 100 150 200 250
MC / Data 0.8
1
1.2 Stat. uncert.
(b)
[GeV]
T
Electron p
40 60 80 100 120 140 160 180 200
Events / 10 GeV
0 1000 2000 3000 4000 5000 6000
7000 ATLAS
= 8 TeV, 20.2 fb-1
s
Data 2012 Powheg+PY6 t
t Wt Z+jets Diboson Mis-ID lepton Powheg+PY6 MC@NLO+HW Alpgen+HW
[GeV]
Electron pT
40 60 80 100 120 140 160 180 200
MC / Data 0.8
1
1.2 Stat. uncert.
(c)
η| Electron |
0.5 1 1.5 2 2.5
Events / 0.25
0 1000 2000 3000 4000 5000
6000 ATLAS
= 8 TeV, 20.2 fb-1
s
Data 2012 Powheg+PY6 t
t Wt Z+jets Diboson Mis-ID lepton Powheg+PY6 MC@NLO+HW Alpgen+HW
η| Electron |
0 0.5 1 1.5 2 2.5
MC / Data 0.9
1
1.1 Stat. uncert.
(d)
[GeV]
T
Muon p
Events / 10 GeV
0 1000 2000 3000 4000 5000 6000
7000 ATLAS
= 8 TeV, 20.2 fb-1
s
Data 2012 Powheg+PY6 t
t Wt Z+jets Diboson Mis-ID lepton Powheg+PY6 MC@NLO+HW Alpgen+HW
[GeV]
Muon pT
40 60 80 100 120 140 160 180 200
MC / Data 0.8
1
1.2 Stat. uncert.
(e)
η| Muon |
Events / 0.25
0 1000 2000 3000 4000 5000
ATLAS
= 8 TeV, 20.2 fb-1
s
Data 2012 Powheg+PY6 t
t Wt Z+jets Diboson Mis-ID lepton Powheg+PY6 MC@NLO+HW Alpgen+HW
η| Muon |
0 0.5 1 1.5 2 2.5
MC / Data 0.9
1
1.1 Stat. uncert.
(f) Fig. 1 Distributions ofathe number ofb-tagged jets in preselected
opposite-signeμevents; andbthe pTofb-tagged jets,cthepTof the electron,dthe|η|of the electron,ethepTof the muon andfthe
|η|of the muon, in events with an opposite-signeμpair and at least oneb-tagged jet. The reconstruction-level data are compared to the expectation from simulation, broken down into contributions fromtt¯ (Powheg + Pythia6), single top, Z+jets, dibosons, and events with
misidentified electrons or muons. The simulation prediction is nor- malised to the same integrated luminosity as the data inaand to the same number of entries as the data inb–f. The lower parts of the figure show the ratios of simulation to data, using varioustt¯signal samples and with the cyan band indicating the data statistical uncertainty. The last bin includes the overflow in panelsb,cande
[GeV]
μ e
Dilepton pT
50 100 150 200
Events / 10 GeV
0 500 1000 1500 2000 2500 3000 3500
4000 ATLAS
= 8 TeV, 20.2 fb-1
s
Data 2012 Powheg+PY6 t
t Wt Z+jets Diboson Mis-ID lepton Powheg+PY6 MC@NLO+HW Alpgen+HW
[GeV]
μ e
Dilepton pT
0 50 100 150 200 250
MC / Data 0.8
1
1.2 Stat. uncert.
(a)
[GeV]
μ
Dilepton me
50 100 150 200 250 300 350 400
Events / 20 GeV
0 1000 2000 3000 4000
5000 ATLAS
= 8 TeV, 20.2 fb-1
s
Data 2012 Powheg+PY6 t
t Wt Z+jets Diboson Mis-ID lepton Powheg+PY6 MC@NLO+HW Alpgen+HW
[GeV]
μ
Dilepton me
0 50 100 150 200 250 300 350 400 450
MC / Data 0.8
1
1.2 Stat. uncert.
(b)
μ| Dilepton |ye
0.5 1 1.5 2
Events / 0.25
0 1000 2000 3000 4000 5000 6000 7000
8000 ATLAS
= 8 TeV, 20.2 fb-1
s
Data 2012 Powheg+PY6 t
t Wt Z+jets Diboson Mis-ID lepton Powheg+PY6 MC@NLO+HW Alpgen+HW
μ| Dilepton |ye
0 0.5 1 1.5 2 2.5
MC / Data 0.8
1
1.2 Stat. uncert.
(c)
[rad]
μ
φe
Δ Dilepton
0.5 1 1.5 2 2.5 3
/10)πEvents / (
0 1000 2000 3000 4000
5000 ATLAS
= 8 TeV, 20.2 fb-1
s
Data 2012 Powheg+PY6 t
t Wt Z+jets Diboson Mis-ID lepton Powheg+PY6 MC@NLO+HW Alpgen+HW
[rad]
μ
φe
Δ Dilepton
0 0.5 1 1.5 2 2.5 3
MC / Data
0.9 1
1.1 Stat. uncert.
(d)
[GeV]
μ T e+p
T
Dilepton p
Events / 20 GeV
0 1000 2000 3000 4000 5000 6000
7000 ATLAS
= 8 TeV, 20.2 fb-1
s
Data 2012 Powheg+PY6 t
t Wt Z+jets Diboson Mis-ID lepton Powheg+PY6 MC@NLO+HW Alpgen+HW
[GeV]
μ
+pT e
Dilepton pT
50 100 150 200 250 300 350
MC / Data 0.8
1
1.2 Stat. uncert.
(e)
[GeV]
+Eμ
Dilepton Ee
Events / 20 GeV
0 500 1000 1500 2000 2500 3000
3500 ATLAS
= 8 TeV, 20.2 fb-1
s
Data 2012 Powheg+PY6 t
t Wt Z+jets Diboson Mis-ID lepton Powheg+PY6 MC@NLO+HW Alpgen+HW
[GeV]
+Eμ
Dilepton Ee
100 200 300 400 500 600 700
MC / Data 0.8
1
1.2 Stat. uncert.
(f) Fig. 2 Distributions of athe dileptonpeTμ,binvariant massmeμ,c
rapidity|yeμ|,dazimuthal angle differenceφeμ,elepton pT sum pTe+pμTandflepton energy sumEe+Eμ, in events with an opposite- signeμpair and at least oneb-tagged jet. The reconstruction-level data are compared to the expectation from simulation, broken down into con- tributions fromt¯t (Powheg + Pythia6), single top,Z+jets, dibosons,
and events with misidentified electrons or muons, normalised to the same number of entries as the data. The lower parts of the figure show the ratios of simulation to data, using varioustt¯signal samples and with the cyan band indicating the data statistical uncertainty. The last bin includes the overflow in panelsa,b,eandf
range 0.5–0.6, with some dependence on lepton kinematics due to the varying reconstruction efficiencies with lepton |η|
and p
T, and the effect of isolation requirements when the leptons are close together in the detector.
The efficiency
ibrepresents the combined probability for a jet from the quark q in the t → W q decay to fall within the detector acceptance, be reconstructed as a jet with p
T>
25 GeV and be tagged as ab-jet. Although this quark is almost always a b-quark,
bialso accounts for the 0.2% of top quarks that decay to W s or W d. If the kinematics of the two b quarks produced in the top quark decays are uncorrelated, the probability to tag both is given by
ibb= (
bi)
2. In practice, small correlations are present, for example due to kinematic correlations between the b-jets from the top quark decays, or extra b b ¯ or c c ¯ pairs produced in association with the t t ¯ system [13]. Their effects are corrected via the tagging correlation coefficient C
bi=
bbi/(
bi)
2, whose values are taken from t t ¯ simulation. They depend slightly on the bin i of the dilepton system but are always within 1–2% of unity, even for the bins at the edges of the differential distributions. The correlation C
bialso corrects for the small effects on N
1i, N
2iand
biof the small fraction of t t ¯ events which have additional b quarks produced in association with the t t ¯ system, and the even smaller effects from mistagged light quark, charm or gluon jets in t t ¯ events. This formalism involving
iband C
iballows the fraction of top quarks where the jet was not reconstructed to be inferred from the counts N
1iand N
2i, minimising the exposure to systematic uncertainties from jet measurements and b-tagging, and allowing the fiducial cross-sections σ
tit¯to be defined with no requirements on the jets in the final state.
Backgrounds from sources other than t t ¯ → eμν νb ¯ b ¯ events also contribute to the counts N
1iand N
2i, and are repre- sented by the terms N
1i,bkgand N
2i,bkgin Eq. (1). These con- tributions were evaluated using a combination of simulation- and data-based methods as discussed in Sect. 4.2 below.
The tagging equations were solved numerically in each bin i of each differential distribution separately. The bin ranges for each distribution were chosen according to the experi- mental resolution, minimising the bin-to-bin migration by keeping the bin purities (the fractions of reconstructed events in bin i that originate from events which are also in bin i at particle level) above about 0.9. The resolution on the recon- structed kinematic quantities is dominated by the electron energy and muon momentum measurements, and the puri- ties for the distributions which depend mainly on angular variables are higher, around 0.96 for |y
eμ| and 0.99 for |η
| and φ
eμ. For these distributions, the bin ranges were cho- sen so as to give about ten bins for each distribution. The bin range choices for all distributions can be seen in Tables 3, 4, 5 and 6 in Sect. 6, and the last bin of the p
T, p
eTμ, m
eμ, p
eT+ p
Tμand E
e+ E
μdistributions includes overflow events
falling above the last bin boundary, indicated by the ‘+’ sign after the upper bin limit.
The normalised fiducial differential cross-section distri- butions ς
tit¯were calculated from the absolute cross-sections σ
tit¯determined from Eq. (1) as follows:
ς
tit¯= σ
tit¯j
σ
tjt¯= σ
tit¯σ
fidtt¯, (2)
where σ
fidtt¯is the total cross-section summed over all bins of the fiducial region. The ς
tit¯values are divided by the bin widths W
i, to produce the cross-sections differential in the variable x (x = p
T, |η
|, etc.):
1 σ
d σ dx
i
= ς
tit¯W
i.
The normalisation condition in Eq. (2) induces a statistical correlation between the normalised measurements in each bin. The absolute dilepton cross-section measurements are not statistically correlated between bins, but kinematic cor- relations between the electron and muon in each event induce small statistical correlations between bins of the absolute sin- gle lepton p
Tand |η
| distributions, as discussed in Sect. 4.3 below.
The measured cross-sections include contributions where one or both leptons are produced via leptonic tau decays (t → W → τ → e/μ), but the fixed-order predic- tions discussed in Sect. 6.3 only include the direct decays t → W → e /μ . To allow comparison with such predic- tions, a second set of cross-section results were derived with a bin-by-bin multiplicative correction f
τ¯ito remove the τ contributions:
σ
tit¯(no–τ) = f
τ¯iσ
tit¯, (3) and similarly for the normalised cross-sections ς
tit¯(no-τ).
The corrections f
τi¯were evaluated from the baseline Powheg + Pythia6 t t ¯ simulation and are typically close to 0.9, decreasing to 0.8–0.85 at low lepton p
T.
4.2 Background estimates
The W t single top and diboson backgrounds were estimated from simulation using the samples discussed in Sect. 2, whilst the Z +jets background (with Z → ττ → eμ4ν) and the contribution from events with one real and one misidenti- fied lepton were estimated using both simulation and data as discussed below. The backgrounds in both the one and two b-tagged samples are dominated by W t (see Table 2).
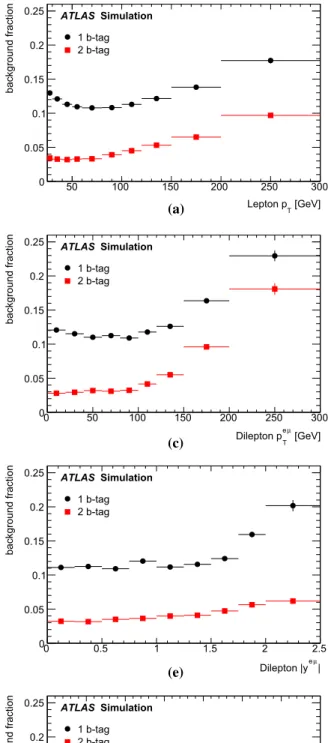
The total background fraction (i.e. the predicted fraction of
events in each bin which do not come from t t ¯ with two real
prompt leptons) varies significantly as a function of some
of the differential variables, as shown in Fig. 3. This varia- tion is taken into account by estimating the background con- tributions N
1i,bkgand N
2i,bkgseparately in each bin of each differential distribution.
The production cross-sections for Z bosons accompa- nied by heavy-flavour jets are subject to large theoreti- cal uncertainties. The background predictions from Alp- gen + Pythia6 in each bin of each distribution were there- fore normalised from data, by multiplying them by constant scale factors of 1 . 4 ± 0 . 2 for the one b-tagged jet sample and 1.1 ± 0.3 for the two b-tagged jet sample. These scale factors were derived from the comparison of data and sim- ulated event yields for Z → ee and Z → μμ plus one or two b-tagged jets, inclusively for all lepton pairs passing the kinematic selections for electrons and muons [13]. The uncertainties are dominated by the dependence of the scale factors on lepton kinematics, investigated by studying their variation with Z -boson p
T, reconstructed from the ee or μμ system.
The background from events with one real and one misidentified lepton was estimated using a combination of data and simulation in control regions with an electron and muon of the same charge [13]. Simulation studies showed that the samples with a same-sign eμ pair and one or two b-tagged jets are dominated by events with a misidentified lepton, with rates and kinematic distributions similar to those in the opposite-sign sample. The distributions of the dilepton kinematic variables for same-sign events with at least one b- tagged jet in data are shown in Fig. 4, and compared with the predictions from simulation. The expected contributions are shown separately for events with two prompt leptons, events where the electron candidate originates from a converted photon radiated from an electron produced in a top quark decay, events with a converted photon from other sources, and events where the electron or muon originates from the decay of a bottom or charm hadron. The analogous distribu- tions for the electron and muon p
Tand |η| are shown in Ref.
[13]. In general, the simulation models the rates and kine- matic distributions of the same-sign events well. The mod- elling of misidentified leptons was further tested in control samples where either the electron or muon isolation require- ments were relaxed in order to enhance the contributions from heavy-flavour decays, and similar levels of agreement were observed.
The contributions N
ij,mis−idof events with misidentified leptons to the opposite-sign samples with j = 1, 2 b-tagged jets were estimated in each bin i of each distribution using
N
ij,mis−id= R
ij(N
ij,data,SS− N
ij,prompt,SS), R
ij=
Nij,mis−id,OSNij,mis−id,SS
, (4)
where N
ij,data,SSis the number of observed same-sign events in bin i with j b-tagged jets, N
ij,prompt,SSis the estimated number of events in this bin with two prompt leptons, and R
ijis the ratio of the number of opposite- to same-sign events with misidentified leptons in bin i with j b-tagged jets. This formalism uses the observed data same-sign event rate in each bin to predict the corresponding opposite-sign contribution from misidentified leptons. It relies on simulation to predict the ratios of opposite- to same-sign rates and the prompt same-sign contribution, but not the absolute normalisation of misidentified leptons. The prompt-lepton contribution in Eq. (4) comes mainly from semileptonic t t ¯ events with an additional W or Z boson, diboson events with two same- sign leptons, and t t ¯ → eμν νb ¯ b ¯ events where the electron charge was misreconstructed. These components were evalu- ated directly from simulation in each bin (i, j), and an uncer- tainty of ± 50% was assigned [13]. The values of R
ijwere taken from simulation, separately for each differential dis- tribution and j = 1 and 2 b-tagged jets, and averaged over several consecutive bins i in order to reduce statistical fluc- tuations. The values of R
1irange from 0.8 to 1.5, and R
2ifrom 1.2 to 2.0, as the predicted background composition changes across the kinematic distributions. As in Ref. [13], uncer- tainties of ± 0.25 and ± 0.5 were assigned to R
i1and R
2i, based on the variation of R
ijfor different components of the misidentified lepton background, and taken to be correlated across all bins ( i , j ) .
4.3 Validation of the analysis procedure
The method for the differential cross-section determination
was tested on simulated events in order to check for biases
and determine the expected statistical uncertainties. Pseudo-
data samples corresponding to the data integrated luminosity
were produced by varying the event counts N
1iand N
2iin each
bin i independently, according to Poisson distributions with
mean values predicted from a chosen t t ¯ simulation sample
plus non-t t ¯ backgrounds. The tagging equations Eq. (1) were
then solved for each pseudo-experiment using the values of
G
ieμ, C
bi, N
1i,bkgand N
2i,bkgcalculated with the baseline sim-
ulation samples. An initial set of 1000 pseudo-experiments
was performed using the baseline simulation sample as a ref-
erence, and the mean and RMS width of the deviations of the
result in each bin from the reference values were used to
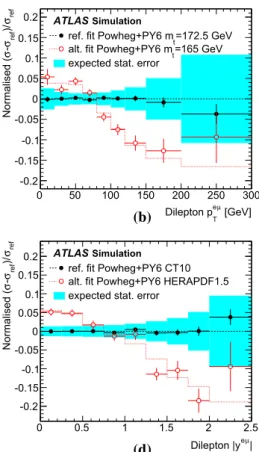
validate the analysis procedure. The black points in Fig. 5
show the mean deviation of the results (averaged over all
pseudo-experiments) for four of the measured normalised
distributions, with error bars corresponding to the uncertainty
in the mean due to the finite size of the simulation samples
(about 17 times the data integrated luminosity). The resid-
ual biases of the mean deviations away from the reference
are compatible with zero and in all cases much smaller than
[GeV]
Lepton pT
50 100 150 200 250 300
background fraction
0 0.05 0.1 0.15 0.2
0.25 ATLAS Simulation
1 b-tag 2 b-tag
(a)
Lepton |η|0 0.5 1 1.5 2 2.5
background fraction
0 0.05 0.1 0.15 0.2
0.25 ATLAS Simulation
1 b-tag 2 b-tag
(b)
[GeV]
μ e
Dilepton pT
0 50 100 150 200 250 300
background fraction
0 0.05 0.1 0.15 0.2
0.25 ATLAS Simulation
1 b-tag 2 b-tag
(c)
[GeV]μ
Dilepton me
0 50 100 150 200 250 300 350 400 450 500
background fraction
0 0.05 0.1 0.15 0.2
0.25 ATLAS Simulation
1 b-tag 2 b-tag
(d)
μ| Dilepton |ye
0 0.5 1 1.5 2 2.5
background fraction
0 0.05 0.1 0.15 0.2
0.25 ATLAS Simulation
1 b-tag 2 b-tag
(e)
[rad]μ
φe
Δ Dilepton
0 0.5 1 1.5 2 2.5 3
background fraction
0 0.05 0.1 0.15 0.2
0.25 ATLAS Simulation
1 b-tag 2 b-tag
(f)
[GeV]
μ
+pT e
Dilepton pT
50 100 150 200 250 300 350 400
background fraction
0 0.05 0.1 0.15 0.2
0.25 ATLAS Simulation
1 b-tag 2 b-tag
(g)
[GeV]+Eμ
Dilepton Ee
100 200 300 400 500 600 700
background fraction
0 0.05 0.1 0.15 0.2
0.25 ATLAS Simulation
1 b-tag 2 b-tag
(h)
Fig. 3 Estimated background fractions in the one and twob-tagged samples as functions of each lepton and dilepton differential variable, estimated from simulation alone. The error bars correspond to the statistical uncertainties of the simulation samples, and are often smaller than the marker size
[GeV]
μ e
Dilepton pT
0 50 100 150 200 250
Events / 25 GeV
0 20 40 60 80
100 ATLAS
= 8 TeV, 20.2 fb-1
s
μ Same-sign e
Data 2012 Prompt
→ e -conv. t γ
-conv. b/g e γ
Heavy-flavour e μ Heavy-flavour
(a)
[GeV]μ
Dilepton me
0 50 100 150 200 250 300 350 400 450
Events / 25 GeV
0 10 20 30 40 50 60 70
ATLAS
= 8 TeV, 20.2 fb-1
s
μ Same-sign e
Data 2012 Prompt
→ e -conv. t γ
-conv. b/g e γ
Heavy-flavour e μ Heavy-flavour
(b)
μ| Dilepton |ye
0 0.5 1 1.5 2 2.5
Events / 0.25
0 10 20 30 40 50 60 70 80 90
ATLAS
= 8 TeV, 20.2 fb-1
s
μ Same-sign e
Data 2012 Prompt
→ e -conv. t γ
-conv. b/g e γ
Heavy-flavour e μ Heavy-flavour
(c)
[rad]μ
φe
Δ Dilepton
0 0.5 1 1.5 2 2.5 3
/10)πEvents / (
0 10 20 30 40 50 60 70 80
ATLAS
= 8 TeV, 20.2 fb-1
s
μ Same-sign e Data 2012
Prompt
→ e -conv. t γ
-conv. b/g e γ
Heavy-flavour e μ Heavy-flavour
(d)
[GeV]
μ
+pT e
Dilepton pT
50 100 150 200 250 300 350
Events / 20 GeV
0 10 20 30 40 50 60 70
ATLAS
= 8 TeV, 20.2 fb-1
s
μ Same-sign e
Data 2012 Prompt
→ e -conv. t γ
-conv. b/g e γ
Heavy-flavour e μ Heavy-flavour
(e)
[GeV]+Eμ
Dilepton Ee
100 200 300 400 500 600 700
Events / 50 GeV
0 10 20 30 40 50 60 70
80 ATLAS
= 8 TeV, 20.2 fb-1
s
μ Same-sign e
Data 2012 Prompt
→ e -conv. t γ
-conv. b/g e γ
Heavy-flavour e μ Heavy-flavour
(f)
Fig. 4 Distributions of athe dileptonpeTμ,binvariant massmeμ,c rapidity|yeμ|,dazimuthal angle differenceφeμ,elepton pT sum pTe +pμT andflepton energy sumEe+Eμ, in events with a same- signeμpair and at least oneb-tagged jet. The simulation prediction is normalised to the same integrated luminosity as the data, and bro-
ken down into contributions where both leptons are prompt, or one is a misidentified lepton from a photon conversion originating from a top quark decay or from background, or from heavy-flavour decay. In the peμT ,meμ,peT+pμTandEe+Eμdistributions, the last bin includes the overflows