ATLAS-CONF-2013-077 18July2013
ATLAS NOTE
ATLAS-CONF-2013-077
July 16, 2013
Measurement of the Top Quark Mass in Dileptonic Top Quark Pair Decays with √
s = 7 TeV ATLAS Data
The ATLAS Collaboration
Abstract
This note presents a measurement of the top quark mass in dileptonic top quark pair decays using 4.7 fb
−1of
√s=
7 TeV
ppcollision data recorded by the ATLAS experiment at the Large Hadron Collider in 2011. This event topology is characterised by the presence of two charged leptons, at least two neutrinos and several jets, two of which originate from bottom quarks. Using the template method and the
m`bobservable, defined as the average invariant mass of the two lepton plus
b-jet pairs in each event, the top quark mass is measuredto be 173.09
±0.64 (stat)
±1.50 (syst) GeV.
©Copyright 2013 CERN for the benefit of the ATLAS Collaboration.
Reproduction of this article or parts of it is allowed as specified in the CC-BY-3.0 license.
1 Introduction
The mass of the top quark (m
top) is a fundamental parameter of the Standard Model (SM) of particle physics. The most recent combinations of the measurements performed at the Tevatron [1] and at the LHC [2], based on data luminosities of up to 8.7 fb
−1and 4.9 fb
−1, yield m
top =173.20
±0.51 (stat)
±0.71 (syst) GeV and m
top =173.3
±0.5 (stat)
±1.3 (syst) GeV, respectively. The most precise mea- surements of this type are performed with the production of top quark pairs (t¯ t) in the t¯ t
→lepton+jets channel, i.e. the decay t¯ t
→b`ν bq ¯ q ¯ with
` =e, µ, where one of the W bosons from the t¯ t decays into a charged lepton and a neutrino and the other into a quark-antiquark pair. The LHC at CERN serves as a top quark factory, and thanks to the large sample of t¯ t pairs collected by the ATLAS and CMS exper- iments, analyses exploiting the t¯ t dileptonic final state can also provide precision measurements of the top quark mass.
Compared to the previous preliminary ATLAS measurement in the eµ channel based on a calibration curve method using the mean of the m
T2estimator (the transverse top quark mass) [3], the result presented in this note uses the average invariant mass of the charged lepton plus b-jet systems, m
`b, as an estimator for m
topand determines the top quark mass using the template method [4] which gives better statistical precision.
This note is organised as follows: after a short description of the ATLAS detector in Section 2, the data and Monte Carlo simulated samples are discussed in Section 3. Details of the object definition and event selection are given in Section 4 and the background estimation is explained in Section 5. The description of the reconstruction of the m
`bestimator is given in Section 6, and the template method is explained in Section 7. The evaluation of the systematic uncertainties is discussed in Section 8 and the result of the measurement is given in Section 9. A summary and conclusions are given in Section 10.
2 The ATLAS Detector
The ATLAS detector [5] at the LHC covers nearly the entire solid angle around the collision point
1. It consists of an inner tracking detector surrounded by a thin superconducting solenoid, electromagnetic and hadronic calorimeters, and an external muon spectrometer incorporating three large superconducting toroid magnet assemblies.
The inner-detector system is immersed in a 2T axial magnetic field and provides charged particle tracking in the range
|η| <2.5. The high-granularity silicon pixel detector covers the vertex region and provides typically three measurements per track. It is followed by the silicon microstrip tracker which provides measurements from four double strip layers. These silicon detectors are complemented by the transition radiation tracker, which enables extended track reconstruction up to
|η| =2.0. By providing typically more than 30 straw-tube measurements per track, the transition radiation tracker improves the inner detector momentum resolution, and also provides electron identification information.
The calorimeter system covers the pseudorapidity range
|η| <4.9. Within the region
|η| <3.2, electromagnetic calorimetry is provided by barrel and end cap lead
/liquid argon (LAr) electromagnetic calorimeters, with an additional thin LAr presampler covering
|η| <1.8 to correct for energy loss in material upstream of the calorimeters. Hadronic calorimetry is provided by the steel
/scintillating-tile calorimeter, segmented into three barrel structures within
|η| <1.7, and two copper
/LAr hadronic end- cap calorimeters. The solid angle coverage is completed with forward copper/LAr and tungsten/LAr
1ATLAS uses a right-handed coordinate system with its origin at the nominal interaction point (IP) in the centre of the detector and thez-axis along the beam pipe. Thex-axis points from the IP to the centre of the LHC ring, and theyaxis points upward. Cylindrical coordinates (r, φ) are used in the transverse plane,φbeing the azimuthal angle around the beam pipe. The pseudorapidity is defined in terms of the polar angleθasη=−ln tan(θ/2). Transverse momentum and energy are defined as pT=psinθandET=Esinθ, respectively.
calorimeter modules optimised for electromagnetic and hadronic measurements respectively.
The muon spectrometer comprises separate trigger and high-precision tracking chambers measuring the deflection of muons in a magnetic field with an integral up to 8 Tm in the central region. The precision chamber system covers the region
|η|<2.7 with three layers of monitored drift tubes, complemented by cathode strip chambers in the forward region. The muon trigger system covers the range
|η|<2.4 with resistive plate chambers in the barrel, and thin gap chambers in the endcap regions.
A three-level trigger system is used. The first level trigger is implemented in hardware and uses a subset of detector information to reduce the event rate to a design value of at most 75 kHz. This is followed by two software-based trigger levels, which together reduce the event rate to about 300 Hz.
3 Data and Monte Carlo Samples
Data from LHC proton-proton collisions are used, collected at a centre-of-mass energy of
√s
=7 TeV with the ATLAS detector during the year 2011 and corresponding to an integrated luminosity of 4.7 fb
−1with an uncertainty of 1.8% [6].
Monte Carlo simulated events are used to model the t¯ t signal and most of the background contribu- tions. Production of t¯ t events is simulated using the next-to-leading order (NLO) Monte Carlo program P
owheg-hvq [7] with the NLO parton density function set CT10 [8]. Parton showering, hadronisation and underlying event (i.e. aspects of a hadronic interaction attributed not to the hard scattering process, but rather to the accompanying interactions of the rest of the proton) are modelled using the Pythia [9]
program with the P
erugia2011C tune [10]. Single top quark production in the s and Wt-channels is also generated with P
owheg-hvq and P
ythiausing the same configuration, while single top quark production in the t-channel is simulated using the AcerMC generator [11] interfaced to Pythia. For this analy- sis, the t¯ t and single top quark production samples are generated using seven values of m
topat 2.5 GeV intervals from 165 GeV to 180 GeV, with the largest samples at m
top =172.5 GeV. All t¯ t simulation samples are normalised to the predicted t¯ t cross-section which for pp collisions at a centre-of-mass energy of
√s
=7 TeV is 177
+−1110pb for a top quark mass of 172.5 GeV. It is calculated at next-to- next-to-leading order (NNLO) in QCD including resummation of next-to-next-to-leading logarithmic (NNLL) soft gluon terms with Top++2.0 [12–17]. The PDF+
αSuncertainties are calculated using the PDF4LHC prescription [18] with the MSTW2008 68% CL NNLO [19, 20], CT10 NNLO [8, 21] and NNPDF2.3 5f FFN [22] PDF sets, added in quadrature to the scale uncertainty. The NNLO
+NNLL value, as implemented in Hathor 1.5 [23], is about 3% larger than the plain NNLO prediction. The single top quark production cross sections are normalised to the approximate next-to-next-to-leading order pre- dictions of 64.6 pb [24], 4.6 pb [25] and 15.7 pb [26] for the t, s and Wt-production channels respectively.
The production of W or Z bosons in association with jets is simulated using the Alpgen generator [27]
interfaced to the H
erwig[28] and J
immy[29] packages. Diboson production processes (WW , WZ and ZZ) are simulated using the H
erwiggenerator.
Multiple soft proton-proton interactions are added to all simulated samples. The events are re- weighted such that the distribution of the number of interactions per bunch crossing (pile-up
2) in the simulated samples matches that in the data. The mean number of interactions per bunch crossing for the data of this analysis is about 8.7. The samples are then processed through the GEANT4 simula- tion [30, 31] and the reconstruction software used for ATLAS data.
2Pile-up is the term given to the extra signal produced in the detector byppinteractions other than the one producing the hard scattering event under study.
4 Event Selection
The event selection is based on the following reconstructed objects in the detector: electrons, muons, jets and missing transverse momentum (E
missT). An electron candidate is defined as an energy deposit in the electromagnetic calorimeter with an associated well-reconstructed track [32]. Electron candidates are required to have transverse energy E
T >25 GeV and
|ηcluster|<2.47, where
ηclusteris the pseudorapidity of the electromagnetic cluster associated with the electron. Candidates in the transition region between the barrel and end-cap calorimeter, i.e. candidates fulfilling 1.37
< |ηcluster|<1.52, are excluded. Muon candidates are reconstructed from track segments in di
fferent layers of the muon chambers. These seg- ments are combined starting from the outermost layer, with a procedure that takes material e
ffects into account, and matched with tracks found in the inner detector. The final candidates are refitted using the complete track information, and are required to satisfy p
T >20 GeV and
|η| <2.5. Isolation criteria, with upper limits on the amount of energy deposited near the candidates, are applied to both electron and muon candidates to reduce the background from hadrons mimicking lepton signatures and backgrounds from heavy flavour decays inside jets. For electrons, the energy not associated to the electron cluster and contained in a cone of
∆R
≡q∆φ2+ ∆η2 =
0.2 must not exceed an
ηdependent threshold with a value between 1.4 and 3.7 GeV, after correcting for energy deposits from pile-up, which are of the order of 0.5 GeV. In addition, the total transverse momentum of the tracks contained in a cone of
∆R
=0.3 must not exceed 1 GeV. For muons, the sum of track transverse momenta in a cone of
∆R
=0.3 around the muon is required to be less than 2.5 GeV, and the total energy deposited in a cone of
∆R
=0.2 around the muon is required to be less than 4 GeV. The longitudinal impact parameter of each lepton along the beam axis with respect to the reconstructed primary vertex is required to be less than 2 mm. The primary vertex is defined as the reconstructed vertex with the largest sum of the squares of transverse momenta of the tracks assigned to it.
Jets are built with the anti-k
talgorithm [33] with a radius parameter R
=0.4, starting from energy clusters of adjacent calorimeter cells called topological clusters [34]. These jets are calibrated first by correcting the jet energy using the scale established for electromagnetic objects (EM scale), then per- forming a further correction to the hadronic energy scale using calibration factors, that depend on energy and
η, obtained from simulation, and finally applying a residual in-situ calibration derived from bothdata and Monte Carlo simulation [35, 36]. Jet quality criteria are applied to identify and reject jets re- constructed from energy deposits in the calorimeters originating from particles not emerging from the hard scattering vertex [37]. To avoid selecting jets from additional pp interactions, a fraction (JVF) of the sum of the p
Tof tracks associated with a jet is required to be from the p
Tof tracks compatible with the selected primary vertex:
|JVF|>0.75. Jets with no associated tracks are also accepted.
The reconstruction of E
missTis based upon the vector sum of calorimeter energy deposits projected onto the transverse plane. It is reconstructed from topological clusters, calibrated at the EM scale and corrected according to the type of the associated physics object. Contributions from muons are included by using their momentum measured from the track and muon spectrometer systems in the E
missTrecon- struction.
Overlaps between di
fferent types of objects are removed. Muons reconstructed within a
∆R
=0.4 cone of a jet are removed to reduce the contamination caused by muons from hadron decays within jets.
Electrons are rejected if their distance to the closest jet is smaller than
∆R
=0.4.
To identify jets originating from the hadronisation of b-quarks an algorithm based on a neural-net
relying on topological properties such as the vertex decay length significance, is applied [38]. The chosen
working point of this “MV1” algorithm corresponds to a b-tagging efficiency of 70% for jets originating
from b-quarks in simulated t¯ t events and a light quark jet rejection factor of about 130. To better model
the b-tagging performance in the data, p
Tand
ηdependent scale factors obtained from di-jet events are
applied to Monte Carlo jets, depending on their original flavour [38–40]. They are calculated per jet and
finally multiplied to obtain an event weight applied to any final state distribution. Irrespective of their origin, jets tagged by this algorithm are called b-tagged jets in the following. Whether they are tagged or not, jets originating from b-quarks are called b-jets in the following.
The t¯ t events in the dileptonic final state are characterised by the presence of two isolated leptons with relatively high p
T, E
Tmissarising from the two neutrinos from the leptonic W boson decays, and two b-jets. The selection of events consists of a series of requirements on the general event quality and on the reconstructed objects, designed to select events consistent with this topology. The following event selection is applied:
•
to suppress non-collision background, events are required to have at least one good primary vertex candidate with at least five associated tracks;
•
the event must contain exactly two opposite sign leptons with E
T >25 GeV for electrons and p
T >20 GeV for muons, at least one of which should have fired a single lepton trigger with threshold at least 2 GeV lower;
•
For the e
+e
−and
µ+µ−channels E
missT >60 GeV is required. In the eµ channel H
T >130 GeV is required, where H
Tis the scalar sum of p
Tof the two selected leptons and the jets;
•
in the e
+e
−and
µ+µ−channels m(e
+e
−, µ+µ−)
>15 GeV is required, to reduce background from low mass resonances like mesons decaying to lepton anti-lepton pairs. To reduce the Z
+jets back-ground, values of the invariant mass of the lepton-lepton system compatible with the Z mass are vetoed by requiring
|m(e+e
−, µ+µ−)
−91 GeV
|>10 GeV;
•
the event is required to have
≥2 jets with p
T >25 GeV and
|η| <2.5. It is also required that exactly two of these jets are b-tagged.
For the Monte Carlo simulated samples an additional requirement is imposed. The events are required to contain two true leptons (e or
µ) fromW- or Z-boson decays or from a
τdecay and both selected leptons are required to match these true leptons. The contribution of events with two such “real” leptons are evaluated with the simulated samples, while events with one or more “fake” leptons are evaluated with a data-driven approach (see Section 5).
5 Background Estimation
Physics background processes with two charged leptons from W or Z decay in the final state, which are similar to t¯ t dilepton events, are dominated by single top quark production in the Wt-channel. Addi- tional contributions come from Drell-Yan processes and diboson production with additional jets. These contributions are estimated directly from the MC simulation normalised to the relevant cross sections.
Events may also be wrongly reconstructed as dileptonic t¯ t due to the presence of misidentified, or
“fake”, leptons together with b-tagged jets and E
missT. The term fake lepton is used to indicate jets
wrongly reconstructed as electrons or non-prompt leptons arising from heavy quark decays. The fake
lepton background is estimated using a data-driven matrix method [41]. It has two ingredients: an
estimation of the number of fake leptons in a background enhanced control region with low E
missT, and
a region around the Z peak where true leptons can easily be identified. From these, the probability for a
reconstructed lepton to be a fake is derived as a function of the lepton
ηand p
T, which is then used to
estimate the expected events with fake leptons in the data sample. Thanks to the strict event selection
requirements this background is very low. The matrix method estimate is
−4
±7 events, where the
uncertainty is statistical and systematic, consistent with zero and much smaller than the dominant single
top background. Consequently, this source of background is neglected in the m
topmeasurement.
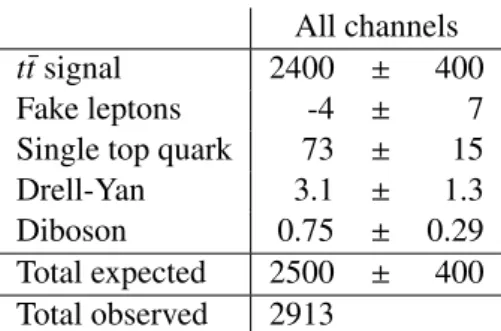
All channels
t¯ t signal 2400
±400
Fake leptons -4
±7
Single top quark 73
±15
Drell-Yan 3.1
±1.3
Diboson 0.75
±0.29
Total expected 2500
±400 Total observed 2913
Table 1: The observed numbers of events in 4.7 fb
−1of
√s
=7 TeV data after the final event selection, for the combination of the e
+e
−, eµ and
µ+µ−channels. The relative fractions of events in data for the different channels are 9%, 67% and 24% for the e
+e
−, eµ and
µ+µ−channels respectively. In addition, the expected numbers of signal and background events corresponding to the integrated luminosity of the data are given. The Monte Carlo estimates assume SM cross sections. The background with fake leptons is estimated from data. The uncertainties for the estimates include the components detailed in the text.
The observed numbers of events in the data after the event selection, together with the expected numbers of signal and background events corresponding to the integrated luminosity of 4.7 fb
−1are given in Table 1. The uncertainty on the t¯ t signal MC is calculated as the quadratic sum of the symmetrised uncertainties from luminosity of 1.8% and cross section calculation of 5.9%, as well as the systematic uncertainties from the jet energy scale, b-jet energy scale and b-tagging scale factor that will be discussed in Section 8. The single top quark cross section uncertainty is taken as 20%. In the Drell-Yan and diboson cases every event is assigned a base uncertainty of 4% and 5% respectively and an additional uncertainty of 24% per jet is added in quadrature [42]. Assuming a top quark mass of m
top =172.5 GeV, the number of events observed in data is about 16% higher than the prediction, but consistent within uncertainties.
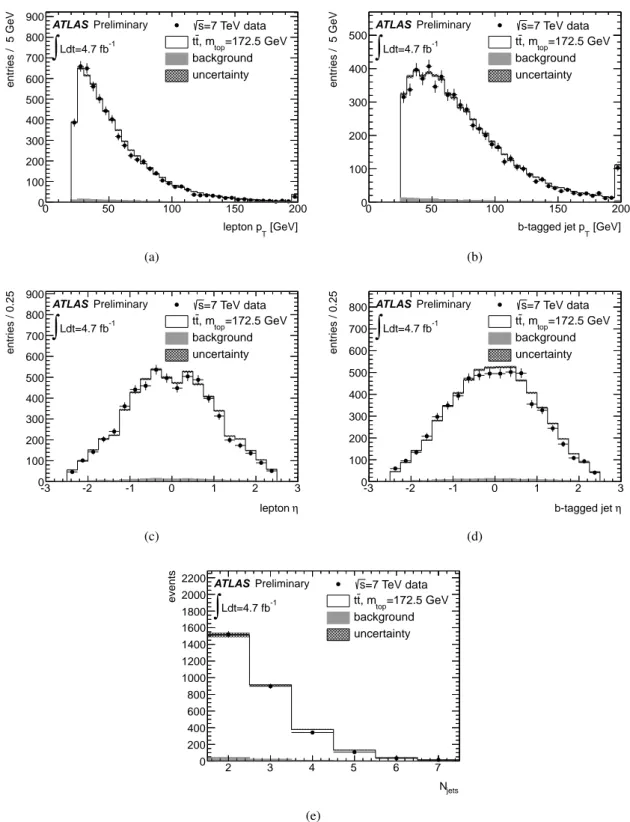
The template method implemented here depends on the shape of the distributions only, and does not rely on the normalisation of the signal plus background prediction. Consequently, shape comparisons of the relevant kinematic observables between data and the predictions are shown in Figure 1. In this figure the sum of the predictions is normalised to the number of events observed in data. In all figures the shape of the data can be properly accounted for by the sum of signal and background predictions.
6 The m
`bEstimator
The m
`bestimator definition is based on the invariant mass of the charged lepton plus b-jet systems.
Selected events contain two charged leptons and two b-tagged jets. There are two possible assignments of the two b-tagged jets to the two charged leptons, each leading to two values for the corresponding pair of invariant masses. For each assignment the average of the two invariant masses is calculated.
Finally, the lowest average mass is taken as the m
`bestimator for the event. The width of the m
`bdistribution depends on the correct assignment of b-quarks to b-tagged jets. Wrong assignments tend to make the distribution wider. The chosen algorithm gives correct assignments in 77% of the cases. The corresponding result can be seen in Figure 2 (a) which shows the observed distribution in data together with the prediction assuming m
top=172.5 GeV.
7 Template Fits and Closure Tests
In the template method, simulated distributions are constructed for a chosen quantity sensitive to the
parameter under study, known as the ’physics parameter’, using a number of discrete values of that
[GeV]
lepton pT
0 50 100 150 200
entries / 5 GeV
0 100 200 300 400 500 600 700 800
900 s=7 TeV data
=172.5 GeV , mtop
t t
background uncertainty ATLAS Preliminary
Ldt=4.7 fb-1
∫
(a)
[GeV]
b-tagged jet pT
0 50 100 150 200
entries / 5 GeV
0 100 200 300 400
500 s=7 TeV data
=172.5 GeV , mtop
t t
background uncertainty ATLAS Preliminary
Ldt=4.7 fb-1
∫
(b)
η lepton
-3 -2 -1 0 1 2 3
entries / 0.25
0 100 200 300 400 500 600 700 800 900
=7 TeV data s
=172.5 GeV , mtop
t t
background uncertainty ATLAS Preliminary
Ldt=4.7 fb-1
∫
(c)
η b-tagged jet
-3 -2 -1 0 1 2 3
entries / 0.25
0 100 200 300 400 500 600 700
800 s=7 TeV data
=172.5 GeV , mtop
t t
background uncertainty ATLAS Preliminary
Ldt=4.7 fb-1
∫
(d)
Njets
2 3 4 5 6 7
events
0 200 400 600 800 1000 1200 1400 1600 1800 2000
2200 s=7 TeV data
=172.5 GeV , mtop
t t
background uncertainty ATLAS Preliminary
Ldt=4.7 fb-1
∫
(e)
Figure 1: Distributions after applying all selection requirements for data (points with error bars), the sum
of signal and background (black line) and for background alone (grey histogram). The signal plus back-
ground prediction is normalised to the number of events observed in data. The uncertainties shown for
data are statistical only. The hatched band indicates the shape uncertainty of the signal and background
contributions due to the jet energy scale, b-jet energy scale and b-tagging scale factor uncertainties. Sub-
figures show the p
Tof leptons and b-tagged jets (a, b) and the pseudo-rapidity of leptons and b-tagged
jets (c, d). Subfigure (e) shows the number of jets in the selected events. The rightmost bin in subfig-
ures (a, b) contains the overflow.
[GeV]
mlb
50 100 150
events / 6 GeV
0 100 200 300 400
500 s=7 TeV data
=172.5 GeV , mtop
t t
background uncertainty ATLAS Preliminary
Ldt=4.7 fb-1
∫
(a)
[GeV]
mlb
50 100 150
normalised events / 5 GeV
0 0.02 0.04 0.06 0.08 0.1 0.12
mtop
165.0 GeV 172.5 GeV 180.0 GeV ATLAS Simulation
Preliminary
(b)
Figure 2: Distributions of m
`bafter applying all selection requirements for data (points with error bars), the sum of signal and background (black line) and for background alone (grey histogram), assuming m
top =172.5 GeV (a). The signal plus background prediction is normalised to the number of events observed in data. The uncertainties shown for data are statistical only. The hatched band indicates the shape uncertainty of the signal and background contributions due to the jet energy scale, b-jet energy scale and b-tagging scale factor uncertainties. The rightmost bin contains the overflow. Dependence of the m
`bdistribution on m
topfor t¯ t Monte Carlo samples generated with di
fferent input top quark masses (b), together with the signal probability density functions obtained from the combined fit to all templates described in Section 7.
parameter. These templates are then fitted to functions that interpolate between di
fferent input values of the physics parameter, fixing all other parameters of the functions. In the final step a likelihood fit of these functions to the observed data distribution is used to obtain the value for the physics parameter that best describes the data. In this procedure, the experimental distributions are constructed such that they are unbiased estimators of the physics parameter used as input in the signal Monte Carlo samples.
Consequently, the top quark mass determined this way from data corresponds to the mass definition used in the Monte Carlo. It is expected that the error introduced by equating this mass definition and the pole mass is of order 1 GeV [43].
Signal and background templates for m
`bare constructed as a function of the top quark mass used in the Monte Carlo generation in the range 165–180 GeV, using separate samples for each of the seven different mass points. The t¯ t signal templates for the m
`bdistributions are fitted to the sum of a Gaussian and a Landau function, while for the background the m
`bdistributions are fitted to a Landau function.
Background templates are dominated by the top quark mass dependent single top quark production. In Figure 2 (b) the sensitivity of the m
`bobservable to the input value of the top quark mass is shown by the superposition of the signal templates and their fits for three input values. The parameters of the fitting functions of m
`bdepend linearly on m
topfor both the signal and background templates. This allows signal and background probability density functions for the m
`bestimator to be built that depend only on m
top. These functions are then used in an unbinned likelihood fit to the data for all events, i
=1, . . . N. The likelihood function maximised is:
L
(m
`b|mtop,r)
=N
Y
i=1
h
(1
−r)
·P
sig(m
`b|mtop)
+r
·P
bkg(m
`b|mtop)
i,
(1)
where P
sigand P
bkgare the signal and background probability density functions and r is the relative
normalisation of the background contribution. The value of r is small, r
=0.03
±0.01, and a fixed
r
=0.03 is used in the likelihood fit.
Using pseudo-experiments on large Monte Carlo samples, a good linearity is found between the input top quark mass used to perform the pseudo-experiments, and the results of the fits. Within their statistical uncertainties, the mean values and widths of the pull distributions are consistent with the expectations of zero and one, respectively. Finally, the expected statistical uncertainty on m
topobtained from pseudo- experiments for an input top quark mass of m
top =172.5 GeV, and for a luminosity of 4.7 fb
−1, is 0.64 GeV.
8 Systematic Uncertainties
The systematic uncertainties are estimated by varying the respective uncertainty source and determin- ing the impact on the mass measurement via pseudo-experiments. Except where stated otherwise this is based solely on MC samples. Wherever applicable the uncertainty sources are varied by one stan- dard deviation (±1σ) with respect to the default value. The resulting average value of the fitted m
topin the pseudo-experiments
hmouttopiis compared to the corresponding value without variation and the differ- ence is used to determine the systematic uncertainty. The MC samples used in the determination of the systematic uncertainties correspond to an integrated luminosity of about 100 fb
−1each, contain events generated using the CT10 PDFs and use the setup described in Ref. [44]. The statistical uncertainty on m
topobtained from each of the MC samples is about 0.2 GeV. For most of the uncertainty sources the same sample is used, but with a changed parameter, such that the observed m
topvalues for the central and the changed sample are highly correlated. In all cases the actual observed difference is quoted as the systematic uncertainty on the corresponding source, even if it is smaller than the statistical precision of the di
fference, following Ref. [45]. The total uncertainty is calculated as the quadratic sum of the individual contributions, i.e. neglecting possible correlations. The sources and systematic uncertainties investigated are listed in Table 2 and their evaluation is explained in the following.
Method calibration: The method has been shown to be unbiased within the statistical precision of the Monte Carlo samples. Any residual mass di
fference between the fitted and the input top quark mass for a given Monte Carlo sample is taken into account by this uncertainty. Consequently, the maximum of the average absolute mass deviation
|mintop− hmouttopi|and its statistical uncertainty observed in the top quark mass variation samples is assigned as the uncertainty from this source.
Signal MC generator: The systematic uncertainty due to the choice of the t¯ t signal generator program is studied by comparing the results of pseudo-experiments performed with samples generated by either the MC@NLO [46, 47] or the Powheg [7] packages both generated with m
top =172.5 GeV and using the H
erwig[28] program to perform the hadronisation. The full difference in the fitted m
topis
∆m
top =0.14 GeV. As a complementary determination, NLO generator scale variation e
ffects are studied by comparing the results of pseudo-experiments performed with two dedicated MC samples generated using MC@NLO interfaced to Herwig with m
top =172.5 GeV, where the renormalisation and factorisation scales are simultaneously varied up by a factor 2, or down by a factor 1
/2. The full di
fference in the fitted mass between the two samples is taken as the uncertainty from the scale variation. This is evaluated to be
∆m
top =0.20 GeV. The larger of the two numbers is quoted as the uncertainty accounting for both e
ffects.
Hadronisation: Signal samples for m
top =172.5 GeV from the P
owhegevent generator are produced
performing the parton showering and the hadronisation with either P
ythiawith the P2011C tune
or Herwig and Jimmy with the ATLAS AUET2 tune [48]. Pseudo-experiments are performed for
each sample, and the full difference of the average results, 0.44 GeV, is quoted as the systematic
uncertainty.
Underlying Event: This systematic uncertainty is estimated using samples simulated with P
owheg-hvq and P
ythia. The uncertainty is obtained by comparing a sample with the P
erugia2011 tune to a sample with the Perugia 2011
mpiHitune [10]. Both tunes use the CTEQ5L PDF [49] for parton shower and hadronisation. The same matrix element level P
owheg-hvq events generated with CT10 PDF are used for both samples. The full di
fference in the fitted mass between the two models is taken as the systematic uncertainty for this source. The Perugia 2011
mpiHitune is a variation of the P
erugia2011 tune with more semi-hard Multiple Parton Interactions. The colour reconnection parameters are kept fixed to the P
erugia2011 tune values. The P
erugia2011
mpiH
itune gives similar predictions to Perugia 2011 for transverse activity against lead-track p
⊥, an observable sensitive to underlying event activity in inclusive proton proton collisions [50]. The samples used for colour reconnection uncertainties yield notably di
fferent predictions for these observables.
Colour Reconnection: The impact of di
fferent models of Colour Reconnection (CR) of the partons en- tering the hadronisation is assessed by comparing samples simulated with Powheg-hvq and Pythia based on the P
erugia2011 tune and the P
erugia2011
noCR tune [10] for parton shower and hadronisation. As for the underlying event systematics, the same matrix element level P
owheg- hvq events generated with CT10 PDF are used for both samples. Compared to the standard Perugia 2011 tune the P
erugia2011
noCR tune leads to significantly less activity in the transverse region with respect to the leading charged particle as measured in Ref. [50]. In addition to the e
ffect of colour reconnection this tune is therefore also used to estimate the systematic uncertainty associ- ated with the particle spectra in the underlying event. The full difference in the fitted mass between the two assumptions on the size of colour reconnection is taken as the systematic uncertainty for this source.
Initial and final state QCD radiation (ISR
/FSR): The uncertainty caused by di
fferent amounts of QCD gluon radiation in the initial state (ISR) and final state (FSR) is determined by comparing two dedicated signal samples generated with A
cerMC in combination with P
ythiaP2011C for hadro- nisation and parton showering. In these samples some P
ythiaP2011C parameters that control the showering are varied in ranges that are compatible with a study of additional jets in t¯ t events [51].
Half of the difference is assigned as the uncertainty.
Proton PDF: The signal samples are generated using the CT10 proton parton distribution functions.
These PDFs, obtained from experimental data, have an uncertainty that is reflected in 26 pairs of additional PDF sets provided by the CTEQ [52] group. To evaluate the impact of the PDF uncertainty on the signal templates, the events, from a sample generated using MC@NLO with H
erwigfragmentation, are re-weighted with the corresponding ratio of PDFs, and 26 pairs of additional signal templates are constructed. Using these templates, 1000 pseudo-experiments are performed per variation pair, using the same events for the up and down variations within each pair to suppress statistical fluctuations. The uncertainty is calculated as half the quadratic sum of di
fferences of the 26 pairs. In addition, the signal samples are also re-weighted to match the central PDF set for either the MSTW2008 [19] or the NNPDF23 [22] PDF set. The corresponding two differences with respect to the central CT10 PDF set are smaller than the uncertainty from the CT10 variations discussed above, which are therefore quoted as the final uncertainty.
Background: The background fraction has an overall uncertainty of about 28% due to the di
fferent
components described in Section 5. To estimate its impact pseudo-experiments are performed
with the background contribution shifted by
±1σ. The mean difference in the average observedmass deviation
|mintop− hmouttopi|to the one observed with the central background value is assigned as
a systematic uncertainty due to the background normalisation.
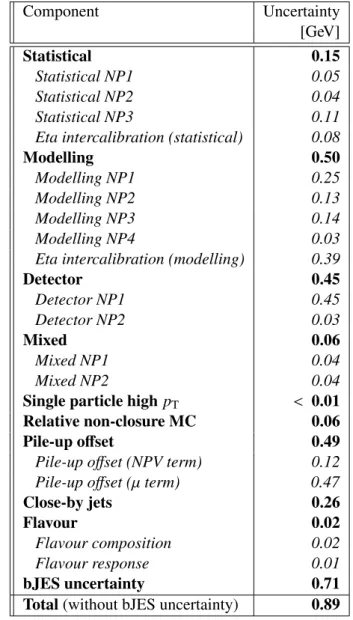
Jet energy scale (JES): The JES is a factor to correct the jet energy measured in the calorimeters for energy loss in the inert material, particle leakage and signal ine
fficiency. The JES is derived using information from test-beam data, LHC collision data and simulation and its uncertainty increases with
ηand decreases with the p
Tof the jet. It amounts to about 1% in the central region for 55
≤p
T <500 GeV and goes up to 6% for low p
Tjets in the forward region [36]. The JES uncer- tainty has various components originating from the calibration method, the calorimeter response, the detector simulation, and the specific choice of parameters in the physics model employed in the MC event generator. A parameterisation with 21 uncorrelated components (20 for the JES uncertainty plus the bJES uncertainty discussed below) is used, as described in Ref. [36]. The JES is independently varied for each of the components by
±1σwith respect to the default value, de- pending on jet p
Tand
η, and theE
missTis adjusted accordingly. For each component, the top quark mass is fitted for the up and down variation, and half the difference is taken as the uncertainty due to this component. Finally, to obtain the total uncertainty on m
topdue to the JES uncertainties, the 20 individual JES uncertainties are summed quadratically. The uncertainties for the individual components and their sum are given in Table 3 in Appendix A.
Relative b-jet energy scale (bJES): This uncertainty is uncorrelated with the JES uncertainty and ac- counts for the remaining differences between jets originating from light quarks and those originat- ing from b-quarks after the global JES has been determined. The bJES uncertainty is about 1.8%
for low p
Tjets and smaller than 0.7% for jets with p
T>200 GeV. For the uncertainty estimation the bJES is shifted by
±1σin every
η/p
Tbin and the E
missTis adjusted accordingly. The maximum mass di
fference with respect to the default sample is taken as the symmetric uncertainty from this source.
b-tagging e
fficiency and mistag rate: The b-tagging scale factors account for di
fferences in the e
ffi- ciency and mistag rate of the b-tagging algorithm between data and MC [38–40]. They are derived for a given b-tagging working point together with their uncertainties for every jet according to its p
Tand
η. Theb-tagging scale factors are varied within their uncertainties. The maximum dif- ference to the default sample is taken as the uncertainty. Various assumptions on the correlations between the b-tagging scale factors uncertainties as a function of p
Thave been studied and found to result in similar uncertainties on m
top.
Jet energy resolution: To assess the impact of this uncertainty, before performing the event selection, the energy of each reconstructed jet in the simulation is additionally smeared by a Gaussian func- tion such that the width of the resulting Gaussian distribution corresponds to the one including the uncertainty on the jet energy resolution [53]. The mass di
fference with respect to the unsmeared case is taken as the uncertainty.
Jet reconstruction e
fficiency: The jet reconstruction e
fficiency for data and the Monte Carlo simulation are found to be in agreement with an accuracy of better than 2% [35]. To account for the remaining uncertainty, 2% of the jets are randomly removed from the events. The event selection and the fit are repeated on the changed sample. The e
ffect on the measured top quark mass is negligible.
Missing transverse momentum: The impact of a possible miscalibration of the E
missTis assessed by changing the energy scale and resolution of the soft calorimeter energy deposits within their un- certainties. These energy deposits, which are not included in the reconstructed jets and leptons, only contribute to E
Tmiss.
Pile-up: To investigate the uncertainty due to the presence of additional proton-proton interactions in the
event, the fit is repeated in data and simulation at m
top =172.5 GeV as a function of the number
of reconstructed vertices n
vtxand the average number of interactions per bunch crossing
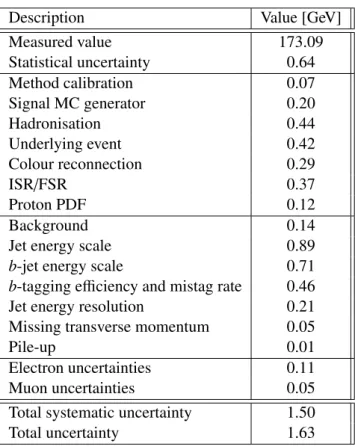
hµi. TheDescription Value [GeV]
Measured value 173.09
Statistical uncertainty 0.64
Method calibration 0.07
Signal MC generator 0.20
Hadronisation 0.44
Underlying event 0.42
Colour reconnection 0.29
ISR/FSR 0.37
Proton PDF 0.12
Background 0.14
Jet energy scale 0.89
b-jet energy scale 0.71
b-tagging efficiency and mistag rate 0.46
Jet energy resolution 0.21
Missing transverse momentum 0.05
Pile-up 0.01
Electron uncertainties 0.11
Muon uncertainties 0.05
Total systematic uncertainty 1.50
Total uncertainty 1.63
Table 2: The measured value of m
topand the contributions of the various sources detailed in the text to the total systematic uncertainty.
sample is divided in three parts corresponding to different n
vtxand
hµiand the mass is measured for each of those partitions. In both cases the change of m
topin data is reproduced by MC within statistical uncertainties. However, a possible residual e
ffect on m
topis assessed by computing the sum of the differences of a linear interpolation of the fitted masses to the full sample in every n
vtxand
hµibin in simulation, weighted either with the relative frequency of observing a given n
vtxand
hµiin data, or with the corresponding frequencies in simulation. The di
fference of the sums in data and simulation is taken as the uncertainty from this source.
Electron and muon uncertainties: This category takes into account the uncertainties in the e
fficiency of the trigger, in the identification and reconstruction of electrons and muons, as well as residual uncertainties due to a possible miscalibration of the lepton energy scales. The number quoted is the quadratic sum of all the studied components and is dominated by the uncertainty on the lepton energy scales.
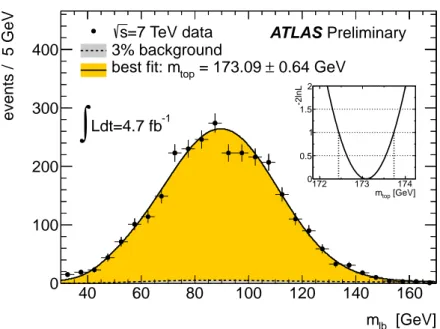
9 Results
The result of the fit to 2011 ATLAS data in the dileptonic t¯ t decay channel is:
m
top =173.09
±0.64 (stat)
±1.50 (syst) GeV
Figure 3 shows the m
`bdistribution in data together with the corresponding fitted probability density functions for signal plus background and for the background contribution alone. The inset shows the
−2 lnL
profile as a function of the fitted top quark mass. The vertical lines correspond to
±1σof the
[GeV]
mlb
40 60 80 100 120 140 160
events / 5 GeV
0 100 200 300 400
=7 TeV data s
3% background
0.64 GeV
± = 173.09 best fit: mtop
[GeV]
mtop
172 173 174
-2lnL
0 0.5 1 1.5 2
ATLAS Preliminary
Ldt=4.7 fb-1
∫
Figure 3: Fitted m
`bdistribution in data. The fitted probability density functions for the signal plus background and for the background contribution alone are also shown. The inset shows the
−2 lnLprofile as a function of the fitted top quark mass.
statistical uncertainty. The result has a total uncertainty similar to that of the ATLAS m
topmeasurement in the l
+jets channel [54]. As expected from an analysis without in-situ calibration of the jet energyscale, the systematic uncertainty on m
topis dominated by the uncertainties stemming from the imperfect knowledge of the jet energy calibration.
Compared to the previous ATLAS result in the eµ channel based on the mean of the m
T2estimator [3], a number of improvements have been made to reduce both the statistical and systematic uncertainties.
For this analysis the e
+e
−and
µ+µ−channels are also used. Due to the better understanding of systematic effects some phase space restrictions were removed, for example reducing the p
Tcut on jets and muons. The expected statistical precision of the template method for the m
T2and the m
`bestimators is very similar, however the template method o
ffers better precision than using the mean of the distribution. As a consequence the statistical precision on the same data sample is significantly improved. The choice of the m
`bestimator, i.e. not requiring a full event reconstruction, reduces the sensitivity of the measurement to some systematic e
ffects, most notably to initial and final state QCD radiation and the energy scales.
The improved understanding of the final state distributions in t¯ t events helps to reduce the magnitude of the variations performed in the Monte Carlo simulations for evaluating the systematic uncertainties.
Based on a measurement of the jet multiplicity distributions in t¯ t events [51], the ISR and FSR variations
could be reduced, mainly for the ISR part. In addition, a better understanding of the detector together
with changes in the JES calibration procedure, now using in-situ techniques, leads to a relative reduction
of the bJES uncertainty [55] by about 40%, which in turn reduces the bJES uncertainty on m
top. On
the m
topanalysis side, the default signal Monte Carlo has been changed from MC@NLO with H
erwigto P
owhegwith P
ythiausing the P
erugia2011C tune, because it provides an improved description of
some observed quantities [56]. Due to this change, the systematic uncertainties stemming from the
underlying event and colour reconnection are now evaluated with the P
owheggenerator with P
ythiafor
the parton shower and hadronisation, and using the P
erugia2011C tune, consistently with the default
signal MC samples. To suppress statistical effects, the sample size in the Monte Carlo comparisons
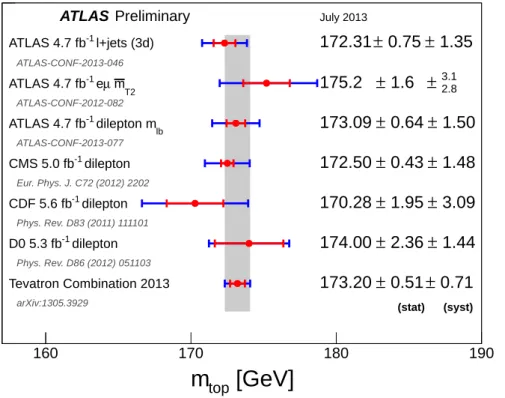
[GeV]
m
top160 170 180 190
0.5 9
0.00
± 0.00
± 0.00
Tevatron Combination 2013
173.20 ± 0.51 ± 0.71
arXiv:1305.3929
dilepton
D0 5.3 fb-1
174.00 ± 2.36 ± 1.44
Phys. Rev. D86 (2012) 051103
dilepton
CDF 5.6 fb-1
170.28 ± 1.95 ± 3.09
Phys. Rev. D83 (2011) 111101
dilepton
CMS 5.0 fb-1
172.50 ± 0.43 ± 1.48
Eur. Phys. J. C72 (2012) 2202
dilepton mlb
ATLAS 4.7 fb-1
173.09 ± 0.64 ± 1.50
ATLAS-CONF-2013-077
mT2
µ
-1 e
ATLAS 4.7 fb
175.2 ± 1.6 ±
2.83.1ATLAS-CONF-2012-082
l+jets (3d)
ATLAS 4.7 fb-1
172.31 ± 0.75 ± 1.35
ATLAS-CONF-2013-046
ATLAS Preliminary July 2013
(stat) (syst)