A TLAS-CONF-2019-046 17 October 2019
ATLAS CONF Note
ATLAS-CONF-2019-046
30th September 2019
Measurement of the top quark mass using a leptonic invariant mass in p p collisions at √
s = 13 TeV with the ATLAS detector
The ATLAS Collaboration
A measurement of the top quark mass ( m t ) in the t t ¯ → lepton + jets channel is presented, with an experimental technique which exploits semileptonic decays of b -hadrons produced in the top-quark decay chain. The distribution of the invariant mass m `µ between the lepton, ` (with ` = e, µ ), from the W -boson decay and the muon, µ , originating from the b -hadron decay is reconstructed, and a binned-template profile likelihood fit is performed to extract m t . The measured value of the top quark mass is m t = 174 . 48 ± 0 . 40 ( stat ) ± 0 . 67 ( syst ) GeV, based on data corresponding to an integrated luminosity of 36.1 fb − 1 of
√ s = 13 TeV pp collisions provided by the Large Hadron Collider and recorded by the ATLAS detector.
© 2019 CERN for the benefit of the ATLAS Collaboration.
Reproduction of this article or parts of it is allowed as specified in the CC-BY-4.0 license.
1 Introduction
The large mass of the top quark plays a role in much of the dynamics of elementary particles via loop diagrams. Linked by the gauge structure of the Standard Model (SM), the large top quark mass affects very significantly the radiative corrections to the Higgs boson and W -boson masses, establishing a relationship that can be used for precision tests of the consistency of the SM [1]. Furthermore, a precise measurement of the top quark mass is required to predict the evolution of the Higgs quartic coupling at high scales [2] [3].
If performed with a precision of the order of a few hundred MeV, the direct reconstruction of the top quark mass from its decay products, and the indirect measurements from top quark production cross-sections or kinematic distributions, are important not only for the constraints mentioned above, but also because of the ambiguity and challenges offered by the theoretical interpretation of such measurements [4, 5].
In this paper, a direct measurement of the top quark mass ( m t ) is presented using a technique that exploits a partial, leptonic-only, invariant mass reconstruction of the top-quark decay products. The analysis is performed from a sample of reconstructed t¯ t events in the ` +jets channel. In the top-quark decay t → W b , the invariant mass m `µ between the lepton ` (with ` = e, µ ) from the W -boson decay and the muon µ from a semileptonic decay of a b -hadron, is constructed as the observable sensitive to the parent m t value. The advantages of a strategy based on leptonic variables for the measurement of the top quark mass rest mainly on the smaller sensitivity to the jet energy calibration and energy resolution, compared to the standard direct reconstruction methods, and on less sensitivity to top-quark production modelling (owing to the boost-invariant construction) than in methods based on the W lepton alone. Furthermore, methods with different types of systematic uncertainties are important for combining measurements, and to test the consistency of the theoretical interpretation of the top quark mass.
The m `µ distribution from models with different top quark mass hypotheses is compared to data, and the optimal value of m t is determined from a binned-template profile likelihood fit. A similar technique was first employed by the CDF Collaboration at the Tevatron collider [6], and a closely-related analysis with J /ψ decays has been presented by the CMS Collaboration [7]; however both these analyses yielded uncertainties on m t of several GeV. To date, the most precise measurement of the top quark mass in the t¯ t → ` +jets channel by the ATLAS Collaboration is m t = 172 . 08 ± 0 . 39(stat) ± 0 . 82(syst) GeV, whereas combining multiple ATLAS measurements gives m t = 172 . 69 ± 0 . 48 GeV [8]. The CMS Collaboration reports its most precise combination as m t = 172 . 44 ± 0 . 48 GeV [9], and the Tevatron experiments report a combined value of m t = 174 . 30 ± 0 . 65 GeV [10].
2 ATLAS experiment
The ATLAS experiment [11] at the LHC is a multipurpose particle detector with a forward–backward symmetric cylindrical geometry and a near 4 π coverage in solid angle 1 . It consists of an inner tracking detector surrounded by a thin superconducting solenoid providing a 2 T axial magnetic field, electromagnetic and hadronic calorimeters, and a muon spectrometer. The inner tracking detector covers the pseudorapidity range |η| < 2 . 5 and consists of silicon pixel, silicon microstrip, and transition radiation tracking detectors.
1 ATLAS uses a right-handed coordinate system with its origin at the nominal interaction point (IP) in the centre of the detector and the z-axis along the beam pipe. The x-axis points from the IP to the centre of the LHC ring, and the y-axis points upwards.
Cylindrical coordinates ( r , φ ) are used in the transverse plane, φ being the azimuthal angle around the z -axis. The pseudorapidity is defined in terms of the polar angle θ as η = − ln tan ( θ / 2 ) . Angular distance is measured in units of ∆R ≡ p
∆η ) 2 + (∆φ ) 2 ) .
The innermost layer, known as the insertable B-Layer [12, 13], was added in 2014 and provides high- resolution hits at small radius to improve the tracking performance. Lead/liquid-argon (LAr) sampling calorimeters provide electromagnetic (EM) energy measurements with high granularity. A hadronic (steel/scintillator-tile) calorimeter covers the central pseudorapidity range ( |η| < 1 . 7). The endcap and forward regions are instrumented with LAr calorimeters for both the EM and hadronic energy measurements up to |η | = 4 . 9. The muon spectrometer surrounds the calorimeters and is based on three large air-core toroid superconducting magnets with eight coils each and bending power of 2.0 to 7.5 Tm. It includes a system of precision tracking chambers covering the region |η| < 2 . 7 and fast detectors for triggering in the range |η| < 2 . 4. A two-level trigger system was used to select events [14]. The first-level trigger is implemented in hardware and used a subset of the detector information to reduce the accepted rate to at most 100 kHz. This is followed by the software-based high-level trigger, which reduces the event rate to around 1 kHz.
3 Data and Simulation
3.1 Data sample and object definition
The analysis is performed with the 2015 and 2016 proton–proton collision data sample produced by the LHC at a centre-of-mass energy of
√ s = 13 TeV and collected by the ATLAS experiment, corresponding to an integrated luminosity of 36.1 fb − 1 [15]. The data analysed were recorded during stable beam conditions and with all relevant ATLAS detector subsystems operational.
Electron candidates are reconstructed from energy deposits (clusters) in the electromagnetic calorimeter associated to reconstructed tracks in the inner detector. Candidates in the calorimetry transition region 1 . 37 < |η cluster | < 1 . 52 are excluded. Muon candidates are reconstructed from track segments in the layers of the muon spectrometer, and matched with tracks found in the inner detector. The final muon candidates are refit using the complete track information from both detector systems. Candidate jets are reconstructed from three-dimensional topological EM-scale energy clusters [16] in the calorimeter using the anti-k t jet algorithm [17] with a radius parameter R = 0 . 4. The reconstructed jets are calibrated to the level of stable-particle jets by the application of a jet energy scale (JES) derived from simulation and in situ corrections based on 13 TeV data [18]. The missing transverse momentum, E T miss , is defined as the magnitude of the negative vector sum p T of all reconstructed and calibrated physics objects in the event, with an extra term added to account for soft energy in the event that is not associated to any of the reconstructed objects [19]. This soft term is calculated from inner detector tracks matched to the primary vertex to make it more resilient to contamination from multiple pp collisions in the same or neighbouring bunch crossings (pileup) .
3.2 Object and event selections
The event selection is designed to collect a sample of t¯ t candidate events in the final state `νb j j 0 b ¯ , where
` = e, µ , the j j 0 are the jets produced in the decay of the W boson to quarks, and at least one of the
b -originated jets displays a semileptonic muon decay from a b -hadron. The goal is to select events where
the lepton ` from the W boson and the b -originated jet with the muon from semileptonic decay come from
the same top quark.
Events are required to pass either a single-electron or single-muon trigger. Multiple trigger types were used:
the lowest-threshold triggers include isolation requirements to reduce the trigger rate, and had transverse momentum ( p T ) thresholds of 20 GeV for muons and 24 GeV for electrons in 2015 data, or 26 GeV for both lepton types in 2016 data [20] [21]. These triggers were complemented by others with higher p T thresholds and no isolation requirements to increase event acceptance. Events must have at least one reconstructed vertex, i.e. at least two tracks with p T > 0 . 4 GeV consistent with the beam-collision region in the x – y plane. If multiple vertices are reconstructed, the vertex with the largest sum of the squared transverse momenta of its associated tracks is taken as the primary vertex.
After trigger preselection, events are selected based on the presence of a candidate electron or muon from the decay of a W boson, called “primary” leptons. Electron candidates must pass a “tight” likelihood-based identification criterion [22], be matched to the corresponding trigger, have p T > 27 GeV, |η| < 2.47 with the exclusion of 1.37 < |η | < 1.52, longitudinal impact parameter |z 0 sin θ | < 0.5 mm and transverse impact parameter significance | d 0 /σ(d 0 )| < 5, where σ(d 0 ) is the uncertainty in the transverse impact parameter. To reduce background from non-prompt electrons, photon conversions and hadrons, the prompt electrons must pass an isolation requirement based on the surrounding tracks and topological clusters in the calorimeter [22]. Muon candidates as primary leptons must pass a “medium” quality identification criterion [23], be matched to the corresponding trigger, have p T > 27 GeV, |η| < 2.5, longitudinal impact parameters |z 0 sin θ | < 0.5 mm and transverse impact parameter significance |d 0 /σ(d 0 )| < 3. To reduce background from non-prompt muons and hadrons, muon candidates of this type must pass an isolation requirement based on the surrounding tracks and topological clusters in the calorimeter, and be separated by ∆R > 0 . 4 from the nearest selected jet. If the nearest selected jet is within ∆R ≤ 0 . 4 of the muon and has less than three associated tracks, the muon is kept and the jet is removed from the jet list, to ensure high efficiency for muons undergoing significant energy loss in the calorimeter. Events with more than one candidate primary lepton with p T > 25 GeV are vetoed, in order to reject events from the t¯ t dileptonic decay channel.
Jet candidates are required to have p T > 25 GeV and |η | < 2 . 5. A multivariate jet-vertex-tagger (JVT) is
applied to suppress jets from pileup, requiring the JVT parameter to be greater than 0.59 for those jets
with p T < 60 GeV and |η | < 2 . 4 [24]. During jet reconstruction, no distinction is made between identified
electrons and jet energy deposits. Therefore, if any of the jets lie within ∆R of 0.2 of a selected electron,
the single closest jet is discarded in order to avoid double-counting of electrons as jets. After this, electrons
which are within ∆R of 0.4 of a remaining jet are removed. Jets are identified as originating from a b
quark ( b -tagged) using two techniques, one based on the reconstruction of a displaced jet vertex (DV
tagging) and the other based on the semileptonic decay of a b -hadron into a so-called “Soft muon” (SMT
tagging). For the DV, multivariate techniques are used to combine information from the impact parameter
of displaced tracks as well as topological properties of secondary and tertiary decay vertices reconstructed
within the jet [25]. The algorithm is trained on simulated t t ¯ events to discriminate b -jets from a background
consisting of light-flavour jets and c -jets. A selection corresponding to an efficiency of 77% for b -jets
in t¯ t events is employed. The SMT tagging is performed by requiring the presence of a muon candidate
passing the “tight” quality identification criterion [23], p T > 8 GeV and |η| < 2 . 5, with loose requirements
on the impact parameter ( |d 0 | < 3 mm, | z 0 sin θ | < 3 mm) and within a distance ∆R < 0.4 of a selected
jet candidate. The definition of the muon object for the SMT tagging has been optimised by maximising
the efficiency for muons originating from the semileptonic decays of b hadrons (selecting approximately
50% of b -jets containing a muon, which are in turn 20% of all b -jets produced in t¯ t events), minimising
the mis-identification rate (about 10 − 3 per light jet), and minimising the uncertainty on the measured top
quark mass. If more than one muon passing the criteria above is found within a given jet, the muon with
the highest p T is chosen. The background to SMT muons from heavy-flavour decays is mostly due to the decays of pions and kaons from light-flavour jets.
Events must have at least one SMT-tagged jet and one DV-tagged jet (which could be the same jet), among a total of at least four candidate jets with p T > 30 GeV (with the exception of the SMT-tagged jet which may have a p T as low as 25 GeV). If more than one SMT-tagged jet is found in the event, only the one with the highest p T muon is considered. The SMT muon and the primary lepton must be separated by
∆R `,µ < 2. Finally, the presence of at least one neutrino in the final state is inferred from the requirements that E T miss > 30 GeV and E T miss + m T (W) > 60 GeV. 2 The selected sample is categorised as same-sign (SS) events or opposite-sign (OS) events according to the charge signs of the primary lepton and the soft muon. Opposite-sign events are enriched in direct b → µX decays, while same-sign events have a large contribution from sequential b → cX 0 → µX 00 , but both samples carry information on the mass of the parent top quark. The requirement that the SMT muon and the primary lepton must be separated by
∆R `,µ < 2 enhances the fraction of events where both leptons come from the same top quark, in contrast to events where the two leptons originate from different top quarks. Finally, the invariant mass between the primary lepton and the soft muon ( m `µ ) is required to be between 15 and 80 GeV, as this is the region most sensitive to the top quark mass. This requirement also suppresses the Z -boson, J/ψ and Υ resonances.
The main backgrounds to candidate signal events come from the production of a single top quark, and from a W - or Z -boson in association with jets. A small background contribution arises from diboson ( WW , W Z , Z Z ) production. Events not containing real prompt leptons also contribute to the selected sample via the mis-identification of a jet or a photon as an electron, or the presence of non-prompt electrons or muons passing the prompt isolated lepton selection. This contribution is referred to as “multijet” background, and estimated in data following the matrix method described in Ref. [26].
3.3 Monte Carlo simulations
A number of Monte Carlo (MC) simulation samples are used to model the expected signal of top quark pairs and the background. The MC samples were processed either through the full ATLAS detector simulation [27] based on Geant4 [28], or through a faster simulation making use of parametrised showers in the calorimeters [29]. Additional simulated pp collisions generated using Pythia-8.186 [30] with the MSTW2008 [31, 32] LO PDF set and the AUET2 [33] tune were overlaid to model the effects of both in- and out-of-time pileup. They are superimposed on the MC events, matching the luminosity profile of the recorded data. All simulated samples were processed through the same reconstruction algorithms and analysis chain as the data. Simulated MC events are corrected so that the object identification efficiencies, energy and momentum scale and resolution match those determined from data control samples. The modelling of SMT muons and their mis-identification is studied using control samples as well. The calibration of the mis-identification rate is performed using a sample of W +1 jet events, as in Ref. [34]. A data to simulation scale factor (SF) of 1.10 ± 0.14 is derived. The efficiency for the muon identification in jets is calibrated using muons from the decays of J /ψ and Z , and checked as a function of the surrounding track and calorimeter activities, and of the muon transverse impact parameter d 0 . The p T of jets which contain a soft muon is corrected in the simulation with a factor of 0.967 ± 0.024, to match the profile in data of the ratio of p T between the SMT-tagged jet and the average non-SMT tagged jet.
2 The m T ( W ) = q 2 p `
T E miss
T ( 1 − cos ∆φ ) , where p `
T is the transverse momentum (energy) of the muon (electron) and ∆φ is the
azimuthal angle separation between the lepton and the direction of the missing transverse momentum.
The t t ¯ sample is generated using the hvq program [35] in the Powheg-Box V2 generator [36, 37] with the NNPDF3.0 parton distribution function (PDF) set [38] and the top quark mass set to 172.5 GeV.
Additional samples with different top quark mass hypotheses were produced in the range of m t between 165 and 180 GeV, with steps of 0.5 GeV between 170 and 175 GeV. The hv q program uses on-shell matrix elements for next-to-leading (NLO) order in Quantum Chromodynamics (QCD) production of t t ¯ pairs.
Off-shell effects and top-quark decays, including spin correlations, are introduced in an approximate way with Madspin [39]. Parton shower and hadronisation are modelled by Pythia 8.2 [30] using a dedicated A14- r b setting as explained later in this section. Radiation in top quark decays is fully handled by the parton-shower generator, which implements matrix-element corrections with accuracy equivalent to the NLO level. The h damp parameter, which controls the p T of the first additional emission beyond the Born configuration, is set to 1.5 times the top quark mass of m t = 172 . 5 GeV. The main effect of the h damp setting is to regulate the high- p T emission against which the t t ¯ system recoils. The ATLAS A14 [40] tune is based on LEP and Tevatron collider data and further uses a combination of ATLAS measurements from the 7 TeV collision data of underlying event, jet production, Z -boson production and top quark production to constrain the shower, multiple parton interactions and colour reconnection parameters. In addition, the StringZ:rFactB Pythia8 parameter (called henceforth r b ) of the fragmentation function was determined based on the b -quark fragmentation measured in e + e − collision data and extrapolated to proton–proton collisions, as described in Sec. 3.4. This setting is referred to as A14- r b and is used in all MC samples using Pythia8 for the simulation of the parton shower.
The EvtGen v1.2.0 [41] program is used to simulate the bottom and charm hadron decays. The production fractions and the branching ratios (BR) of the decay of b -hadrons and c -hadrons to muons are rescaled to the latest values from the Particle Data Group (PDG) [1], as detailed in Sec. 3.4. The simulated t¯ t event sample is normalised to the top++2.0 [42] theoretical cross section of 832 +46 −
51 pb, calculated at next-to-next-to-leading order (NNLO) in QCD that includes resummation of next-to-next-to-leading logarithmic (NNLL) soft gluon terms [43–47].
Samples of W/Z +jets events and diboson production in association with jets, are simulated using the Sherpa 2.2.1 [48] generator. In the W/Z +jets samples, matrix elements are calculated for up to two partons at NLO and four partons at leading order (LO) using the Comix [49] and OpenLoops matrix element generators and merged with the Sherpa parton shower [50], using the ME+PS@NLO prescription [51].
The CT10 PDF set is used in conjunction with dedicated parton shower tuning developed by the Sherpa authors. The normalisation of the W +jet background and the relative fractions of W boson associated with heavy flavour quark are extracted from data, taking advantage of the intrinsic W charge-asymmetry of the process [52]. The Z +jets contribution is estimated from MC simulation and checked in a data control sample. The diboson+jets samples are generated following the same approach but with up to one ( Z Z ) or zero ( WW, W Z ) additional partons at NLO and up to three additional partons at LO. They are normalised to their respective theoretical NLO cross sections calculated by the generator.
Samples of Wt and s -channel single top quark background events are generated with Powheg-Box V1
and V2, respectively, with the CT10 PDF set. Overlaps between the t¯ t and Wt final states are removed
with the diagram removal prescription [53]. Electroweak t -channel single top quark events are generated
using the Powheg-Box V1 generator which uses the four-flavour scheme for the NLO matrix elements
calculations together with the fixed four-flavour PDF set CT10f4. For this process, the top quarks are
decayed using MadSpin [54], preserving all spin correlations. All single top quark samples are interfaced
to Pythia 6.428 [55] with the Perugia 2012 [56] underlying-event tune. The EvtGen v1.2.0 program is
used to model properties of the bottom and charm hadron decays. The single top quark t - and s -channel
samples are normalised to the approximate NNLO theoretical cross sections [57–59].
3.4 Modelling of heavy-quark fragmentation, hadron production and decays
The modelling of the momentum transfer between the b -quark and the b -hadron is an important aspect of this analysis. Monte Carlo event generators, such as the Pythia, Herwig [60, 61] and Sherpa programs, describe this transition according to phenomenological models, namely the string and cluster models containing parameters which are tuned to data. Pythia8 allows the use of several parameterisations for the b -quark fragmentation function, while Herwig7 and Sherpa use a non-parametric model which handles the complete parton shower evolution. The free parameters in those models are typically fit to measurements from e + e − colliders, and this analysis assumes that b -quark fragmentation properties at a reference q 2 scale are the same in e + e − and hadron collisions.
In this analysis, the Lund-Bowler parametrisation [62, 63] for Pythia8 is used. It is given by:
f (z) = 1 z 1+br b m 2 b
( 1 − z) a exp (−bm 2
T /z), (1)
where a , b and r b are the function parameters, m b is the b -quark mass, m T the b -hadron transverse mass and z is the fraction of the longitudinal energy of the b -hadron with respect to the b -quark, in the light cone reference frame. The fragmentation function is defined at the hadronisation scale and it is evolved by the parton shower to the process scale through DGLAP evolution equations. In Pythia8, the values of a and b have been fitted to data sensitive to light quark fragmentation [64], such as charged multiplicities, event shapes and scaled momentum distributions. They are then assumed to be universal between light and heavy quarks, while the r b parameter is specific to b -quark fragmentation. To improve the description of b -quark fragmentation, following Refs. [65–68], a fit is performed for the r b parameter in Pythia8 using data from ALEPH, DELPHI and OPAL at the LEP collider, and from the SLD experiment at the SLC collider [69–72] The distribution of x B = 2 p B · p Z /m 2 Z from semileptonically decaying b -hadrons in e + e − → Z → b b ¯ events is used, where p B and p Z are the four-momenta of the b -hadron and the Z , respectively. In the Z rest frame, m Z is twice the beam energy and therefore x B = 2 E B /m Z , where E B is the energy of the b -hadron. The fit is performed using Professor v2.2 [73] for the minimisation, and Rivet v2.5.4 [74] for the implementation of the measurements and gives the result r B = 1 . 05 ± 0 . 02.
The production fractions of weakly decaying b - and c -hadrons described in Powheg+Pythia8 MC simulation with EvtGen are rescaled to those from the Heavy Flavour Averaging Group (HFLAV) [75] as reported in the PDG [1] and in Ref. [76]. The production fraction values and corresponding scale factors for Powheg+Pythia8 simulations are shown in Table 1. Scale factors are applied to each heavy-quark hadron present in a MC simulated event, with the overall event weight given by the product of all heavy-quark hadrons in that event.
The branching ratios of the b - and c -hadron decays that contain a µ are also adjusted to match those
as measured by previous experiments [1]. Central values and relative scale factors, along with the
corresponding uncertainties, are shown in Table 2. The b → c ¯ → µ branching ratio was determined
averaging the direct measurement from DELPHI [77] and the predicted values computed by the LEP
Electroweak Heavy Flavour Working Group [78]. The latter prediction was based on flavour-specific
B → D and B → Λ + c rates measured at CLEO [79–81] in combination with the B → DD( X) rates
measured in ALEPH [82] to extract the probabilities of producing the different c -hadrons from the initial
b -hadrons decays. The c -hadron semileptonic branching fractions were also used in the prediction. The
c → µ scale factor is applied only to the semileptonic decays of c -hadrons to muons when the c -hadrons
do not come from a cascade b -hadron decay.
Table 1: The production fraction values for b -hadrons and c -hadrons in the PDG and Powheg+Pythia8. The values under the PDG column are derived from Ref. [1] and [76]. The same scale factors are applied to the charge-conjugate hadrons.
Hadron PDG (%) Powheg+Pythia8 Scale Factor
B 0 0.404 ± 0.006 0.429 0.941
B + 0.404 ± 0.006 0.429 0.942
B 0 s 0.103 ± 0.005 0.095 1.088
b -baryon 0.088 ± 0.012 0.047 1.874
D + 0.226 ± 0.008 0.290 0.780
D 0 0.564 ± 0.015 0.553 1.020
D 0 s 0.080 ± 0.005 0.093 0.857
c -baryon 0.109 ± 0.009 0.038 2.898
Table 2: Hadron to µ branching ratios and scale factors applied to Powheg+Pythia8. The values under the PDG column are derived from Ref. [1] and [76]. The c → µ scale factor is applied only to the semileptonic decays of c -hadrons to muons when the c -hadrons do not come from a cascade b -hadron decay. The same scale factors are applied to the charge conjugate hadrons.
Hadron PDG Powheg+Pythia8 Scale Factor
b → µ 0 . 1095 +0 − 0 . . 0029 0025 0.106 1.032
b → τ 0 . 0042 ± 0 . 0004 0.0064 0.661
b → c → µ 0 . 0802 ± 0 . 0019 0.085 0.946 b → c ¯ → µ 0 . 016 +0 − 0 . . 003 003 0.018 0.888
c → µ 0 . 082 ± 0 . 005 0.084 0.976
4 Analysis
4.1 Event yields and sample composition
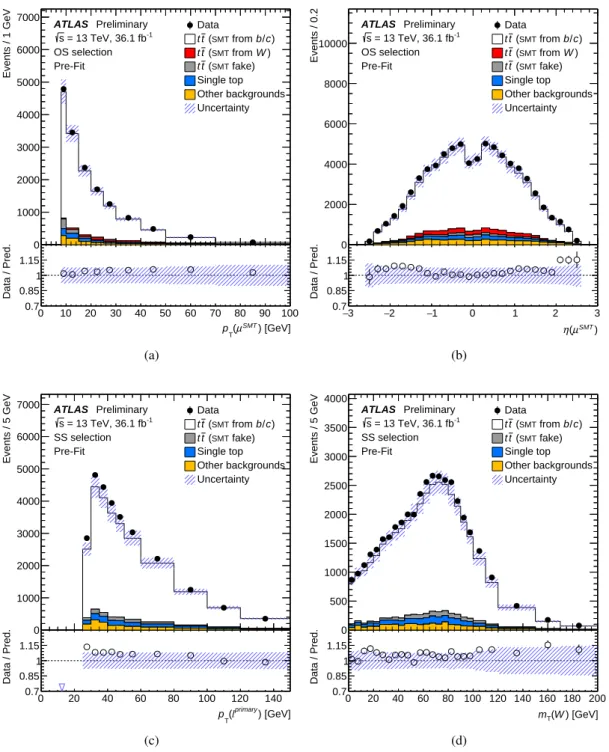
The number of observed candidate events and the predicted signal and background is shown in Table 3, for both the OS and SS regions. The sample consists of about 90% top quark pairs, which includes cases where the soft muon is erroneously chosen from a t t ¯ dilepton decay, whereby a muon from the prompt W decay is found near a jet or radiates a near-collinear photon mimicking a soft muon tag, and cases where the soft muon does not originate from a b decay. The contributions from single top quark, W - or Z -boson in association with jets, and from multijet background are visible. The Z +jets background gives a small contribution near the peak of the m `µ distribution, but becomes important for m `µ close to the Z -boson mass peak.
Of the selected t¯ t events in the OS class, in 83% of the cases the primary lepton and the soft muon belong to the decay of the same top quark, while in 10% of the events the two originate from different top quarks.
Much of the purity obtained in this sample is due to the topological requirement ∆R `,µ < 2, which is very
effective in selecting preferentially the same-top decays. For the remaining cases, 7%, the soft muon does
not originate from any of the two nominal b -quarks from the top pair decay. In the SS class, the above
0 10 20 30 40 50 60 70 80 90 100 ) [GeV]
µ
SMT T( p 0.7
0.85 1 1.15
Data / Pred.
0 1000 2000 3000 4000 5000 6000 7000
Events / 1 GeV
ATLAS Preliminary = 13 TeV, 36.1 fb
-1s OS selection Pre-Fit
Data
) c / b from ( SMT t t
) W from ( SMT t t
fake) ( SMT t t Single top Other backgrounds Uncertainty
(a)
− 3 − 2 − 1 0 1 2 3
SMT
) µ η ( 0.7
0.85 1 1.15
Data / Pred.
0 2000 4000 6000 8000 10000
Events / 0.2
ATLAS Preliminary = 13 TeV, 36.1 fb
-1s OS selection Pre-Fit
Data
) c / b from ( SMT t t
) W from ( SMT t t
fake) ( SMT t t Single top Other backgrounds Uncertainty
(b)
0 20 40 60 80 100 120 140
) [GeV]
primary
( l p
T0.7 0.85 1 1.15
Data / Pred.
0 1000 2000 3000 4000 5000 6000 7000
Events / 5 GeV
ATLAS Preliminary = 13 TeV, 36.1 fb
-1s SS selection Pre-Fit
Data
) c / b from ( SMT t t
fake) ( SMT t t Single top Other backgrounds Uncertainty
(c)
0 20 40 60 80 100 120 140 160 180 200
) [GeV]
W
T
( m 0.7
0.85 1 1.15
Data / Pred.
0 500 1000 1500 2000 2500 3000 3500 4000
Events / 5 GeV
ATLAS Preliminary = 13 TeV, 36.1 fb
-1s SS selection Pre-Fit
Data
) c / b from ( SMT t t
fake) ( SMT t t Single top Other backgrounds Uncertainty
(d)
Figure 1: Comparison of data and prediction in the OS (top) and SS (bottom) samples, for the soft muon p T (a), soft muon η (b), primary lepton p T (c) and the W boson transverse mass (d). The prediction reports the expected event contribution for the signal and backgrounds. The uncertainty band includes statistical and systematic uncertainties.
The same-sign (SS) or opposite-sign (OS) refers to the charge signs of the primary lepton and the soft muon.
fractions are 57%, 41% and 2%, respectively. The higher rate of non- b originated soft muons in OS events
is due to the charm from the W → cs in the top-quark decay chain.
Table 3: Events yields with m `µ between 15 and 80 GeV, separately for OS and SS regions. Uncertainties shown include statistical and systematic contributions.
Process Yield (OS) Yield (SS)
t t ¯ (SMT from b - or c -hadron) 56 000 ± 4000 34 800 ± 2800
t t ¯ (SMT from W → µν ) 2190 ± 320 4.9 ± 3.6
t t ¯ (SMT fake) 1490 ± 210 1240 ± 170
Single top t -chan 770 ± 70 490 ± 40
Single top s -chan 63 ± 6 49 ± 4
Single top Wt 1840 ± 140 1260 ± 100
W +jets 1600 ± 400 1080 ± 240
Z +light jets 210 ± 80 15 ± 6
Z +HF jets 550 ± 170 310 ± 100
Diboson 17.2 ± 2.9 6.3 ± 1.4
Multi-jet 530 ± 140 480 ± 130
Total Expected 65 000 ± 5000 39 800 ± 3000
Data 66 891 42 087
To understand the nature of the sample composition in the OS and SS regions, the expected t¯ t events can be further split into components involving direct and sequential decays, and decays not belonging to the b from the t → W b path, as shown in Table 4.
Table 4: Fraction of MC-simulated t t ¯ events split into components of direct and sequential decays, and decays not belonging to the b from the t → W b path, separately for the opposite-sign and same-sign event selections. The capital letters B and D indicate b and c hadrons of either charge. Only MC events with two reals muons are included.
OS [%] SS [%]
Processes involving a µ from a t or ¯ t
t → B → µ 73.6 51.2
t → B → D → µ 16.7 44.2
t → B → τ → µ 2.0 1.3
t → B → D → τ → µ 0.8 0.8
Processes involving a µ not from a t or ¯ t
B → µ 0.6 0.9
D → µ 5.8 1.4
τ → µ 0.5 0.1
The data are compared to the sum of the predicted signal and backgrounds in Figure 1, for an illustrative
selection of kinematic distributions of the candidate events: the p T (µ SMT ) , η( µ SMT ) for the OS selection
and p T (` primary ) , m T (W ) for the SS selection. The consistency of the data and MC predictions has been
studied using a χ 2 test involving the full correlation matrix, and for all distributions the agreement is at the
level of 2 standard deviations or better.
20 30 40 50 60 70 80 0.02
0.04 0.06 0.08 0.1 0.12 0.14 0.16 0.18
Fraction of events
= 170.5 GeV m
t= 172.5 GeV m
t= 174.5 GeV m
tATLAS Simulation Preliminary = 13 TeV
s OS selection
20 30 40 50 60 70 80
[GeV]
µ
m
l0.94 0.96 0.98 1 1.02 1.04 1.06
= 172.5 GeV
tm Ratio to
(a)
20 30 40 50 60 70 80
0.02 0.04 0.06 0.08 0.1 0.12 0.14 0.16 0.18 0.2
Fraction of events
= 170.5 GeV m
t= 172.5 GeV m
t= 174.5 GeV m
tATLAS Simulation Preliminary = 13 TeV
s SS selection
20 30 40 50 60 70 80
[GeV]
µ
m
l0.94 0.96 0.98 1 1.02 1.04 1.06
= 172.5 GeV
tm Ratio to
(b)
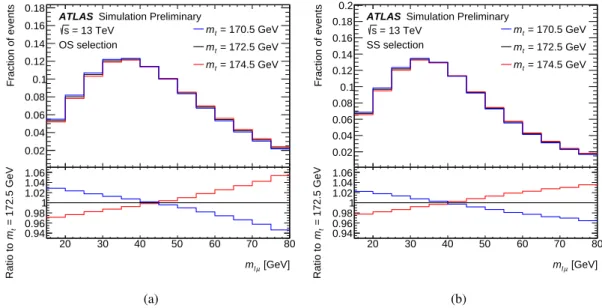
Figure 2: Sensitivity of the m `µ distribution to different input top quark mass from simulated events, separately for the OS and SS samples.
4.2 Extraction of the top quark mass
The distribution of the invariant mass between the primary lepton and the soft muon, m `µ is used to determine the mass of the parent top quark. A binned-template profile likelihood fit is performed, with a Poisson likelihood model and systematic uncertainties included as Gaussian-constrained nuisance parameters. Only the range of m `µ between 15 and 80 GeV is considered in the fit, since the tail of the m `µ distribution is more sensitive to t t ¯ modelling uncertainties and higher order corrections, and to the Z +jets background. The fit is performed simultaneously for the OS and SS charge-combination samples, and Figure 2 shows the sensitivity of each of these distributions to variations of the top quark mass, as well as the binning used by the templates.
The fit uses template histograms simulated as the nominal t t ¯ sample but with different values for the input top quark mass. Samples were generated with 12 different top quark mass values, ranging between 165.0 GeV and 180.0 GeV in variable mass-value steps of up to 0.5 around 172.5 GeV. The templates from the different mass samples are interpolated with piece-wise linear functions built bin-by-bin. To improve the stability of the method, the templates are smoothed assuming a linear dependence of the fraction of total events in each bin on m t . A maximum likelihood fit is performed with three free parameters: m t , which controls the shape of the m `µ distribution for t t ¯ events, and the normalisation factors for t t ¯ events in the OS and SS samples. The uncertainty due to the limited number of simulated events, and due to statistical fluctuations in the background estimates based on control samples, is evaluated by defining a new source of systematic uncertainty for each bin of the prediction, which modifies the bin content by its statistical uncertainty. A pruning procedure is applied to reduce the number of insignificant systematic uncertainties affecting the prediction of each of the signal and background processes, but does not affect significantly the estimated uncertainties.
The top quark mass determination from the fit is found to be linear and unbiased with respect to the input
top quark mass hypothesis by means of pseudo experiments, and its uncertainty from the likelihood ratio is
20 30 40 50 60 70 80 [GeV]
µ
m
l0.9 0.95 1 1.05
Data / Pred.
0 2000 4000 6000 8000 10000 12000 14000
Events / 5 GeV
ATLAS Preliminary = 13 TeV, 36.1 fb
-1s OS selection Post-Fit
Data
) c / b from ( SMT t t
) W from ( SMT t t
fake) ( SMT t t Single top Other backgrounds Uncertainty
(a)
20 30 40 50 60 70 80
[GeV]
µ
m
l0.9 0.95 1 1.05
Data / Pred.
0 2000 4000 6000 8000 10000
Events / 5 GeV
ATLAS Preliminary = 13 TeV, 36.1 fb
-1s SS selection Post-Fit
Data
) c / b from ( SMT t t
fake) ( SMT t t Single top Other backgrounds Uncertainty
(b)
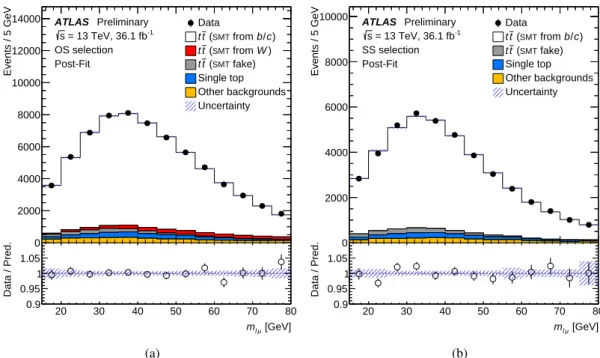
Figure 3: Post-fit m `µ distributions in the OS sample (a) and in the SS sample (b). The prediction reports the event contribution for the signal and backgrounds. The uncertainty band includes statistical and systematic uncertainties.
The same-sign (SS) or opposite-sign (OS) refers to the charge signs of the primary lepton and the soft muon
also checked to ensure it reports the correct statistical coverage. The fit method and the event selection were optimised to minimise the total uncertainty on m t in a “blinded” approach, that is using pseudo-data and data without knowledge of the best-fit top quark mass. The fit gives:
m t = 174 . 48 ± 0 . 40 ( stat ) ± 0 . 67 ( syst ) GeV , (2) corresponding to a total uncertainty of ± 0.78 GeV. Figure 3 shows the post-fit m `µ distributions in the OS and SS samples. The pulls and constraints of the nuisance parameters in the combined fit to data are shown in Figure 4 (a), and the likelihood scan with the best-fit top quark mass value in Figure 4 (b). The systematic uncertainties are discussed in Section 4.3.
A goodness-of-fit test is performed using the saturated model technique [83] and returns a probability of
56%. Checks were performed by fitting separately the OS and SS regions, the electron and muon channels,
different W lepton charge and different configurations of b -tagging and event selection, and were found
to give consistent results. Checks included also the extraction of the top quark mass with alternative
statistical methods, namely using analytic functions for m `µ with a parametric dependence on the top
quark mass, only using the mean value of the m `µ distribution, and using a binned-template likelihood fit
without including systematic uncertainties as nuisance parameters. In particular the inclusion of systematic
uncertainties as nuisance parameters in the fit reduces the total uncertainty by 4.9%, in line with reasonable
constraints from the fit.
− 2 − 1.5 − 1 − 0.5 0 0.5 1 1.5 2 θ
∆
0
)/
θ θ - (
Electron energy scale) B -prod. frac. ( b
JER -prod. frac. (baryons) b
topology ρ JES pileup Muon identification SF (syst.)
soft track scale
miss
ET
0) b -tag ( b
FSR t t JES Effective NP Modelling 1
) W from ISR (SMT t t
soft track resolution (para.)
miss
ET
) c / b from ISR (SMT t t
→µ
→c b BR SMT-fake norm.
+jets norm. (HF) Z
b) r -fragmentation ( b
t t
→µ b BR Pileup reweighting
µ
→ c
→c b BR
− 0.3 − 0.2 − 0.1 0 0.1 0.2 0.3 [GeV]
m
t∆
t:
m Pre-fit impact on
θ
∆ θ +
θ = θ = θ - ∆ θ
t