A TLAS-CONF-2013-102 18 September 2013
TOPLHC NOTE
ATLAS-CONF-2013-102 CMS PAS TOP-13-005
September 15, 2013
Combination of ATLAS and CMS results on the mass of the top-quark using up to 4.9 fb − 1 of √
s = 7 TeV LHC data
The ATLAS and CMS Collaborations
Abstract
A combination of top-quark mass measurements performed by the ATLAS and CMS ex- periments at the LHC is presented. The datasets used correspond to an integrated luminosity per experiment of up to 4.9 fb
−1of proton-proton collisions at a centre-of-mass energy of 7 TeV. The combination includes measurements in the t¯ t → lepton + jets, t¯ t → di-lepton and t¯ t → all jets channels. The resulting combined LHC measurement of the top-quark mass is m
top= 173.29 ± 0.23 (stat) ± 0.92 (syst) GeV, with a total uncertainty of 0.95 GeV.
c
Copyright 2013 CERN for the benefit of the ATLAS Collaboration.
Reproduction of this article or parts of it is allowed as specified in the CC-BY-3.0 license.
1 Introduction
The top-quark mass (m
top) is an important parameter of the Standard Model of particle physics (SM).
Precise m
topmeasurements are critical inputs to global electroweak fits [1], provide constraints on the properties of the Higgs boson, and help in assessing the internal consistency of the SM and of its exten- sions.
At the Tevatron a large number of measurements of m
tophave been performed by CDF and D ∅ based on Run I and Run II data for integrated luminosities (L
int) of up to 8.7 fb
−1. To increase the precision on the experimental knowledge of this parameter, a combination of the individual results has been per- formed. The present Tevatron m
topcombination yields m
top= 173.20 ± 0.51 (stat) ± 0.71 (syst) GeV = 173.20 ± 0.87 GeV [2].
Recently, measurements of m
topfrom the LHC experiments have become available. The first LHC m
topcombination used data from both the 2010 and 2011 proton-proton LHC runs at a centre-of-mass energy of √
s = 7 TeV, and resulted in m
top= 173.3 ± 0.5 (stat) ± 1.3 (syst) GeV = 173.3 ± 1.4 GeV [3].
This note describes an updated LHC m
topcombination using preliminary and published LHC top- quark mass measurements. Five measurements of m
topare used, all based on the LHC √
s = 7 TeV proton-proton data recorded in 2011. For ATLAS these are comprised of m
topresults obtained in the t¯ t → lepton + jets and the t¯ t → di-lepton channels using L
int= 4.7 fb
−1of data [4, 5]. For CMS, m
topmeasurements from datasets including up to L
int= 4.9 fb
−1, in the t¯ t → lepton + jets, t¯ t → di-lepton and t¯ t → all jets channels are used [6–8]. Alternative analysis techniques [9, 10] have recently become available but are not included in the present result.
This document is organised as follows: after a short description of the methodology used for the combination in Section 2, a brief overview of the input measurements is given in Section 3. Details of the mapping between ATLAS and CMS uncertainty classes, and their corresponding correlations are described in Section 4. The results of the m
topcombination are presented in Section 5, followed, in Section 6, by a discussion of their dependence on the choice of the uncertainty categorisation and on the assumed correlations. Finally, the summary and conclusions are given in Section 7.
2 Methodology
The combination is performed using the Best Linear Unbiased Estimate (BLUE) method [11,12]. BLUE optimises the coe ffi cients to be used in a linear combination of the input measurements by minimising the total uncertainty of the combined result. In the algorithm, both statistical and systematic uncertainties, as well as the correlations of systematic sources between input measurements, are taken into account, under the hypothesis that all uncertainties are distributed as Gaussians. A realistic evaluation of the correlations is performed and the impact of the various assumptions on the final result is carefully evaluated.
3 Input measurements
The input measurements used for this m
topcombination correspond to two preliminary ATLAS results in the t¯ t → lepton+jets and t¯ t → di-lepton channels [4, 5], and three published results from the CMS collaboration in the t¯ t → lepton + jets, t¯ t → di-lepton, and t¯ t → all jets channels [6–8].
3.1 ATLAS measurements
The input m
topmeasurements from ATLAS are obtained with various implementations of the template
method. Simulated distributions (templates) are constructed for a chosen quantity sensitive to the physics
parameter under study, using a number of discrete values of that parameter. The templates are fitted to
analytical functions that interpolate between different input values of the physics parameter, which are used in a maximum likelihood fit to the observed data distribution.
In the t¯ t → lepton+jets analysis, the event reconstruction is performed using a kinematical fit to the t¯ t decay hypothesis. A three-dimensional template method is used, where m
topis determined si- multaneously with a global jet energy scale factor (JSF) exploiting the invariant mass distributions of the hadronically decaying W boson (t → Wb; W → j j), and a global b-to-light quark energy scale factor (bJSF). The JSF (bJSF) accounts for possible data-to-simulation differences of the light quark jet energy scale (relative b-to-light quark jet energy scale), mitigating the corresponding systematic uncer- tainties [4]. No prior knowledge of the uncertainty related to the light- and b-quark jet energy scales is used when determining the JSF and the bJSF.
The t¯ t → di-lepton analysis is based on a one-dimensional template method, where templates are constructed for the m
lbobservable, defined as the per event average invariant mass of the charged lepton and the b-quark associated to the top-quarks decay [5].
3.2 CMS measurements
The CMS input measurements in the t¯ t → lepton + jets [6] and t¯ t → all jets [8] channels are based on the ideogram method, and employ a kinematic fit of the decay products to a t¯ t hypothesis. Likelihood functions for each event (ideograms) that depend on the top-quark mass only or on both the top-quark mass and a JSF are exploited. The ideograms reflect the compatibility of the kinematics of the event with a given decay hypothesis. For the t¯ t → lepton + jets analysis m
topis derived simultaneously with a JSF from t → Wb (W → j j) decays (two-dimensional ideogram method); whereas for the t¯ t → all jets analysis only m
topis obtained from a fit to the data (one-dimensional ideogram method). Similarly to the ATLAS t¯ t → lepton + jets analysis, no prior knowledge of the jet energy scale uncertainty is used for the determination of the JSF.
For the CMS t¯ t → di-lepton analysis, the top-quark mass is obtained from an analytical matrix weighting technique, where the full reconstruction of the event kinematics is done under di ff erent m
topassumptions. For each event, the preferred top-quark mass hypothesis, fulfilling t¯ t kinematical con- straints, is obtained by assigning weights, that are based on charged lepton energy probability density functions taken from simulation, to the di ff erent solutions of the kinematical equations [7].
3.3 Measurements calibration
In all measurements considered in the present combination, the fitting procedures are calibrated to the Monte Carlo (MC) top-quark mass definition. The baseline MC program for the simulation and calibra- tion of the top-quark mass analyses in ATLAS is PowHeg interfaced with Pythia for the parton shower and underlying event modelling [13–15]; MadGraph interfaced with Pythia is used within CMS [14, 16].
The parton configurations generated by MadGraph are matched with the parton showers using the MLM prescriptions [17]. It is expected that the di ff erence between the MC mass definition and the top-quark pole mass is of order 1 GeV [18]. A systematic uncertainty, ranging from 0.02 GeV to 0.20 GeV, depend- ing on the analysis, is assigned to the input measurements, covering differences between MC models.
4 Mapping of uncertainty categories
In this section, the mapping of ATLAS and CMS m
topuncertainty categories and their assumed corre-
lations are described. The categorisations outlined in Ref. [3] have been refined and improved using
multiple Jet Energy Scale (JES) uncertainty components [19–22]. This allows a better treatment of the
correlation assumptions between measurements within the same experiment and of those components
that are correlated across experiments. In the following, ρ
expindicates the assumed correlation between measurements from the same experiment, while ρ
LHCrefers to the assumed correlation between mea- surements across experiments.
When comparing individual m
topinput measurements, the quoted systematic uncertainty stemming from corresponding model, detector, or physics e ff ects, could di ff er for many reasons. Analysis specific details, for example the amount of information exploited for the determination of the event kinematics, and the level of sophistication inherent to the t¯ t reconstruction algorithms, can influence the sensitivity of the input measurements to specific signal modelling systematic uncertainties. Similarly, di ff erences in the analysis fitting procedures, for example the possibility to simultaneously determine global jet energy scale factors and m
top, can result in a mitigation of the JES related systematic uncertainties.
This can yield, in addition, a reduction of some signal modelling systematics, but can also be possibly accompanied by an increase of some detector related uncertainties. Finally, the detector performance can differ due to the experimental specifications: for example a more pronounced dependence of the JES uncertainty on the jet p
Tcan result in a larger JES component of the m
topuncertainty, even for analyses implementing in-situ t → Wb, W → j j calibration techniques.
For all input measurements, systematic uncertainties are evaluated by varying the respective quan- tities by ±1 standard deviation, or by changing the signal model parameters with respect to the default analysis. For each uncertainty component, the observed m
topshift with respect to the nominal analysis is used to determine the corresponding top-quark mass uncertainty. For each input m
topmeasurement, the total uncertainty is calculated as the quadratic sum of all individual contributions, i.e. neglecting possible correlations between di ff erent uncertainty classes and non-linearities in the e ff ect on the measured value of m
top.
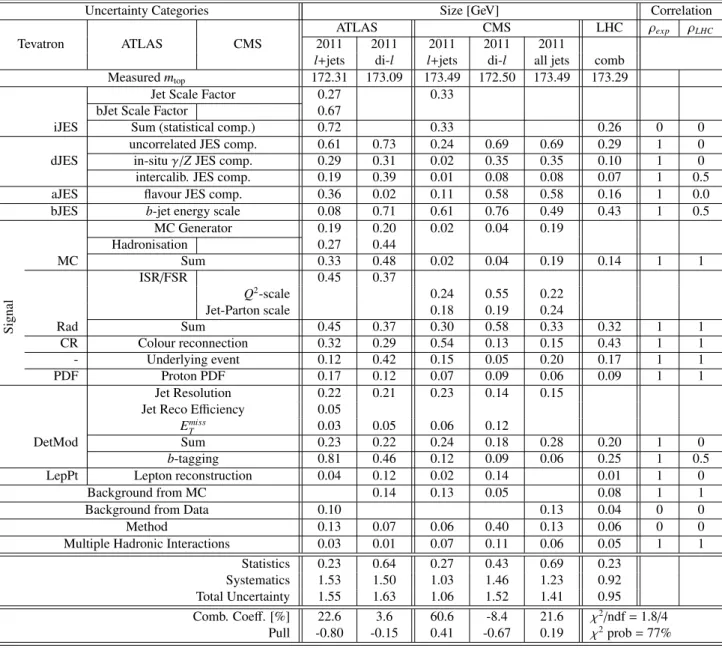
For the present m
topcombination, the uncertainty classes and their assumed correlations are sum- marised in Table 1, and detailed below. The stability of the result under di ff erent assumptions is discussed in Section 6.
iJES: This is the part of the JES uncertainty of the m
topmeasurements which originates from in-situ t¯ t (t → Wb, W → j j) calibration procedures and, being statistical in nature, is uncorrelated among the to-be-combined measurements. For analyses performing an in-situ jet calibration based on the simultaneous fit of the reconstructed W boson and top-quark invariant masses, this corresponds to the additional statistical uncertainty associated with the simultaneous determination of a JSF using the W → j j invariant mass and m
top[4, 6]. For the ATLAS t¯ t → lepton+jets measurement [4], it also includes the extra statistical component due to the simultaneous determination of a bJSF. The correlation assumptions for this category are ρ
exp= ρ
LHC= 0.
uncorrJES: This is the JES uncertainty component which is uncorrelated between experiments (ρ
LHC= 0). For ATLAS it includes contributions from the limited data sample statistics used to derive the standard jet energy calibrations. In addition, uncertainty contributions from detector-specific components, pile-up suppression techniques, and the presence of close-by jet activity are included in this source (see also Appendix A for a description of the ATLAS uncertainty sub-components). For CMS, this uncertainty source includes the statistical uncertainty of the default jet energy calibration, contributions stemming from the jet energy correction due to pile-up effects, uncertainties due to the variations of the calorimeter response versus time, and finally detector specific e ff ects. This uncertainty category is fully correlated between measurements from the same experiment (ρ
exp= 1).
in-situγ/ZJES: This corresponds to the part of the JES uncertainty stemming from modelling uncertainties affect- ing the absolute JES determination using γ/Z + jets events, not included in the previous category.
This uncertainty class is fully correlated between measurements from the same experiments, and
Uncertainty Categories Size [GeV] Correlation
Tevatron ATLAS CMS
ATLAS CMS LHC
ρexp ρLHC2011 2011 2011 2011 2011
l+jets
di-l
l+jetsdi-l all jets comb
Measured
mtop172.31 173.09 173.49 172.50 173.49 173.29
Jet Scale Factor 0.27 0.33
bJet Scale Factor 0.67
iJES Sum (statistical comp.) 0.72 0.33 0.26 0 0
uncorrelated JES comp. 0.61 0.73 0.24 0.69 0.69 0.29 1 0
dJES in-situ
γ/ZJES comp. 0.29 0.31 0.02 0.35 0.35 0.10 1 0
intercalib. JES comp. 0.19 0.39 0.01 0.08 0.08 0.07 1 0.5
aJES flavour JES comp. 0.36 0.02 0.11 0.58 0.58 0.16 1 0.0
bJES
b-jet energy scale0.08 0.71 0.61 0.76 0.49 0.43 1 0.5
MC Generator 0.19 0.20 0.02 0.04 0.19
Signal
Hadronisation 0.27 0.44
MC Sum 0.33 0.48 0.02 0.04 0.19 0.14 1 1
ISR
/FSR 0.45 0.37
Q2
-scale 0.24 0.55 0.22
Jet-Parton scale 0.18 0.19 0.24
Rad Sum 0.45 0.37 0.30 0.58 0.33 0.32 1 1
CR Colour reconnection 0.32 0.29 0.54 0.13 0.15 0.43 1 1
- Underlying event 0.12 0.42 0.15 0.05 0.20 0.17 1 1
PDF Proton PDF 0.17 0.12 0.07 0.09 0.06 0.09 1 1
Jet Resolution 0.22 0.21 0.23 0.14 0.15
Jet Reco E
fficiency 0.05
EmissT
0.03 0.05 0.06 0.12
DetMod Sum 0.23 0.22 0.24 0.18 0.28 0.20 1 0
b-tagging
0.81 0.46 0.12 0.09 0.06 0.25 1 0.5
LepPt Lepton reconstruction 0.04 0.12 0.02 0.14 0.01 1 0
Background from MC 0.14 0.13 0.05 0.08 1 1
Background from Data 0.10 0.13 0.04 0 0
Method 0.13 0.07 0.06 0.40 0.13 0.06 0 0
Multiple Hadronic Interactions 0.03 0.01 0.07 0.11 0.06 0.05 1 1
Statistics 0.23 0.64 0.27 0.43 0.69 0.23
Systematics 1.53 1.50 1.03 1.46 1.23 0.92
Total Uncertainty 1.55 1.63 1.06 1.52 1.41 0.95 Comb. Coeff. [%] 22.6 3.6 60.6 -8.4 21.6
χ2/ndf=1.8/4
Pull -0.80 -0.15 0.41 -0.67 0.19
χ2prob
=77%
Table 1: Uncertainty categories mapping for the input measurements and the result of the LHC m
topcombination. For comparison, the categorisation used in the Tevatron 2013 combination [2] is reported in the first column. The correlation ρ
exprepresents the assumed correlation between measurements from the same experiment, while ρ
LHCindicates the correlation assumed between measurements across exper- iments. The values of ρ
expand ρ
LHCare reported for the categorisation actually used in the combination, and are omitted for those sub-categories which are grouped into a single uncertainty component. The stability of the result under di ff erent correlation assumptions is discussed in Section 6.
it is assumed to be uncorrelated between ATLAS and CMS measurements: ρ
exp= 1; ρ
LHC= 0.
Since the methodologies and assumptions to derive corrections and uncertainties are not always directly comparable between the two experiments, variations of ρ
LHCare considered in the com- bination stability checks.
intercalibJES: This is the JES uncertainty component originating from the modelling of the radiation in the rel-
ative jet η (central-forward) and p
Tinter-calibration procedures. Within CMS, when evaluating
this uncertainty contribution, an extrapolation to zero radiation is performed, and sizable statistical contributions are present. As a result, the combination is carried out with ρ
exp= 1; ρ
LHC= 0.5, and variations of these assumptions are monitored by performing stability checks.
flavourJES: This includes the part of the JES uncertainty stemming from differences in the jet energy response for various jet flavours (quark- versus gluon-originated jets) and flavour mixture, with respect to those used in the calibration procedures. Contributions stemming from the modelling of b-quark jets are treated separately and included in the following uncertainty category. The m
topcombined result is obtained with ρ
exp= 1; ρ
LHC= 0, and as in the previous cases, variations of ρ
LHCare analysed.
bJES: This accounts for an additional b-jet specific uncertainty, arising from the uncertainty in the mod- elling of the response of jets originating from b-quarks [20, 21]. In ATLAS, this uncertainty cov- ers the effects stemming from b-quark fragmentation, hadronisation and underlying soft radiation and it is determined using di ff erent Monte Carlo event generation models [20]. For the ATLAS t¯ t → lepton + jets input measurement [4], due to the simultaneous fit of the m
toptogether with a JSF and a bJSF, the impact of this uncertainty is reduced to 0.08 GeV, albeit at the cost of an additional statistical component in the iJES class, which, with the present integrated luminosity, amounts to 0.67 GeV. For CMS the bJES is defined as the full “flavour-dependent” uncertainty on the difference in the response between light-quark and gluon originated jets. This uncertainty class is assumed to be fully correlated between measurements from the same experiments, and partially correlated across experiments (ρ
LHC= 0.5) because of the di ff erent methods used to evaluate it (see also Section 6). Stability checks are performed changing the value of ρ
LHCto unity.
In the current LHC combination, the component of the systematic uncertainty stemming from the mod- elling of signal events is divided into several sub-categories, assumed to be fully correlated between measurements from the same experiments (ρ
exp= 1), and across experiments (ρ
LHC= 1):
MC: (Monte Carlo) This sub-category includes uncertainties stemming from the choice of the Monte Carlo generator. For ATLAS, the systematic uncertainty is calculated comparing m
topresults ob- tained with MC@NLO [23, 24] or PowHeg. For CMS, the baseline MadGraph MC setup does not include the simulation of the decay widths of the top-quarks and the W bosons. A system- atic uncertainty obtained comparing the m
topresults in MC samples generated with PowHeg or MadGraph is assigned to also cover this e ff ect. For ATLAS measurements, this uncertainty class includes a contribution due to the choice of the hadronisation model used in the simulation (see also Section 6).
Rad: (Radiation) This category includes uncertainties due to the modelling of QCD radiation in t¯ t events.
For the ATLAS measurements, variations of initial and final state radiation (ISR / FSR) parameters within Pythia, which are constrained by ATLAS data, are used to evaluate these m
topsystematic uncertainties. In CMS, where t¯ t events are generated using a multi-leg MC, samples with var- ied factorisation and renormalisation scale (Q
2-scale) and varied minimum p
Tused in the MLM matching procedure [17] (Jet-Parton scale), are used to address these systematic uncertainties. In- vestigations from Refs. [25,26] indicate that the two approaches describe to a large extent the same physics e ff ect.
CR: (Colour Reconnection) This is the part of the uncertainty related to the modelling of colour recon- nection effects. It is assessed by comparing simulated samples with the hadronisation based on the Pythia tunes Perugia 2011 and Perugia 2011 noCR [15].
UE: (Underlying Event) This category relates to uncertainties in the modelling of the underlying event
1.
1
It is not quoted as a separate category in the current Tevatron combination [2].
The uncertainty is obtained by comparing simulated samples in which the hadronisation is per- formed using Pythia with tunes Perugia 2011 and Perugia 2011 mpiHi [15].
PDF: (Parton Distribution Functions) This is the part of the modelling uncertainty related to the proton PDF. It is evaluated by re-weighting the simulated signal events according to the ratio of the default central PDF (CT10 and CTEQ6.6L for ATLAS and CMS, respectively) and the corresponding eigenvector variations [27, 28]. The uncertainty contribution corresponding to the re-weighting of the events to alternative PDF sets is found to be smaller than the above variation and not included.
DetMod: (Detector Modelling) This category relates to uncertainties in the modelling of detector e ff ects.
These include uncertainties in the jet energy resolution [21,29], the jet reconstruction e ffi ciency [19]
as well as uncertainties related to the missing transverse energy reconstruction, E
missT[30,31]. This uncertainty class is assumed to be fully correlated between measurements from the same experi- ments (ρ
exp= 1), but uncorrelated across experiments (ρ
LHC= 0).
b-tag: (b-tagging) This is the part of the uncertainty related to the modelling of the b-tagging e ffi ciency and the light-quark jet rejection factors in the MC simulation with respect to the data [32–35].
The m
topcombined result is obtained with ρ
exp= 1 and ρ
LHC= 0.5 for this systematic source
2, but variations of ρ
exp, and ρ
LHCare analysed in the stability checks (see Section 6 for further details). Despite the sizable reduction of the bJES related systematics that is achieved, the ATLAS t¯ t → lepton+jets analysis exhibits an increased sensitivity to the uncertainties of the b-tagging e ffi ciency and of the light jet rejection factors. This is related to the shape di ff erences introduced by the b-tagging scale factor variations in the variable sensitive to the bJSF [4].
LepPt: This category takes into account the uncertainties in the e ffi ciency of the trigger, in the identi- fication and reconstruction of electrons and muons, and residual uncertainties due to a possible miscalibration of the lepton energy and momentum scales [36–38]. The correlation assumptions for this uncertainty source are ρ
exp= 1, and ρ
LHC= 0.
BGMC: (Background from MC) This represents the uncertainty due to the modelling of the background normalisation and shape determined from MC. This uncertainty source is assumed to be fully correlated between all measurements (ρ
exp= ρ
LHC= 1).
BGData: (Background from Data) This class includes the uncertainties of the modelling of the background determined from data, and is assumed to be uncorrelated between all input measurements (ρ
exp= ρ
LHC= 0). Typically, these originate from uncertainties in the normalisation of the QCD multijet background.
Method: This systematic uncertainty relates to the fitting technique adopted for the m
topmeasurements (uncorrelated between all measurements: ρ
exp= ρ
LHC= 0). This includes uncertainties caused by the limited MC statistics available for the measurement calibration.
MHI: (Multiple Hadronic Interactions) This systematic uncertainty arises from the modelling of the pile- up conditions in the simulation with respect to the data (overlay of multiple hard proton-proton interactions). It is assumed to be fully correlated between all current input measurements (ρ
exp= ρ
LHC= 1).
2
Due to the large sensitivity of the ATLAS
tt¯
→lepton
+jets analysis to this uncertainty class,
ρLHC=0.5 has been adopted
for the default combination, as it is considered to be a more conservative assumption.
5 LHC combination
The methodology, and the information described above, result in the combined LHC m
topvalue of m
top= 173.29 ± 0.23 (stat) ± 0.92 (syst) GeV.
Alternatively, separating the iJES statistical contribution from the quoted systematic uncertainty, the result reads:
m
top= 173.29 ± 0.23 (stat) ± 0.26 (iJES) ± 0.88 (syst) GeV.
The χ
2of the combination is 1.8 for 4 degrees of freedom and the corresponding probability is 77%.
Its value can be used to assess the extent to which the individual measurements are consistent with the combined m
topvalue and with the hypothesis that they measure the same physics parameter. Moreover, for each input value of the top quark mass, m
i, the pull, defined as: pull
i= (m
i− m
top)/ q
σ
2mi− σ
2mtop, where σ
mtopis the total uncertainty of the combined m
topresult, indicates a good agreement between all input measurements.
Table 1 and Figure 1 summarise the inputs and the results of the combination. For each measurement, the coe ffi cient (BLUE combination coe ffi cient) used in the linear combination of the input m
topvalues to obtain the combined result, and the pull value are also provided. Within the BLUE method, negative coe ffi cients can occur when combining measurements with di ff erent precision and large correlations [11].
The negative BLUE combination coe ffi cient for the CMS t¯ t → di-lepton measurement has been studied by varying the assumptions on the correlations. As expected, if the correlations are artificially reduced all the combination coefficients can become positive.
In Figure 1(a), the combination result and the input measurements are compared with the current Tevatron m
topcombination [2]. The statistical uncertainty, the iJES contribution (when applicable) and the sum of the remaining uncertainties are reported separately. Figure 1(b) and Figure 1(c) report the BLUE combination coe ffi cients and the pulls of the input measurements with respect to the combined m
topresult.
Following the proposal and the BLUE software implementation documented in Ref. [39], the impact of the various input measurements is estimated using the Fisher information concept, I = 1/σ
2mtop. For each of the input measurements, intrinsic (IIW
i) and marginal information weights (MIW
i) are derived.
The intrinsic information weight carried by the i
th-measurement is complemented by the introduction of a weight inherent to the ensemble of all correlations between the input measurements (IIW
corr):
IIW
i= 1/σ
2i1/σ
2mtop= 1/σ
2iI ; IIW
corr= I − P
i
1/σ
2iI .
The IIW
ifor each individual measurement is defined as the ratio of the information it carries when taken alone (1/σ
2i) to the total information of the combination. While the IIW
iare defined to be positive, IIW
corrcan be negative, or positive, depending on whether the net effect of the correlations is to increase, or decrease, the total uncertainty of the combination. The marginal information weight defined as
MIW
i= I
n.meas− I
n−1 meas.: all butiI
n.meascan also be used to quantify the information that an individual measurement brings in a combination.
The MIW
iencodes the additional information available when the i
th-measurement is added to a com- bination that already includes n − 1 inputs. It quantifies the relative improvement in the total variance that is achieved by adding the measurement under consideration to the combination of all the others.
The intrinsic and marginal information weight, for each individual input measurement, and the intrinsic
[GeV]
mtop
166 168 170 172 174 176 178 180 182
1 10
Tevatron March 2013
173.20 ± 0.51 ± 0.36 ± 0.61
LHC September 2013
173.29 ± 0.23 ± 0.26 ± 0.88
= 3.5 fb-1 Lint
CMS 2011, all jets
1.23
± 0.69
± 173.49
= 4.9 fb-1 Lint
CMS 2011, di-lepton
1.46
± 0.43
± 172.50
= 4.9 fb-1 Lint
CMS 2011, l+jets
0.98
± 0.33
± 0.27
± 173.49
= 4.7 fb-1 Lint
ATLAS 2011, di-lepton
1.50
± 0.64
± 173.09
= 4.7 fb-1 Lint
ATLAS 2011, l+jets
1.35
± 0.72
± 0.23
± 172.31
- 4.9 fb-1
= 3.5 fb-1
combination - September 2013, Lint
LHC mtop
= 7 TeV s
ATLAS + CMS Preliminary,
(syst.) (iJES) (stat.)
(a)
BLUE Combination Coefficient [%]
-100 0 100
1 10
comb.
LHC mtop
September 2013 = 7 TeV s ATLAS + CMS Preliminary,
21.6
= 3.5 fb-1 Lint
CMS 2011, all jets
-8.4
= 4.9 fb-1 Lint
CMS 2011, di-lepton
60.6
= 4.9 fb-1 Lint
CMS 2011, l+jets
-1
3.6
= 4.7 fb Lint
ATLAS 2011, di-lepton
-1
22.6
= 4.7 fb Lint
ATLAS 2011, l+jets
(b)
Pull -5
1-4 -3 -2 -1 0 1 2 3
10
comb.
LHC mtop
September 2013
= 7 TeV s ATLAS + CMS Preliminary,
0.2
= 3.5 fb-1 Lint
CMS 2011, all jets
-0.7
= 4.9 fb-1 Lint
CMS 2011, di-lepton
0.4
= 4.9 fb-1 Lint
CMS 2011, l+jets
-1
-0.2
= 4.7 fb Lint
ATLAS 2011, di-lepton
-1
-0.8
= 4.7 fb Lint
ATLAS 2011, l+jets
(c)
Figure 1: (a): Input measurements and result of the LHC combination (see also Table 1), compared
with the Tevatron combined m
topvalue [2]; for each measurement, the statistical uncertainty, the iJES
contribution (when applicable) and the sum of the remaining uncertainties are reported separately. The
iJES contribution is statistical in nature and applies to analyses performing in-situ (t¯ t) jet energy cali-
bration procedures. The grey vertical band indicates the total Tevatron m
topuncertainty. (b, c) : BLUE
combination coefficients and pulls of the input measurements.
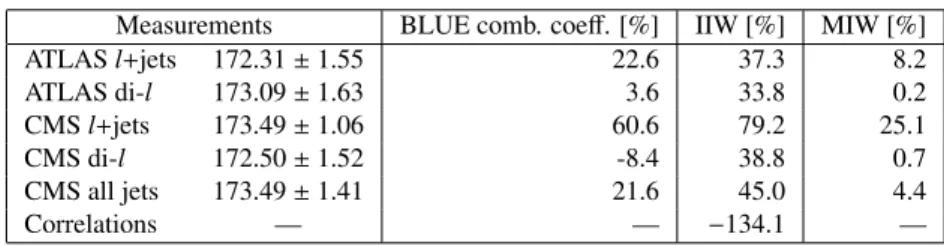
Measurements BLUE comb. coeff. [%] IIW [%] MIW [%]
ATLAS
l+jets172.31
±1.55 22.6 37.3 8.2
ATLAS di-l 173.09
±1.63 3.6 33.8 0.2
CMS
l+jets 173.49
±1.06 60.6 79.2 25.1
CMS di-l 172.50
±1.52 -8.4 38.8 0.7
CMS all jets 173.49
±1.41 21.6 45.0 4.4
Correlations — —
−134.1—
Table 2: Evaluation of the impact of the input measurements in the combination. The following values are listed for each measurement i: the BLUE combination coe ffi cient, the intrinsic information weight IIW
i, and the marginal information weight MIW
i. The intrinsic information weight IIW
corrof correlations is also shown on a separate row [39].
information weight of the correlations, are listed in Table 2. For comparison the corresponding BLUE combination coe ffi cients are also reported. The intrinsic information weight carried by the ensemble of the correlations among measurements is large in comparison to the contribution of the individual m
topinputs. It is therefore important to monitor the stability of the result under variations of the corresponding assumptions (see Section 6).
The total correlation matrix, M
ρ, of the ATLAS and CMS m
topmeasurements is reported below. The elements in the matrix are labelled according to the analysis they correspond to (rows and columns read as ATLAS or CMS followed by the t¯ t decay channel name).
A TLAS l + jets A TLAS di- l CMS l + jets CMS di- l CMS all jets
M
ρ=
1.00 0.63 1.00 0.26 0.35 1.00 0.18 0.25 0.64 1.00 0.16 0.24 0.55 0.75 1.00
ATLAS l + jets ATLAS di-l CMS l +jets CMS di-l CMS all jets
The precision of the combined result with respect to the most precise single measurement is improved by about 10%. The total uncertainty of the combination amounts to 0.95 GeV, and corresponds to a relative uncertainty on m
topof 0.5%. The resulting total uncertainty is dominated by the systematic contributions related to the modelling of signal events and the knowledge of the jet energy scale for light- and b-quark originated jets.
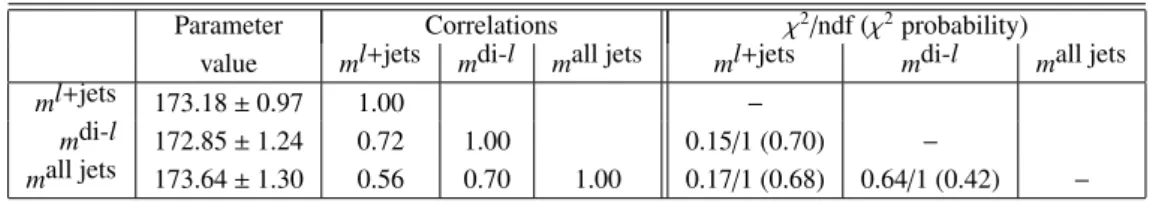
Using the same inputs, uncertainty categorisation, and correlation assumptions, the combination has been repeated to determine three correlated m
topvalues for the individual t¯ t decay channels (ml + jets, m di-l , mall jets). This is achieved within the BLUE program by simultaneously fitting three mass param- eters, one for each channel, instead of a common m
top. The consistency between the m
topdetermination in the various channels is measured using the following pair-wise χ
2formulation and its associated prob- ability: χ
2(m
1, m
2) = (m
1−m
2)
2/σ
212, where σ
212= σ
21+ σ
22−2ρ
12σ
1σ
2, and ρ
12is the correlation between the two measurements. The results are summarised in Table 3. Due to the correlations between the fitted parameters, the mall jets does not trivially coincide with the CMS t¯ t → all jets input measurement.
Similarly the combination has been repeated to obtain two correlated m
topvalues for the ATLAS and
CMS experiments (m
ATL, m
CMS). The latter results are compared to the individual combinations of the
Parameter Correlations
χ2/ndf (χ2probability) value
ml+jets mdi-l
mall jets
ml+jets mdi-l
mall jets
ml+
jets 173.18
±0.97 1.00
−m
di-l 172.85
±1.24 0.72 1.00 0.15
/1 (0.70)
−m
all jets 173.64
±1.30 0.56 0.70 1.00 0.17/1 (0.68) 0.64/1 (0.42)
−Table 3: Combination results in terms of three physical parameters corresponding to the individual t¯ t decay channels. The determination of the m
topper decay channel is reported together with the pair-wise correlation coe ffi cients, and the compatibility tests in terms of χ
2/ ndf and its associated probability.
Individual Parameter Correlations
χ2/ndf (χ2probability)
combinations value
mATL mCMS mATL mCMSmATL
172.65
±1.43 172.70
±1.43 1.00
−mCMS
173.59
±1.03 173.50
±1.02 0.33 1.00 0.21/1 (0.65)
−Table 4: Combination results in terms of two physical parameters corresponding to the m
topdetermina- tions from the individual experiments. The determination of the m
topper experiment is reported together with the pair-wise correlation coefficients, and the compatibility tests in terms of χ
2/ndf and its associ- ated probability. For comparison the results of the separate combinations of the individual ATLAS and CMS inputs from Table 1 are reported in the second column.
ATLAS and CMS inputs in Table 4. The full uncertainty breakdown of the separated ATLAS and CMS combinations is reported in Appendix B.
6 E ff ects of using alternative correlation models and uncertainty treat- ments
The categorisation and the correlation assumptions summarised in Table 1 reflect the present under- standing and the limitations due to the different choices made by the experiments when evaluating the individual uncertainty sources.
Despite the various improvements in the categorisation since the previous LHC combination, and the usage of a finer JES sub-component splitting, the final harmonisation of the methodologies and the uncertainty classes needs further dedicated studies by both experiments. In this preliminary result, the impact of the approximations is evaluated by performing stability cross checks, in which the input assumptions are changed with respect to the values reported in Table 1. The results of these cross checks are described in the following, and summarised in Figure 2.
6.1 Overall correlations
The stability of the combined m
topresult with respect to the correlation assumptions reported in Table 1,
has been checked by changing, simultaneously for all systematic sources, the values of ρ
expand ρ
LHCby
a multiplicative factor, f , in the range [0, 1]. The result of this stability check in terms of the shifts of the
combined m
topvalue ( ∆ m
top) and of its total uncertainty ( ∆ σ
mtop) are reported in Figure 2(a,b). For the
extreme case of no correlation ( f = 0) the result is ∆ m
top= −212 MeV and ∆ σ
mtop= −328 MeV. The
sensitivity of the combination to the assumed correlations between measurements from the same experi-
ments, or across experiments, has been evaluated using separate variations of ρ
expand ρ
LHC, respectively.
LHC
[%]
ρ and ρ
expMultiplicative factor, f, to
0 20 40 60 80 100
[MeV]
topm ∆
-350 -300 -250 -200 -150 -100 -50 0 50
combination, September 2013 LHC mtop
= 7 TeV s ATLAS + CMS Preliminary,
fixed ρexp LHC, ρ f*
fixed ρLHC exp, ρ f*
ρLHC exp, f*
ρ f*
(a)
LHC
[%]
ρ and ρ
expMultiplicative factor, f, to
0 20 40 60 80 100
) [MeV]
top(m σ ∆
-350 -300 -250 -200 -150 -100 -50 0 50
fixed ρexp LHC, ρ f*
fixed ρLHC exp, ρ f*
ρLHC exp, f*
ρ f*
combination, September 2013 LHC mtop
= 7 TeV s ATLAS + CMS Preliminary,
(b)
(insJES)= 50% LHCρ (intJES)=100% LHCρ (flavJES)= 50% LHCρ (flavJES)=100% LHCρ (bJES)=100% LHCρ (DetMod)= 50% LHCρ (btag)= 0% LHCρ (btag)=100% LHCρ (btag)= 50% ATLρ (MC,PDF)= 0% LHCρ add CMS hadr. remove ATL hadr. alternative CMS cat.
[MeV]
topm ∆
-200 -150 -100 -50 0 50 100 150 200
combination, September 2013 LHC mtop
= 7 TeV s ATLAS + CMS Preliminary,
(c)
(insJES)= 50% LHCρ (intJES)=100% LHCρ (flavJES)= 50% LHCρ (flavJES)=100% LHCρ (bJES)=100% LHCρ (DetMod)= 50% LHCρ (btag)= 0% LHCρ (btag)=100% LHCρ (btag)= 50% ATLρ (MC,PDF)= 0% LHCρ add CMS hadr. remove ATL hadr. alternative CMS cat.
) [MeV]
top(m σ ∆
-200 -150 -100 -50 0 50 100 150 200
combination, September 2013 LHC mtop
= 7 TeV s ATLAS + CMS Preliminary,
(d)
Figure 2: Variation of the combined m
topresult (a,c) and its total uncertainty (b,d) as a function of
variations in the correlation assumptions. (a,b) ρ
expand ρ
LHCare varied using a multiplicative factor f
in the range [0,1] (blue curve). Separate variations of ρ
expand ρ
LHC, in the same range, are reported by
the red and the orange curve, respectively. (c,d) Stability of the LHC combination under variations of the
default assumptions on ρ
LHCand ρ
expfor selected uncertainty sources. The sensitivity of the combination
to different scenarios concerning the treatment of the hadronisation systematics is also shown.
For the case in which ρ
LHC(ρ
exp) is varied while keeping ρ
exp(ρ
LHC) fixed, the maximum observed vari- ations are ∆ m
top= −26 MeV and ∆ σ
mtop= −110 MeV ( ∆ m
top= −145 MeV and ∆ σ
mtop= −212 MeV), signalling a larger sensitivity of the result to the intra-experiment correlations. The separate ρ
expand ρ
LHCvariations as a function of the value of the multiplicative factor f are reported by the red and the orange curve in Figure 2(a,b), respectively. Studies performed keeping fixed ρ
LHC= 0.5 instances, and varying ρ
LHC= 1 → 0 and ρ
exp= 1 → 0, provide similar results.
6.2 JES component correlations
The methodologies and assumptions used to derive the jet energy corrections and the related uncertainties are not always directly comparable between the ATLAS and CMS experiments. As a consequence, variations of the corresponding ρ
LHCassumptions, have been considered in the combination stability checks. These affected the in-situ γ/Z (ρ
LHC= 0.5), inter-calibration (ρ
LHC= 1.0), and flavour (ρ
LHC= 0.5, 1.0) components of the JES. The maximum deviations observed with respect to the default result are: ∆ m
top= 38 MeV and ∆ σ
mtop= 11 MeV.
A di ff erent strategy is also followed concerning the evaluation of the b-jet specific energy scale uncertainty. In ATLAS, the effects stemming from b-quark fragmentation, hadronisation and underlying soft radiation are studied using di ff erent MC event generation models [20]. On the other hand, in CMS, the Pythia and Herwig [40] fragmentation models are used to evaluate the response variation for di ff erent jet flavour mixtures. The inclusive jet flavour mixture and b-jet responses are both well modelled, while the largest di ff erences are found for pure quark and gluon flavours. The maximum of these di ff erences, for pure quark flavour at low p
Tand for pure gluon flavour at high p
T, is taken as a flavour uncertainty applicable to any jet flavour or flavour mixture [21]. To reflect these differences in the estimate of the b-JES uncertainty, ρ
LHC= 0.5 is used as the default assumption for this source of systematic uncertainty.
The changes of the combination when using ρ
LHC= 1 are studied as another stability test. The results of this are ∆ m
top≤ 25 MeV, ∆ σ
mtop≤ 5 MeV.
6.3 Signal modelling
6.3.1 ATLAS and CMS correlation
For the evaluation of the MC systematic uncertainty, di ff erent MC generators are used within the ATLAS and CMS collaborations. In addition a contribution to the uncertainty due to the choice of the hadroni- sation model used in the simulation is included for the ATLAS input measurements. Finally, different input PDF (CT10 and CTEQ6.6L for ATLAS and CMS, respectively) are used in the baseline MC by the two collaborations. These aspects may reduce the actual correlation between ATLAS and CMS mea- surements for these uncertainty classes. As a result, the combination has been repeated using ρ
LHC= 0 for both the MC and PDF uncertainty sources: the observed deviations with respect to the default result are ∆ m
top= 2 MeV, and ∆ σ
mtop= −7 MeV.
6.3.2 Hadronisation and alternative uncertainty categorisation
As mentioned above, in the signal modelling categorisation, additional uncertainties can arise from the choice of the hadronisation model (cluster or string fragmentation as implemented in Herwig and Pythia, respectively) describing the transition from final state partons to colourless hadrons. The change in m
topobtained by exchanging cluster and string models in a fixed MC setup can be quoted as hadronisation uncertainty for the m
topmeasurements. However, this source of uncertainty is typically also considered among the components of the jet energy scale uncertainty (both for inclusive- and b-quark jets) and siz- able double counting effects may result. For the time being, the experiments choose different approaches.
ATLAS quotes an explicit hadronisation systematic related to the t¯ t modelling in the MC. Within CMS,
to minimise double counting, no additional hadronisation systematic is quoted. Given the relatively large size of this uncertainty (Table 1), a harmonisation of the treatments of this systematics is needed. Specif- ically, an in-depth investigation of the level of the double counting effects involved when both types of components are used is important for the next generation of measurements and m
topcombinations.
These studies are currently in progress. To estimate the possible significance of these e ff ects, the LHC m
topcombination has been repeated for several different assumptions. From the comparison of PowHeg simulations with Pythia and Herwig used for the fragmentation stage, CMS has derived estimates of the hadronisation uncertainty of 0.58, 0.76 and 0.93 GeV for the l + jets, di-l, and all jets channels, re- spectively. Adding these into the MC systematic uncertainty, and repeating the combination, results in
∆ m
top= −100 MeV and ∆ σ
mtop= +139 MeV. The relatively large effect is introduced by an increased to- tal uncertainty for the CMS input measurements, and the resulting change of the combination coe ffi cients of the measurements in the combination. In this case and for the five input measurements, these read:
29.4%, 5.0%, 64.6%, -6.9%, 7.9%, where the values refer to the ATLAS l +jets and di-l measurements and the CMS l + jets, di-l, and all jets measurements respectively. Alternatively, if the extra hadronisation systematics evaluated by ATLAS in addition to the JES components, is removed, the observed changes are ∆ m
top= −2 MeV and ∆ σ
mtop= −6 MeV. In addition to the above investigations, CMS has studied an alternative systematic categorisation. While keeping the hadronisation uncertainties described above, the bJES uncertainty is evaluated at the analysis level using the uncertainties in the b-fragmentation function, and the b-semileptonic branching fractions. The uncertainty in the b-fragmentation is evaluated by vary- ing the Bowler-Lund parameters used to model the b-quark fragmentation in Pythia between the Pythia Z2 tune and the results of the Perugia P2011 [15] and Corcella [40] tunes. This results in an uncertainty of m
topof 0.15 GeV. An additional uncertainty of 0.10 GeV comes from varying the b-semileptonic branching fractions within their measured uncertainties. In this framework, the combined uncertainty of 0.18 GeV is taken as the bJES uncertainty for all CMS input measurements. The impact of changing to this characterisation of the hadronisation and bJES uncertainties for the CMS analyses is found to be
∆ m
top= −115 MeV and ∆ σ
mtop= + 52 MeV. Further work is needed to resolve this issue and detailed studies are ongoing.
Due to the sensitivity of the combined result to the treatment of hadronisation uncertainties, progress on these aspects will be of key importance for future analyses of increased precision, and for LHC m
topcombination updates.
6.4 Detector modelling correlations
The detector modelling systematics could include some level of correlation between experiments intro- duced by the use of MC simulation in the evaluation of the detector performances. For this reason, a test is performed varying the default ρ
LHCfrom 0% to 50%. The impact of this change is found to be
∆ m
top= 3 MeV and ∆ σ
mtop= 6 MeV.
In the evaluation of the b-tagging uncertainties a ff ecting the m
topmeasurements, data-to-MC scale factors (SF), to adjust the b-tagging performance in the simulation, are varied within their uncertainty.
These are derived as functions of the jet flavour and the jet properties. In ATLAS, the full p
T/η depen-
dency on the SF is taken into account. On the other hand, CMS top-quark mass analyses evaluate this
uncertainty by changing the b-tag selection criteria to mimic the b-tagging efficiency variations, but no
explicit p
T/η dependence is currently considered. Due to the large contribution to the total uncertainty
from this source, the ATLAS l + jets m
topresult used SF derived from a combination of the di ff erent cal-
ibrations obtained from a t¯ t → di-lepton sample (t¯ t-based) [33], and a sample of jets including muons
(muon-based) [34]. This allowed a reduction of the SF uncertainties as a function of the jet p
T. The
ATLAS t¯ t → di-lepton measurements used instead muon-based only b-tagging calibrations. For these
reasons, the default correlation assumptions ρ
exp= 1.0 and ρ
LHC= 0.5 have been varied in the stability
checks. In particular, combination tests have been performed with ρ
LHC= 0, 1.0, and ρ
AT L= 0.5,
the latter reducing the assumed correlation between ATLAS measurements. The maximum deviations observed with respect to the default results are: | ∆ m
top| = 12 MeV and | ∆ σ
mtop| = 8 MeV.
6.5 Minimisation of the Fisher information
As an additional cross check, the stability of the combination has been verified applying the recipes described in Ref. [39]. Numerical minimisation procedures aimed at reducing the Fisher information of the combination are applied, varying the correlation assumptions by multiplicative factors in three di ff erent scenarios. In the simplest case, all correlations are rescaled by the same global factor (minimise by global factor). As a second option, the same rescaling factor is applied to all correlations within each error source (minimise by error source). Finally, an alternative minimisation procedure is performed in which for all error sources the o ff -diagonal correlations (ρ
i j, i , j) are rescaled by the same factor (minimise by off-diagonal element). The results of these test are reported in Table 5 and confirm the robustness of the combinations against changes of the correlation assumptions.
Alternative cross checks, as proposed in Ref. [39] and adopted in Ref. [41], have been performed and yield consistent results with respect to the default combination.
Combination BLUE
Nominal correlations 173.29
±0.95 Minimise by global factor 173.29
±0.95 Minimise by error source 173.27
±0.95 Minimise by o
ff-diagonal element 173.21
±0.95
Table 5: Summary of the combinations performed with nominal and modified correlations applying the recipes described in Ref. [39].
7 Conclusion and outlook
A preliminary combination of the ATLAS and CMS top-quark mass measurements using data collected from proton-proton collisions at the centre-of-mass energy √
s =7 TeV during 2011, including up to 4.9 fb
−1of integrated luminosity has been presented. In total three published and two preliminary top- quark mass results are included in the combination.
While taking into account correlations between the measurements, the systematic uncertainties were classified following the categories used in the Tevatron 2013 top-quark mass combination. This will facilitate a future combination of LHC and Tevatron measurements.
The resulting combination, taking into account statistical and systematic uncertainties and their cor- relations, yields:
m
top= 173.29 ± 0.23 (stat) ± 0.92 (syst) GeV,
or separating the iJES statistical contribution from the quoted systematic uncertainty:
m
top= 173.29 ± 0.23 (stat) ± 0.26 (iJES) ± 0.88 (syst) GeV.
The LHC combination achieves an improvement of the total m
topuncertainty of about 10% with
respect to the most precise input measurement, and supersedes the one documented in [3]. The total
uncertainty of the combination amounts to 0.95 GeV, and is currently dominated by the systematic un-
certainties due to the jet calibration, and the signal modelling.
The dependence of the result on the correlation assumptions between measurements from the same experiment and across experiments has been studied, and found to be moderate with respect to the current m
topprecision.
Updated measurements based on the 2012 LHC proton proton run at √
s = 8 TeV are being per- formed. In general, larger datasets potentially allow selection of events in phase-space regions where the detector effects are better understood, and derivation of data-driven constraints on the allowed ranges for the signal modelling parameter variations used in the systematic effects determination. As a con- sequence, future measurements and combinations, profiting from reduced systematics uncertainties as well as from improved analysis techniques, are expected to substantially increase the precision on m
topcompared to the preliminary results presented here.
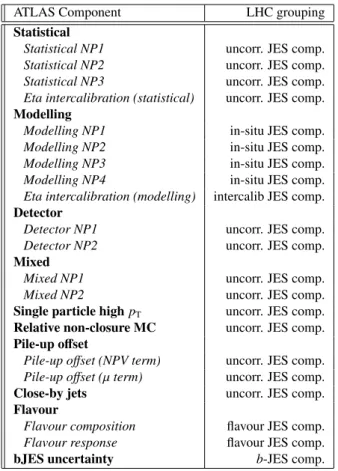
A Mapping of LHC and ATLAS jet energy scale categories
In this appendix the grouping of the original ATLAS JES uncertainty categories to those used in the present combination is described. The full JES uncertainty breakdown for the ATLAS input measure- ments is taken from [4, 5]. All sub-components are assumed to be uncorrelated. For further details see also Ref. [19].
ATLAS Component LHC grouping
Statistical
Statistical NP1
uncorr. JES comp.
Statistical NP2
uncorr. JES comp.
Statistical NP3
uncorr. JES comp.
Eta intercalibration (statistical)
uncorr. JES comp.
Modelling
Modelling NP1
in-situ JES comp.
Modelling NP2
in-situ JES comp.
Modelling NP3
in-situ JES comp.
Modelling NP4
in-situ JES comp.
Eta intercalibration (modelling)
intercalib JES comp.
Detector
Detector NP1
uncorr. JES comp.
Detector NP2
uncorr. JES comp.
Mixed
Mixed NP1
uncorr. JES comp.
Mixed NP2
uncorr. JES comp.
Single particle highpT
uncorr. JES comp.
Relative non-closure MC
uncorr. JES comp.
Pile-up offset
Pile-up offset (NPV term)
uncorr. JES comp.
Pile-up offset (µterm)
uncorr. JES comp.
Close-by jets
uncorr. JES comp.
Flavour
Flavour composition
flavour JES comp.
Flavour response
flavour JES comp.
bJES uncertainty b-JES comp.
Table 6: Grouping of the original ATLAS JES uncertainty categories to those used in the present combi-
nation.
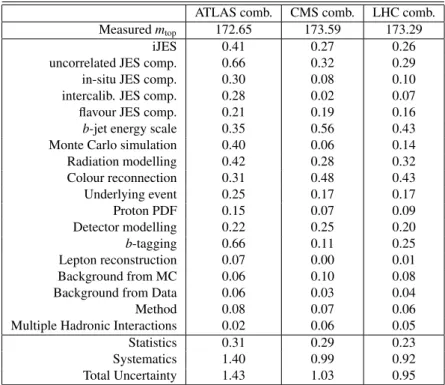
B Results of the individual ATLAS and CMS combinations
In this Appendix the separate ATLAS and CMS m
topcombinations using the same inputs, uncertainty categories, and correlation assumptions as for the LHC m
topcombination are reported.
ATLAS comb. CMS comb. LHC comb.
Measured
mtop172.65 173.59 173.29
iJES 0.41 0.27 0.26
uncorrelated JES comp. 0.66 0.32 0.29
in-situ JES comp. 0.30 0.08 0.10
intercalib. JES comp. 0.28 0.02 0.07
flavour JES comp. 0.21 0.19 0.16
b-jet energy scale
0.35 0.56 0.43
Monte Carlo simulation 0.40 0.06 0.14
Radiation modelling 0.42 0.28 0.32
Colour reconnection 0.31 0.48 0.43
Underlying event 0.25 0.17 0.17
Proton PDF 0.15 0.07 0.09
Detector modelling 0.22 0.25 0.20
b-tagging
![Figure 1: (a): Input measurements and result of the LHC combination (see also Table 1), compared with the Tevatron combined m top value [2]; for each measurement, the statistical uncertainty, the iJES contribution (when applicable) and the sum of the remai](https://thumb-eu.123doks.com/thumbv2/1library_info/4019368.1541662/9.892.193.709.114.925/measurements-combination-tevatron-measurement-statistical-uncertainty-contribution-applicable.webp)