ATLAS-CONF-2012-082 07July2012
ATLAS NOTE
ATLAS-CONF-2012-082
June 30, 2012
Top-quark mass measurement in the eµ channel using the m
T2variable at ATLAS
The ATLAS Collaboration
Abstract
A measurement of the top-quark mass using themT2 stransverse mass variable in the eµchannel in √s = 7 TeV ppcollision data taken in 2011 at the LHC is presented. The mT2 variable is useful in pair-production events with two undetected particles and repre- sents a lower bound on the parent particle’s mass. Applying this method to 4.7 fb−1 of ATLAS data, a measurement of the top-quark mass is made, resulting in mtop = 175.2± 1.6 (stat.)+3.1−2.8(syst.) GeV.
c Copyright 2012 CERN for the benefit of the ATLAS Collaboration.
Reproduction of this article or parts of it is allowed as specified in the CC-BY-3.0 license.
1 Introduction
The top-quark mass is a fundamental parameter of the Standard Model. The world average value is 173.18
±0.56 (stat.)
±0.75 (syst.) GeV as measured by the CDF and DØ collaborations at the Tevatron collider [1]. Top-quark mass measurements by ATLAS [2,3] and CMS [4,5] have been made since 2010.
The measurements by ATLAS have been pursued in the single lepton channel [2], using 1.04 fb
−1(with a total uncertainty of 2.4 GeV) and in the all-hadronic channel [3], using 2.05 fb
−1(with a total uncertainty of 4.3 GeV).
The objective of this study is to measure the top-quark mass in the dilepton channel, using data recorded by the ATLAS detector at the LHC. In the t¯ t dilepton channel both W-bosons decay leptonically (t t ¯
→bℓ
+νbℓ ¯
−ν) and the final state is thus characterised by the presence of two leptons, two¯ b-jets and missing transverse momentum. For this analysis events with one electron and one muon are considered.
A mass measurement in the dilepton channel is challenging, due to the presence of two neutrinos in the final state. In the single lepton channel (t t ¯
→bℓν bq ¯ q), where there is only one neutrino produced, the ¯ p
Tof the neutrino can be associated with the missing transverse momentum
~p
Tmiss. Since two neutrinos are produced in the dilepton channel, the
~p
Tmisscan only be associated to the sum of the two neutrinos’
momenta.
A way to circumvent this problem is to use the m
T2variable (also known as the stransverse mass) [6].
The m
T2variable is used mainly in exotic particle searches in pair-production events with two undetected particles and represents a lower bound on the parent particle’s mass. A t t ¯ event decaying through the dilepton channel also has this signature, as each parent particle decays into a b-quark jet, a lepton, and a neutrino. The variable has been successfully applied to a top-quark measurement at the Tevatron. CDF measured the top-quark mass in the dilepton channel [7] with a dataset of 3.4 fb
−1with a systematic uncertainty of 2.9 GeV.
2 Data and Monte Carlo simulation samples
The data used in this analysis were recorded by the ATLAS detector [8] during the 2011 data-taking pe- riod with pp collisions at a centre-of-mass energy of 7 TeV. After requiring that the beams are stable and all detector subsystems are operational, the dataset corresponds to an integrated luminosity of 4.7 fb
−1. The integrated luminosity has a relative uncertainty of 3.9% [9, 10].
Monte Carlo (MC) simulation samples have been used to develop and validate the analysis proce- dures and to evaluate the contributions from specific background processes. After event generation, all samples have been processed with the GEANT4 [11, 12] simulation of the ATLAS detector [13], recon- structed and passed through the same analysis chain as the data. The Monte Carlo simulation samples which are used in the analysis include the simulation of additional pp interactions in the same bunch crossing (pile-up), reweighted to match the distribution of the mean number of interactions per bunch crossing seen in the data. The t¯ t signal and single top Wt dilepton events are generated at next-to-leading order (NLO), using the MC@NLO program v4.01 [14–16], with the parton density function (PDF) set CT10 [17], and assuming a top-quark mass of 172.5 GeV. The parton shower and the underlying event are modeled using H
erwig[18] and J
immy[19] with the AUET2-C10 tune [20] to the ATLAS data.
The t¯ t cross section is normalised to 167 pb using the prediction of the H
athor[21] code at approxi- mate next-to-next-to-leading order (NNLO) in QCD. Additionally, t t ¯ samples are generated with differ- ent input top-quark mass values ranging from 150 GeV to 200 GeV. These samples are generated with MC@NLO
+H
erwig/J
immyand processed with the fast version of the ATLAS detector simulation [13].
An additional sample with input mass value of 180 GeV is also used, but processed with the full version
of the detector simulation.
For single top-quark Wt-channel production the cross section is normalised to the MC@NLO pre- dicted cross section using the “diagram removal scheme” [22] to remove overlaps with the t¯ t final state.
The generation of Z/γ
∗+jets events is done with the Alpgenv2.13 program, using the MLM matching scheme [23] and PDF set CTEQ6L1 [24]. The Z/γ
∗+jets samples are normalised with an NNLO/LOk- factor of 1.25. The k-factors are used to scale cross sections from LO calculations to higher order. For these samples the phase space has been restricted to dilepton masses between 10 GeV and 2000 GeV.
The additional partons produced in the matrix element part of the event generation can be either light partons (Z/γ
∗+jets) or heavy-quark pairs (Z/γ∗+c¯c+jets and Z/γ
∗+bb+jets). The inclusive ¯ Z/γ
∗+jetssamples are obtained from the full set of the parton multiplicity sub-samples, including both the light partons with additional jets and the heavy quark with additional jets processes. When these datasets are combined, some events have to be removed in order to avoid double counting heavy-quark production processes in the two samples, since both samples include production of b-quarks and c-quarks via the parton shower.
Diboson WW, WZ and ZZ events are modeled using the H
erwiggenerator, normalised with appro- priate k-factors of 1.48 (WW ), 1.60 (WZ) and 1.30 (ZZ) to match the total cross section from NLO QCD predictions.
To evaluate the generator, parton shower and hadronisation systematic uncertainties in t¯ t simulation, both P
ythia[25] and H
erwigare used to hadronise P
owheg[26–28] samples in order to assess the pos- sible differences in the final measurement. Events generated with A
cerMC [29], interfaced to P
ythiafor the parton shower modeling, with varied parameters governing initial- and final-state radiation (ISR and FSR) are produced to create two samples that characterise the ISR
/FSR uncertainty in this measurement.
The ISR variations are constrained by the ATLAS measurement of t t ¯ production with a veto on additional central jet activity in pp collisions [30]. Similarly, separate set of samples with varied P
ythiaparameter settings are used to estimate the uncertainty due to both the colour reconnection (CR) and the underlying event (UE). Comparisons of the following dedicated P
ythiatunes are used for the uncertainty evaluation:
the author Perugia2011 and Perugia2011 NO CR [31] and the Tevatron tune A-Pro and ACR-Pro with fragmentation parameter settings improved by the Professor collaboration [32, 33]. The UE uncertainty is evaluated using a pair of samples with more and less charged particle activity than observed in the ATLAS data [34].
3 The m
T2variable
The m
T2variable, also known as the stransverse mass, is a kinematic variable used in pair-production events where each parent particle decays into visible particles and one undetected (invisible) particle [6].
This variable represents a lower bound of the parent particle mass [6, 35].
Formally, the m
T2variable can be defined as follows [7]:
m
T2(m
invis)
=min
~pT(1), ~pT(2)
max
hm
T(m
invis, ~p
T(1)), m
T(m
invis, ~p
T(2))
i,
(1)
where the variables
~p
T(1)and
~p
T(2)represent kinematically allowed trial values of the invisible particles’
transverse momenta, as discussed below, and m
T(m
invis, ~p
T(i))
=q
m
2vis+m
2invis+2(E
visTE
invisT −~p
Tvis·~p
T(i))
.(2)
All the visible and invisible particles in Eq. 2 are assumed to come from the same parent particle. Here,
E
Tis the transverse energy, m is the mass,
~p
Tis the transverse momentum, ‘vis’ represents the sum over
all detected particles in each decay, and ‘invis’ stands for the undetected particle in each decay.
When only one neutrino is produced in a collision event, its transverse momentum can be associated with the missing transverse momentum of the event,
~p
Tmiss. However, when two neutrinos are present, the invisible particles’ transverse momenta cannot be inferred from
~p
Tmissindividually. In this case,
~p
Tmissis associated with the vectorial sum of the transverse momenta of all invisible particles,
~
p
T(1)+~p
T(2)= ~p
Tmiss,(3)
where the minimisation in Eq.1 is taken over all values of
~p
T(1)and
~p
T(2)satisfying Eq. 3, and where the superscripted index identifies which neutrino is considered (the numbering of the neutrinos is arbitrary).
Considering the neutrino’s mass to be negligible, the invisible mass term in Eq. 2 is zero. The values marked with vis can be deduced from the visible particles’ four-momentum, defined as:
P
(i)vis =P
(i)lepton+P
(i)b−jet.(4)
4 Mass measurement using m
T2The mean value of the m
T2distribution, m
T2, depends on the top-quark mass. MC simulation samples with varied input masses are therefore used to create a calibration curve that maps this observable onto the top-quark mass. The value of m
T2measured in data is then used to obtain the top-quark mass from the calibration curve, and uncertainties on the observable and the curve itself are translated into an un- certainty on the obtained top-quark mass. The m
T2variable is computed using the algorithm created by Cheng and Han [35].
For this analysis, the m
T2computation requires the following inputs:
•
the missing transverse momentum
~p
Tmiss;
•
the mass of the invisible particles, which is here set to zero;
•
the energies and transverse momenta of the four visible particles (the two leptons and two jets from the t and ¯ t decays).
A problem arises when computing the value for the visible particles using Eq. 4: the lepton-jet pairing in a reconstructed dilepton event is not known a priori. To circumvent this problem, the m
T2value is computed for both possible pairings, and the pairing that returns the smallest m
T2value is taken.
5 Object definition and event selection
5.1 Object definition
The objects used for the analysis are electrons, muons, jets, and missing transverse momentum. Electron candidates are reconstructed in the calorimeter using a cluster-based algorithm and required to have E
T >25 GeV and
|ηcl|<2.47, where
ηcldenotes the pseudorapidity of the calorimeter cluster. Clusters falling in the calorimeter transition region, corresponding to 1.37
< |ηcl| <1.52, are ignored. High quality electron candidates are selected by matching inner detector tracks to electron cluster candidates and requiring stringent selection cuts on calorimeter, tracking and combined variables that provide a good discrimination between electrons and jets [36]. Electrons must also be isolated. The sum of the calorimeter transverse energy within a cone of radius
∆R = p∆η2+ ∆φ2 =
0.2, excluding the cells
associated with the electron, is required to be below a certain threshold that depends on the cluster
energy,
η, and the number of primary vertices. The threshold is chosen so that the efficiency for electronsselected in Z
→ee events to pass this isolation requirement is 90%. In addition, the p
Tof all tracks
within a cone of radius
∆R=0.3 around the electron direction, again excluding the track belonging to the electron, is also restricted to be below a threshold that depends on the cluster energy and
η. Theefficiency for this track-based isolation requirement is also 90% for electrons, selected in Z
→ee events.
The combined track and calorimeter isolation efficiency is (87
±2)%.
Muon candidates are reconstructed by combining track segments found in the inner detector and in the muon spectrometer. Candidates with p
T >20 GeV and
|η| <2.5 are selected. The selected muons must additionally satisfy a series of requirements on the number of track hits in the various tracking sub-detectors [37]. Muons are also required to be isolated: the sum of the calorimeter transverse energy within a cone of radius
∆R=0.2 is required to be below 4 GeV, and the p
Tof all tracks within a cone of radius
∆R=0.3, excluding the track belonging to the muon, must be below 2.5 GeV.
Jets are reconstructed using the anti-k
Talgorithm [38] with a radius parameter of 0.4, using topolog- ical clusters identified in the calorimeter as inputs to the jet clustering. Candidates with p
T >25 GeV and
|η| <2.5 are selected. The response of the calorimeter is corrected through a p
T- and
η-dependentscale that is derived from simulated events. A residual scale dependence on jets is measured in data and the scale is applied in the data analysis [39]. To reject jets from pile-up interactions in the same bunch crossing, a quantity called jet-vertex fraction,
ǫjvf, is defined for each jet using the tracks associated to that jet. This is the ratio of the scalar p
Tsum for the associated tracks that are used to reconstruct the primary vertex (considered to be associated with the hard-scattering collision) to the scalar p
Tsum of all tracks associated to the jet. Jets are required to have
ǫjvf >0.75.
In order to improve the agreement between data and Monte Carlo simulation, several corrections are applied to the reconstructed electrons, muons, and jets. They are further discussed together with their uncertainties in Section 9.
The missing transverse momentum and its magnitude E
missTare calculated using energy clusters in the calorimeters and corrected for the presence of electrons, muons, and jets [40].
After the object selections, the overlaps between different types of objects are considered. First, muons within
∆R<0.4 of the selected jets are removed. Then, any jets within
∆R<0.2 of the selected electron candidates are removed. Finally, electrons within
∆R<0.4 of the remaining jets are removed.
In addition to the general object selections and overlap removal described above, further selection criteria are applied. Only muons with p
T >25 GeV are finally considered. Jets originating from b-quarks from t
→bW decays are searched for using a b-tagging algorithm that identifies jets containing b-hadrons (b-jets). The algorithm identifies b-jets using the tracks associated with the jets. The long lifetimes of weakly-decaying b-hadrons result in secondary and tertiary vertices and tracks with large impact parameters with respect to the primary vertex. The reconstructed impact parameter and secondary vertex measurements for each jet are combined using a neural-network (NN) method [41]. A NN discriminant above a threshold value identifies jets as b-jets. The threshold is chosen such that the overall tagging efficiency for b-jets with p
T >15 GeV is 85% and the rejection of light-flavour jets with p
T >15 GeV is 9 in the simulated t t ¯ sample.
5.2 Event selection
Production of t t ¯ in the dilepton final state is characterised by two isolated leptons with high p
T, missing transverse momentum arising from the two neutrinos and at least two jets. The selection of events with this signature consists of a series of requirements on the reconstructed objects. For this analysis, the following event selections are applied:
•
The appropriate single electron or single muon trigger is required to have fired with thresholds at 20 or 22 GeV for electrons and 18 GeV for muons.
•
To ensure the event is triggered by the leptons used in the analysis, a match between one selected
lepton and the trigger object is required. The matching distance is
∆R<0.15.
•
If the event contains noise bursts in the liquid argon calorimeter, it is rejected.
•
Events containing jets with uncalibrated transverse momentum p
T>10 GeV failing quality criteria against misreconstruction [42] are rejected.
•
Events are required to have at least one good primary vertex candidate with at least five associated tracks.
•
Each event is required to contain exactly one selected electron and one selected muon of opposite charge. The electron and the muon must not share the same track.
•
Events must have at least two b-tagged jets with p
T >45 GeV.
•
The magnitude of the missing transverse momentum of the event must satisfy E
missT >20 GeV.
•
In order to reduce the background, the H
Tvariable must have a value above 130 GeV. H
Tis defined as the scalar sum of transverse momenta of the two selected leptons and all selected jets in the event.
•
The difference in azimuthal angle between the two highest p
Tidentified b-jets,
∆φ(jet1,jet
2), must be larger than 2.2. This requirement is used to reduce the effect of the jet energy scale, initial and final state radiation, and colour reconnection systematic uncertainties.
•
The m
T2of the event must satisfy m
T2 <220 GeV to remove events with at least one wrongly iden- tified b-jet. In t t ¯ simulation the fraction of correctly reconstructed events passing this requirement is 92%.
For the Monte Carlo simulated samples two additional requirements are imposed. The events are required to contain two leptons (e or
µ) originating in the hard interaction or from a τdecay. Both selected leptons are required to match true leptons from W- or Z-boson decays. The contribution of events with two “real” leptons are evaluated with the simulated samples, while events with one or more
“fake” leptons are evaluated with a data-driven approach (see Section 6.1).
The criteria on E
missT, lepton transverse momenta, b-tagged jets transverse momenta, jets maximum
η, and∆φdistance between the two highest p
Tidentified b-jets have been obtained from a multivariate optimisation analysis. In order to avoid bias by statistical fluctuations, the optimisation is not performed with the t t ¯
→eµ events used to generate the calibration curve. Instead, the optimisation is performed using events with two electrons or two muons that pass the eµ event selection (excluding requirements on lepton flavour). The optimisation is based on reducing the value of the total uncertainty on m
top, including statistical and all sources of systematic uncertainties and defined as
q∆2stat.+ ∆2syst.
.
6 Backgrounds
6.1 Background containing fake leptons
True t t ¯ dilepton events contain two isolated leptons from the two W-boson decays. The background comes predominantly from W+jets events and t¯ t events in the single lepton channel, where one lepton is from a W-boson decay and the other is from other sources. There is also a smaller background con- tribution coming from QCD multijet production where both lepton candidates are not from W/Z bosons.
Isolated leptons from W/Z decays are called “real” leptons and other sources of lepton candidates are
called “fake” leptons in the following. The dominant source of fake muons is the semileptonic decay
of a heavy-flavour hadron, where the muon survives the isolation requirement. In the case of electrons,
the three main sources are heavy-flavour decay, light-flavour jets that contain hadrons misidentified as electrons, and photon conversions.
A so-called “matrix method” is used to estimate the fraction of the dilepton sample that contains fake leptons. This method has been used in other t t ¯ dilepton analyses [43]. The basic idea of the method is to estimate the number of fake lepton events using a fake lepton enriched sample obtained by selecting events with looser isolation requirements. The rest of the object and event selections are exactly the same as described in Section 5. The selected leptons are labeled T (L) if they pass (fail) the tight isolation requirements. In this analysis, a selected event contains two leptons and is categorised into one of four types based on the label of the two leptons, T T , T L, LT and LL, where the first (second) label is for the electron (muon) candidate. The selected events can also be categorised according to the source of the leptons, a real lepton (R) or a fake lepton (F). This also leads to four categories, RR, RF, FR, and FF, where the label ordering is also for the electron (muon). The number of events in the different categories, N
iI(i for T T , T L, LT , and LL), and N
IIj( j for RR, RF, FR, and FF ) are connected via a 4
×4 matrix (
M) constructed from the loose-to-tight efficiency of the real electron and that for the fake electron (ǫ
eRand
ǫeF), and also those for muons (ǫ
Rµand
ǫµF). The relationship is expressed as a linear equation,
NI = M×NII. All e
fficiencies are measured in data,
ǫFin a sample enriched in QCD multijet events containing one lepton candidate passing the looser isolation requirement and having low E
Tmiss, and
ǫRin a Z+jets sample.
NIIis extracted using the observed
NIwith the loose lepton selection and
Mwith the measured e
fficiencies. The estimated number of dilepton events containing at least one fake lepton is
ǫeRǫµFN
RFII +ǫeFǫµRN
FRII +ǫeFǫµFN
FFII.
6.2 Other backgrounds
The contributions from other electroweak background processes with two real leptons, such as single top-quark (Wt channel), diboson and the production of Z(
→ττ)+jets events are estimated directly from the MC simulation normalised to the relevant cross sections.
7 Event yield
The expected and measured numbers of events after applying all selection cuts, as described in Section 5, are shown in Table 1. In a dataset of 4.7 fb
−1, 731 eµ candidate events are observed. The total number of expected events is 760
±5(stat.)
+140−130(syst.). The fake lepton background is extracted from data, while the rest of the backgrounds, as well as the signal, are estimated from simulation. The otherwise large backgrounds Z
→ee and Z
→µµare negligible in the eµ channel.
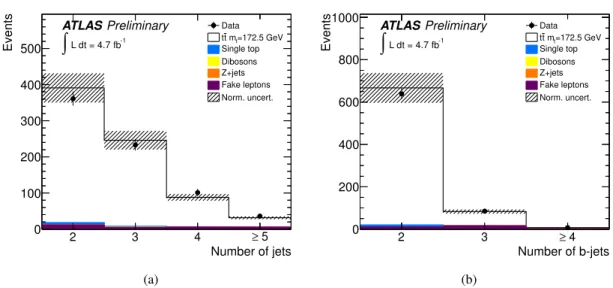
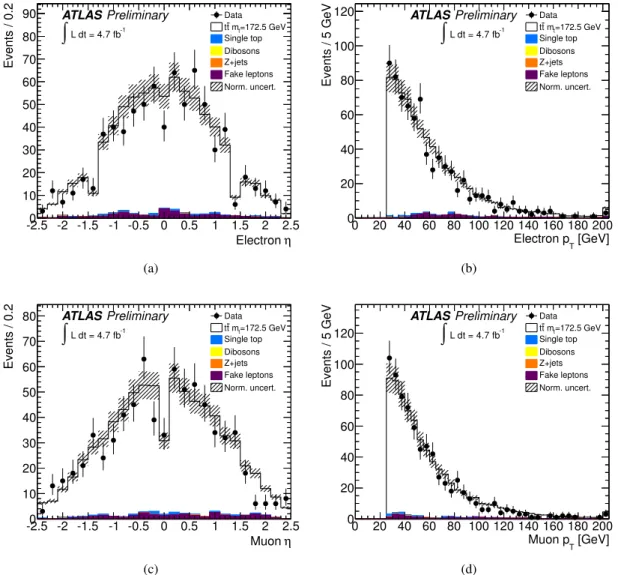
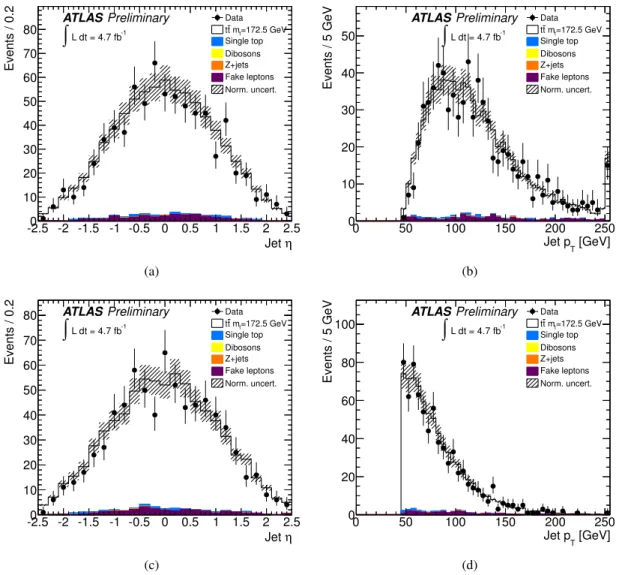
Figure 1 shows the distribution of the number of jets and the distribution of the number of b-tagged jets after the event selection described in Section 5.2. Figures 2 and 3 show the distributions of the
ηand p
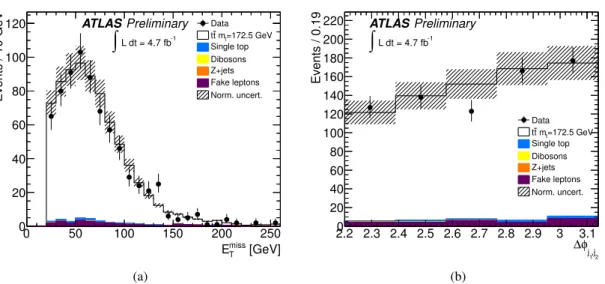
Tof the leptons and b-tagged jets, respectively. Figure 4 shows the distributions for E
Tmissand
∆φbetween the two highest p
Tb-jets.
8 Calibration curve
As mentioned in Section 3, the m
T2variable depends on the top-quark mass. The calibration curve is created from the mean value of m
T2, m
T2, using Monte Carlo simulation samples and templates for the data-driven fake estimation, including all backgrounds. The single top background sample has a fixed top-quark mass of 172.5 GeV for all mass points. The effect of this simplification is found to be negligible.
In Figure 5 examples of m
T2distributions, including the signal and all backgrounds, are shown for
different generated top-quark masses.
Process Events Uncertainty Stat. Syst.
t t ¯ signal 720 5
+140−130Single top 9.3 0.8
+1.6−1.3Z/γ
∗+jets0.8 0.4
+0.1−0.1Dibosons 0.1 0.1
+0.1−0.0Fake electrons 25 1 10
Fake muons 3 1 1
Total expected 760 5
+140−130Total observed 731
Table 1: Event yields after applying all cuts described in Section 5. The statistical and systematic uncer- tainties, as described in Section 9, are also shown.
Number of jets
2 3 4 ≥ 5
Events
0 100 200 300 400
500
∫
L dt = 4.7 fb-1ATLASPreliminary Data
=172.5 GeV mt
t t Single top Dibosons Z+jets Fake leptons Norm. uncert.
(a)
Number of b-jets
2 3 ≥ 4
Events
0 200 400 600 800 1000
L dt = 4.7 fb-1
∫
ATLASPreliminary Data
=172.5 GeV mt
t t Single top Dibosons Z+jets Fake leptons Norm. uncert.
(b)
Figure 1: Distribution of the number of jets (left) and b-tagged jets (right) of selected events. Data
is compared to the expectation from the Monte Carlo simulation and a data-driven estimation of the
contribution from fake leptons described in Section 6.1. The hatched band is the uncertainty on the
normalisation, which includes signal, background and luminosity uncertainties.
η Electron -2.5 -2 -1.5 -1 -0.5 0 0.5 1 1.5 2 2.5
Events / 0.2
0 10 20 30 40 50 60 70 80 90
L dt = 4.7 fb-1
∫
ATLASPreliminary Data
=172.5 GeV mt
t t Single top Dibosons Z+jets Fake leptons Norm. uncert.
(a)
[GeV]
Electron pT
0 20 40 60 80 100 120 140 160 180 200
Events / 5 GeV
0 20 40 60 80 100 120
L dt = 4.7 fb-1
∫
ATLASPreliminary Data
=172.5 GeV mt
t t Single top Dibosons Z+jets Fake leptons Norm. uncert.
(b)
η Muon -2.5 -2 -1.5 -1 -0.5 0 0.5 1 1.5 2 2.5
Events / 0.2
0 10 20 30 40 50 60 70 80
L dt = 4.7 fb-1
∫
ATLASPreliminary Data
=172.5 GeV mt
t t Single top Dibosons Z+jets Fake leptons Norm. uncert.
(c)
[GeV]
Muon pT
0 20 40 60 80 100 120 140 160 180 200
Events / 5 GeV
0 20 40 60 80 100
120
∫
L dt = 4.7 fb-1ATLASPreliminary Data
=172.5 GeV mt
t t Single top Dibosons Z+jets Fake leptons Norm. uncert.
(d)
Figure 2:
ηand p
Tdistributions of electrons (top) and muons (bottom) for events passing the full event
selection. Data is compared to the expectation from the Monte Carlo simulation and a data-driven estima-
tion of the contribution from fake leptons described in Section 6.1. The hatched band is the uncertainty
on the normalisation, which includes signal, background and luminosity uncertainties. In the transverse
momentum distributions events with p
T >200 GeV are included in the last bin.
η Jet -2.5 -2 -1.5 -1 -0.5 0 0.5 1 1.5 2 2.5
Events / 0.2
0 10 20 30 40 50 60 70
80 -1
L dt = 4.7 fb
∫
ATLASPreliminary Data
=172.5 GeV mt
t t Single top Dibosons Z+jets Fake leptons Norm. uncert.
(a)
[GeV]
Jet pT
0 50 100 150 200 250
Events / 5 GeV
0 10 20 30 40
50
∫
L dt = 4.7 fb-1ATLASPreliminary Data
=172.5 GeV mt
t t Single top Dibosons Z+jets Fake leptons Norm. uncert.
(b)
η Jet -2.5 -2 -1.5 -1 -0.5 0 0.5 1 1.5 2 2.5
Events / 0.2
0 10 20 30 40 50 60 70 80
L dt = 4.7 fb-1
∫
ATLASPreliminary Data
=172.5 GeV mt
t t Single top Dibosons Z+jets Fake leptons Norm. uncert.
(c)
[GeV]
Jet pT
0 50 100 150 200 250
Events / 5 GeV
0 20 40 60 80
100
∫
L dt = 4.7 fb-1ATLASPreliminary Data
=172.5 GeV mt
t t Single top Dibosons Z+jets Fake leptons Norm. uncert.
(d)
Figure 3:
ηand p
Tdistributions of the highest (upper row) and second highest (lower row) p
Tb-tagged jet, for events passing the full event selection. Data is compared to the expectation from the Monte Carlo simulation and a data-driven estimation of the contribution from fake leptons described in Section 6.1.
The hatched band is the uncertainty on the normalisation, which includes signal, background and lumi-
nosity uncertainties. In the transverse momentum distributions events with p
T >250 GeV are included
in the last bin.
[GeV]
miss
ET
0 50 100 150 200 250
Events / 10 GeV
0 20 40 60 80 100 120
L dt = 4.7 fb-1
∫
ATLASPreliminary Data
=172.5 GeV mt
t t Single top Dibosons Z+jets Fake leptons Norm. uncert.
(a)
,j2
j1
φ 2.2 2.3 2.4 2.5 2.6 2.7 2.8 2.9 3 ∆3.1
Events / 0.19
0 20 40 60 80 100 120 140 160 180 200 220
L dt = 4.7 fb-1
∫
ATLASPreliminary
Data
=172.5 GeV mt
t t Single top Dibosons Z+jets Fake leptons Norm. uncert.
(b)
Figure 4: Distributions for E
missTand
∆φbetween the two highest p
Tb-jets after the full event selection.
Data is compared to the expectation from the Monte Carlo simulation and a data-driven estimation of the contribution from fake leptons described in Section 6.1. The hatched band is the uncertainty on the normalisation, which includes signal, background and luminosity uncertainties. In the E
Tmissdistribution events with E
missT >250 GeV are included in the last bin.
[GeV]
mT2
0 50 100 150 200 250
Normalised Entries / 10 GeV
0 0.02 0.04 0.06 0.08 0.1 0.12 0.14 0.16 0.18 0.2
ATLASPreliminary
Simulation 160 GeV
175 GeV 190 GeV
Figure 5: m
T2distribution for different top-quark mass values. The contribution from t t ¯ signal and all
backgrounds are included.
The mean value of m
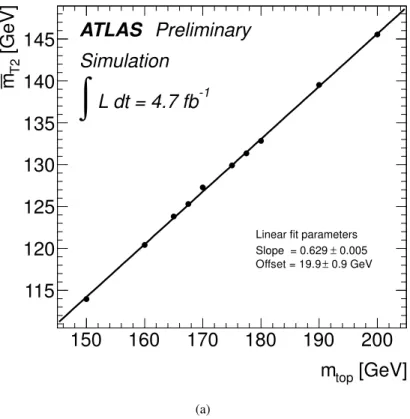
T2for samples with different t t ¯ input top-quark mass (and including all back- grounds) are shown in Figure 6. A linear fit is used to model the dependence of m
T2on the top-quark mass. As a cross-check, the fit is performed for events with two electrons or two muons and compatible fit parameters were found.
As mentioned in Section 2 the samples used to build the calibration curve are processed with ATLAS fast simulation. However, the nominal t t ¯ sample used for the analysis is generated with the full GEANT detector simulation (full simulation). The effect of using fast simulation instead of full simulation is estimated by computing the value of m
T2for the nominal t¯ t sample and obtaining the top-quark mass from the calibration curve. This results in a top-quark mass of 173.7
±0.3 GeV where the expected value is 172.5 GeV. This observed bias of 1.2 GeV is used to correct the extracted top-quark mass from the calibration curve.
[GeV]
m
top150 160 170 180 190 200 [GeV]
T2m
115 120 125 130 135 140 145
Linear fit parameters 0.005
± Slope = 0.629
0.9 GeV
± Offset = 19.9
ATLAS Preliminary Simulation
L dt = 4.7 fb
-1∫
(a)
Figure 6: Calibration curve based on Monte Carlo simulation of t t ¯ events at different input top-quark masses including all expected backgrounds. The uncertainties are statistical only.
9 Systematic uncertainties
A number of systematic effects can have an impact on this measurement. Modeling uncertainties are typically evaluated by comparing the nominal t¯ t simulation sample with one or more alternative samples.
If only one alternative sample is used, the full di
fference is taken both as positive and negative systematic uncertainty, unless otherwise noted. In addition, as mentioned in Section 5.1, several corrections are applied to the reconstructed electrons, muons and jets and their uncertainties also have to be taken into account. The following e
ffects and corrections were considered and evaluated for this analysis:
• Generator for t¯t
- Two NLO matrix-element generators are used to estimate the systematic un-
certainty due to the choice of the signal Monte Carlo generator. The t t ¯ sample that is used for
the nominal analysis is generated by MC@NLO and is compared with a sample generated with P
owheg. Both generators are interfaced to H
erwig/Jimmyfor hadronisation.
• Parton showering and hadronisation models
- The effect of different showering models is taken into account by comparing the results for the P
owheggenerator with showering performed by P
ythiaand by H
erwig.
• Colour reconnection
- The uncertainty due to colour reconnection is computed using two pairs of t t ¯ signal samples, generated by A
cerMC+P
ythia. Each pair is compared, and the largest difference is taken as the systematic uncertainty.
• ISR and FSR
- In order to take into account the uncertainty due to initial- and final-state radiation, which can introduce additional gluon jets in the observed events, two Monte Carlo samples with different ISR and FSR activity are used. As the two Monte Carlo samples cover extreme variations of ISR/FSR, only half the difference between these two samples is taken as symmetric system- atic uncertainty. A rather small uncertainty (0.1 GeV) is observed which appears to stem from cancellations between shifts of the peak of the m
T2distribution and changes in the tail. Because just two samples cannot parameterise the effects of independent variations in ISR and FSR, the uncertainty is evaluated separately on the peak, defined as m
T2 <180 GeV and the tail, defined as m
T2 >180 GeV and then added in quadrature. As a result this uncertainty is evaluated to be 0.5 GeV.
• PDF uncertainty
- The signal Monte Carlo generator MC@NLO uses CT10 [44] parton dis- tribution functions (PDFs) to model the incoming partons of the hard scattering process. The systematic uncertainty is evaluated taking the largest difference between three models, CT10 best fit, MSTW2008nlo68cl [45] best fit, and the mean of 100 parameter variations of NNPDF20 [46].
Half of the largest difference is assigned as a symmetric uncertainty.
• MC normalisation
- The theoretical uncertainty on the cross section of t t ¯ signal (10%) and of single top-quark background (8%) are taken into account and found to have a negligible impact on the measurement.
• Fakes normalisation and shape
- The fake event normalisation and shape uncertainties are es- timated by varying the loose-to-tight e
fficiencies of the fake leptons. In addition, the level of agreement between data and the estimate in the fake event enhanced control region for top dilep- ton analyses is taken into account for the normalisation systematic uncertainty. The uncertainty on the e
fficiencies for the fake leptons is based on di
fferent QCD multijet event selections.
• Calibration curve
- To evaluate the uncertainty on the bias due to the use of fast simulation datasets in the calibration curve, a second calibration curve is constructed, based on two full sim- ulation samples at different masses, albeit with significantly less statistical precision. At the ob- served value of m
T2the top-quark mass is also extracted from this second (full simulation) cali- bration curve, and the propagation of the fit parameters’ uncertainty into the mass measurement is quoted as the systematic uncertainty on the bias. The statistical uncertainty on the calibration curve (fast simulation) is estimated by propagating the uncertainties on the fit parameters into the mass measurement. The two uncertainties are added in quadrature.
• Underlying event (UE)
- In order to take into account the uncertainty on the modeling of the
underlying event, half the difference between two Monte Carlo datasets with more UE or less UE
is evaluated and assigned as the systematic uncertainty. These two datasets are generated with
A
cerMC+P
ythia.
• Jet energy scale
- The jet energy scale (JES) calibration is estimated with 2011 ATLAS data using several in situ techniques that exploit the transverse momentum balance between a jet and a reference object such as a photon or a Z-boson [47]. The baseline JES uncertainty for the selected jets is lower than 1% for central jets with 55
<p
T<500 GeV and is parameterised as a function of jet p
Tand
η. There is an additional uncertainty due to the pile-up effects in 2011 data. Additionaluncertainties due to modeling of the jet fragmentation (e.g. from quark or gluon induced jets) in the Monte Carlo simulation and due to event topologies with low- p
Tclose-by jets are also evaluated for the top-quark pairs event samples. For b-quark induced jets an additional b-jet energy scale uncertainty of up to 2.5%, depending on the jet p
T, is used. The uncertainty on the measurement from JES is estimated varying the jet p
Tby
±1σ of the total JES uncertainty. At the same time, the E
missTis re-evaluated, taking into account the scaled contributions of the jets in p
xand p
y.
• Jet energy resolution (JER)
- Jet energy resolution in Monte Carlo is described well. Additional smearing corresponding to the uncertainty is applied on Monte Carlo and the difference in the measurement is considered as an uncertainty from the JER [48]. The same size of the uncertainty is assigned in the other direction. The effect due to the JER systematic variation is also propagated to E
missT.
• Leptons
- In order to account for small differences between data and simulation in the modeling of trigger, reconstruction and identification efficiencies for leptons, scale factors are evaluated and uncertainties on the evaluation are taken into account. The uncertainty on the isolation e
fficiency is also considered for electrons. p
T-dependent resolution and calibration uncertainties are also taken into account varying the p
Tby
±1σ. The effect due to the systematic variation of p
Thas been propagated to E
missT.
• Missing transverse momentum and jets
- The effect on E
missTdue to the uncertainties of jets, electrons and muons is already accounted for when these uncertainties are evaluated. The uncer- tainties due to the energy scale of clusters which are not included in the objects above, the energy scale for low p
Tjets (7 - 20 GeV) which are included in the E
missTcalculation at the electromagnetic scale, and the effect of pile-up are also taken into account. The uncertainty due to pile-up on E
missTis estimated to be 6.6% by comparing data and Monte Carlo simulation for Z
→ µµevents. The systematic uncertainties due to the jet reconstruction and jet vertex fraction efficiencies are also considered and estimated to be small; these are quoted together with E
Tmissin Table 2.
•
b-tagging - The performance of the b-tagging algorithm in data is calibrated using samples of dijet events containing muons in bins of jet p
T[49]. Scale factors for the b-tagging e
fficiency of b-, c- and light-flavour jets are determined separately, together with their uncertainties. These uncertainties are used to evaluate the systematic uncertainty related to the b-tagging algorithm.
A summary of all systematic uncertainties and their contribution to the overall systematic uncertainty can be found in Table 2. The Monte Carlo statistical uncertainty on generator, parton shower, ISR/FSR, colour reconnection and underlying event systematics is 0.3 GeV.
10 Results
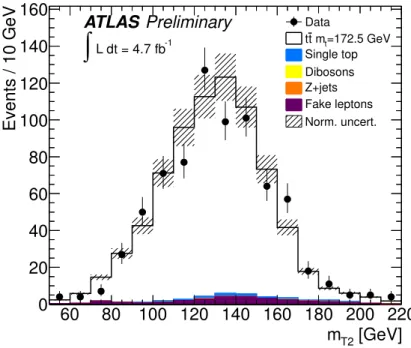
The mean value of m
T2is determined using 4.7 fb
−1of data collected by ATLAS in 2011 with
√s
=7 TeV. Figure 7 shows the data m
T2distribution together with Monte Carlo expectation for a top-quark mass m
top =172.5 GeV. Using the calibration curve of Figure 6 the top-quark mass is measured to be:
m
top =175.2
±1.6(stat.)
+3.1−2.8(syst.) GeV
.(5)
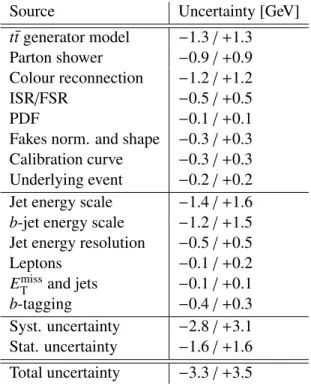
Source Uncertainty [GeV]
t t ¯ generator model
−1.3
/ +1.3Parton shower
−0.9
/ +0.9Colour reconnection
−1.2
/ +1.2
ISR/FSR
−0.5
/ +0.50.1
/ +0.1Fakes norm. and shape
−0.3
/ +0.3 Calibration curve
−0.3
/ +0.3Underlying event
−0.2
/ +0.2Jet energy scale
−1.4
/ +1.6 b-jet energy scale
−1.2
/ +1.5Jet energy resolution
−0.5
/ +0.5Leptons
−0.1
/ +0.2
E
missTand jets
−0.1
/ +0.1b-tagging
−0.4
/ +0.3Syst. uncertainty
−2.8
/ +3.1 Stat. uncertainty
−1.6
/ +1.6Total uncertainty
−3.3
/ +3.5Table 2: List of all systematic uncertainties taken into account for the measurement of the top-quark mass. The statistical and total uncertainties are also shown.
The total uncertainty (2.0%) is dominated by the systematic uncertainty (1.8%). The main sources of
systematic uncertainty are the jet energy scale (0.9%), the b-jet energy scale (0.8%), the generator model
(0.7%) and colour reconnection (0.7%). This result is in good agreement with previous measurements at
the Tevatron [1] and at the LHC [2–5].
[GeV]
m
T260 80 100 120 140 160 180 200 220
Events / 10 GeV
0 20 40 60 80 100 120 140 160
L dt = 4.7 fb-1
∫
ATLAS Preliminary
Data=172.5 GeV mt
t t Single top Dibosons Z+jets Fake leptons Norm. uncert.
Figure 7: m
T2distribution of the selected events.
References
[1] Tevatron Electroweak Working Group, for the CDF and D0 Collaborations, Combination of CDF and DØ results on the mass of the top quark using up to 5.8 fb
−1of data, arXiv:1107.5255 [hep-ex].
[2] ATLAS Collaboration, Measurement of the top quark mass with the template method in the t¯ t
→lepton
+jets channel using ATLAS data, Eur. Phys. J.
C72(2012) 2046, arXiv:1203.5755 [hep-ex].
[3] ATLAS Collaboration, Determination of the top quark mass with a template method in the all hadronic decay channel using 2.04 fb
−1of ATLAS data, ATLAS-CONF-2012-030,
cdsweb.cern.ch/record/1431895.
[4] CMS Collaboration, Measurement of the t t production cross section and the top quark mass in the ¯ dilepton channel in pp collisions at
√s
=7 TeV, JHEP1107 (2011) 049, arXiv:1105.5661 [hep-ex].
[5] CMS Collaboration, Measurement of the top quark mass in the muon+jets channel, CMS PAS TOP-11-015, cdsweb.cern.ch/record/1427762.
[6] C. Lester and D. Summers, Measuring masses of semi-invisibly decaying particles pair produced at hadron colliders, Phys. Lett.
B463(1999) 99–103, arXiv:hep-ph/9906349 [hep-ph].
[7] CDF Collaboration, Top quark mass measurement using m
T2in the dilepton channel at CDF, Phys. Rev.
D81(2010) 031102, arXiv:0911.2956 [hep-ex].
[8] ATLAS Collaboration, The ATLAS experiment at the CERN Large Hadron Collider, JINST3
(2008) S08003.
[9] ATLAS Collaboration, Luminosity determination in pp collisions at
√s
=7 TeV using the ATLAS detector in 2011, ATLAS-CONF-2011-116, cdsweb.cern.ch/record/1376384.
[10] ATLAS Collaboration, Luminosity determination in pp collisions at
√s
=7 TeV using the ATLAS detector at the LHC, Eur. Phys. J.
C71(2011) 1630.
[11] S. Agostinelli et al., GEANT4: A Simulation toolkit, NIMA506 (2003) 250–303.
[12] J. Allison, K. Amako, J. Apostolakis, H. Araujo, P. Dubois, et al., GEANT4 developments and applications, IEEE Trans. Nucl. Sci.
53(2006) 270.
[13] ATLAS Collaboration, The ATLAS simulation infrastructure, Eur. Phys. J.
C70(2010) 823–874, arXiv:1005.4568 [physics.ins-det].
[14] S. Frixione and B. R. Webber, Matching NLO QCD computations and parton shower simulations, JHEP0206 (2002) 029, arXiv:hep-ph/0204244 [hep-ph].
[15] S. Frixione, E. Laenen, P. Motylinski, and B. R. Webber, Single-top production in MC@NLO, JHEP0603 (2006) 092, arXiv:hep-ph/0512250 [hep-ph].
[16] S. Frixione, P. Nason, and B. R. Webber, Matching NLO QCD and parton showers in heavy flavor production, JHEP0308 (2003) 007, arXiv:hep-ph/0305252 [hep-ph].
[17] H.-L. Lai, M. Guzzi, J. Huston, Z. Li, P. M. Nadolsky, et al., New parton distributions for collider physics, Phys. Rev.
D82(2010) 074024, arXiv:1007.2241 [hep-ph].
[18] G. Corcella, I. Knowles, G. Marchesini, S. Moretti, K. Odagiri, et al., HERWIG 6: An event generator for hadron emission reactions with interfering gluons (including supersymmetric processes), JHEP0101 (2001) 010, arXiv:hep-ph/0011363 [hep-ph].
[19] J. M. Butterworth, J. R. Forshaw, and M. H. Seymour, Multiparton interactions in
photoproduction at HERA, Z. Phys.C72 (1996) 637–646, arXiv:hep-ph/9601371 [hep-ph].
[20] ATLAS Collaboration, New ATLAS event generator tunes to 2010 data, ATL-PHYS-PUB-2011-008, cdsweb.cern.ch/record/1345343.
[21] M. Aliev et al., HATHOR: HAdronic Top and Heavy quarks cross section calculatoR, Comput. Phys. Commun.
182(2011) 1034–1046, arXiv:1007.1327 [hep-ph].
[22] S. Frixione, E. Laenen, P. Motylinski, B. R. Webber, and C. D. White, Single-top hadroproduction in association with a W boson, JHEP0807 (2008) 029, arXiv:0805.3067 [hep-ph].
[23] M. L. Mangano et al., Alpgen, a generator for hard multiparton processes in hadronic collisions, JHEP0307 (2003) 001, arXiv:hep-ph/0206293 [hep-ph].
[24] J. Pumplin et al., New generation of parton distributions with uncertainties from global QCD analysis, JHEP0207 (2002) 012, arXiv:hep-ph/0201195 [hep-ph].
[25] T. Sjostrand, S. Mrenna, and P. Z. Skands, PYTHIA 6.4 physics and manual, JHEP0605 (2006) 026, arXiv:hep-ph/0603175 [hep-ph].
[26] P. Nason, A New method for combining NLO QCD with shower Monte Carlo algorithms,
JHEP0411 (2004) 040, arXiv:hep-ph/0409146 [hep-ph].
[27] S. Frixione, P. Nason, and C. Oleari, Matching NLO QCD computations with parton shower simulations: the POWHEG method, JHEP0711 (2007) 070, arXiv:0709.2092 [hep-ph].
[28] S. Alioli, P. Nason, C. Oleari, and E. Re, A general framework for implementing NLO calculations in shower Monte Carlo programs: the POWHEG BOX, JHEP1006 (2010) 043,
arXiv:1002.2581 [hep-ph].
[29] B. Kersevan and E. Richter-Was, The Monte Carlo event generator AcerMC version 2.0 with interfaces to PYTHIA 6.2 and HERWIG 6.5, arXiv:hep-ph/0405247.
[30] ATLAS Collaboration, Measurement of t t production with a veto on additional central jet activity ¯ in pp collisions at
√s
=7 TeV using the ATLAS detector, accepted for publication in JHEP, arXiv:1203.5015 [hep-ex].
[31] P. Z. Skands, Tuning Monte Carlo generators: the Perugia tunes, Phys. Rev.
D82(2010) 074018, arXiv:1005.3457[hep-ph].
[32] M. G. Albrow et al., Tevatron-for-LHC report of the QCD working group, arXiv:hep-ph/0610012.
[33] A. Buckley, H. Hoeth, H. Lacker, H. Schulz, and J. E. von Seggern, Systematic event generator tuning for the LHC, Eur. Phys. J.C65 (2010) 331–357, arXiv:0907.2973 [hep-ph].
[34] ATLAS Collaboration, Measurement of underlying event characteristics using charged particles in pp collisions at
√s
=900 GeV and 7 TeV with the ATLAS detector, Phys. Rev.
D83(2011) 112001, arXiv:1012.0791 [hep-ex].
[35] H.-C. Cheng and Z. Han, Minimal kinematic constraints and m
T2, JHEP0812 (2008) 063, arXiv:0810.5178 [hep-ph].
[36] ATLAS Collaboration, Electron performance measurements with the ATLAS detector using the 2010 LHC proton-proton collision data, Eur. Phys. J.
C72(2012) 1909, arXiv:1110.3174 [hep-ex].
[37] ATLAS Collaboration, Measurement of the W
→ℓνand Z/γ
⋆ →ℓℓproduction cross sections in proton-proton collisions at
√s
=7 TeV with the ATLAS detector, JHEP1012 (2010) 060, arXiv:1010.2130 [hep-ex].
[38] M. Cacciari, G.P. Salam and G. Soyez, The anti-k
tjet clustering algorithm, JHEP04 (2008) 63, arXiv:0802.1189 [hep-ex].
[39] ATLAS Collaboration, Jet energy measurement with the ATLAS detector in proton-proton collisions at
√s
=7 TeV, submitted to Eur. Phys. J. C, arXiv:1112.6426 [hep-ex].
[40] ATLAS Collaboration, Performance of the missing transverse energy reconstruction and calibration in proton-proton collisions at a center-of-mass energy of 7 TeV with the ATLAS detector, ATLAS-CONF-2010-057, cdsweb.cern.ch/record/1281330.
[41] ATLAS Collaboration, Commissioning of the ATLAS high-performance b-tagging algorithms in the 7 TeV collision data, ATLAS-CONF-2011-102, cdsweb.cern.ch/record/1369219.
[42] ATLAS Collaboration, Selection of jets produced in proton-proton collisions with the ATLAS
detector using 2011 data, ATLAS-CONF-2012-020, cdsweb.cern.ch/record/1430034.
[43] ATLAS Collaboration, Measurement of the top quark pair production cross section in pp collisions at
√s
=7 TeV in dilepton final states with ATLAS, Phys. Lett.
B707(2012) 459–477, arXiv:1108.3699 [hep-ex].
[44] P. M. Nadolsky et al., Implications of CTEQ global analysis for collider observables, Phys. Rev.
D78(2008) 013004, arXiv:0802.0007 [hep-ph].
[45] A. Martin, W. Stirling, R. Thorne, and G. Watt, Parton distributions for the LHC, Eur. Phys. J.
C63(2009) 189–285, arXiv:0901.0002 [hep-ph].
[46] R. D. Ball, L. Del Debbio, S. Forte, A. Guffanti, J. I. Latorre, et al., A first unbiased global NLO determination of parton distributions and their uncertainties, Nucl. Phys.
B838(2010) 136–206, arXiv:1002.4407 [hep-ph].
[47] ATLAS Collaboration, Probing the measurement of jet energies with the ATLAS detector using Z+jet events from proton-proton collisions at
√s
=7 TeV, ATLAS-CONF-2012-053,
cdsweb.cern.ch/record/1452641.
[48] ATLAS Collaboration, Jet energy resolution and reconstruction efficiencies from in-situ
techniques with the ATLAS detector using proton-proton collisions at a center of mass energy
√s
=