A TLAS-CONF-2017-056 10 July 2017
ATLAS CONF Note
ATLAS-CONF-2017-056
5th July 2017
Direct top-quark decay width measurement in the t t ¯ lepton+jets channel at √
s = 8 TeV with the ATLAS experiment
The ATLAS Collaboration
This note presents a direct measurement of the decay width of the top quark using t¯ t events in the lepton+jets final state. The data sample is collected by the ATLAS detector at the LHC in proton-proton collisions at a centre-of-mass energy of 8 TeV and corresponds to an integrated luminosity of 20.2 fb
−1. The decay width of the top quark is measured using a template fit to distributions of kinematic observables associated with the hadronically and semileptonically decaying top quarks. The result, Γ
t= 1 . 76 ± 0 . 33 ( stat. )
+0.79−0.68
( syst. ) GeV for a top-quark mass of 172.5 GeV, is consistent with the prediction of the Standard Model.
© 2017 CERN for the benefit of the ATLAS Collaboration.
Reproduction of this article or parts of it is allowed as specified in the CC-BY-4.0 license.
1 Introduction
The top quark is the heaviest particle in the Standard Model (SM) of elementary particle physics, discovered more than 20 years ago in 1995 [1, 2]. Due to its large mass of around 173 GeV [3–5], the lifetime of the top quark is extremely short. Hence, its decay width is the largest of all SM fermions. A next-to- leading order (NLO) calculation evaluates a decay width of Γ
t= 1 . 33 GeV for a top-quark mass ( m
t) of 172.5 GeV [6, 7]. Variations of the W boson mass, α
S, the Fermi coupling constant G
Fand the Cabibbo- Kobayashi-Maskawa matrix element V
t b, entering the NLO calculation, yield an uncertainty of 6%. The recent next-to-next-to-leading order (NNLO) calculation predicts Γ
t= 1 . 322 GeV for m
t= 172 . 5 GeV and a strong coupling constant α
S= 0 . 1181 [8].
Any deviations from the SM prediction may hint at non-SM decay channels of the top quark or non-SM top- quark couplings, as predicted by many Beyond-the-Standard-Model (BSM) theories. The top-quark decay width can be modified by direct top-quark decays into e.g. a charged Higgs boson [9, 10] or via flavour- changing neutral currents [11, 12] and also by non-SM radiative corrections [13]. Furthermore, some vector-like quark models [14] modify the |V
t b| CKM matrix element and thus Γ
t. Precise measurements of Γ
tcan consequently restrict the parameter space of many BSM models.
Extractions of Γ
tfrom the t → W b branching ratio B and the single-top t -channel cross-section, such as those of Refs. [15, 16], have reached a precision of 0.14 GeV, but depend on the assumption that P
q
B(t → W q) = 1 with q = d, s, b , and use theoretical SM predictions for Γ(t → W b) and the single-top t -channel cross-section. A direct measurement of Γ
t, based on the analysis of the top-quark invariant mass distribution, which does not rely on such assumptions, was performed at the Tevatron by the CDF collaboration [17]. A bound on the decay width of 1 . 10 < Γ
t< 4 . 05 GeV for m
t= 172 . 5 GeV was set at 68% confidence level. The direct measurements are limited by the experimental resolution of the top-quark mass spectrum, and so far are significantly less precise than indirect measurements. Some BSM models, vector-like quark models for example [14], predict a sizable deviation from the assumptions used in indirect measurements. This provides a motivation to perform a direct measurement of Γ
talthough the latter are not yet sensitive to alternative models with the current precision.
This analysis is based on ATLAS data recorded at a centre-of-mass energy of
√ s = 8 TeV in 2012 in LHC proton-proton collisions. The top-quark decay width is extracted using t¯ t events in the lepton+jets channel with t → W b where one W -boson from the two top quarks decays hadronically into two lighter quarks and the other one decays leptonically into a charged lepton and a neutrino (the corresponding top quarks are referred to as hadronically and semileptonically decaying, respectively). Thus, the final state consists of four jets, two of which are b -jets from the top-quark decay, one charged electron or muon and missing transverse momentum ( E
missT
) due to the undetected neutrino.
The measurement is performed using two observables sensitive to Γ
t: m
`b, which is the reconstructed invariant mass of the system formed by the b -jet and the charged lepton ` from the semileptonic top-quark decay, and ∆R
min( j
b, j
l) 1, defined as the angular distance between the b -jet j
bassociated to the hadronic top quark and the closest light jet j
lfrom the hadronically decaying W -boson. This approach exploits the kinematic information from both the hadronically and the semileptonically decaying top quarks.
1
ATLAS uses a right-handed coordinate system with its origin at the nominal interaction point (IP) in the centre of the detector and the
z-axis along the beam pipe. The
x-axis points from the IP to the centre of the LHC ring, and the
y-axis points upwards. Cylindrical coordinates
(r, φ)are used in the transverse plane,
φbeing the azimuthal angle around the
z-axis.The pseudorapidity is defined in terms of the polar angle
θas
η =−ln tan
(θ/2
). Angular distance is measured in units of
∆R≡
q(∆η)2+(∆φ)2
.
A template method is used to measure the top-quark decay width. Templates for the two observables are built for all contributing SM processes. Distributions for multijet production with fake or non-prompt leptons are formed using a data-driven method. Templates for the other SM processes, including top- quark pair production and electro-weak single-top production, are generated using Monte Carlo (MC) simulations. Templates for different top-quark decay width values are constructed by reweighting MC events. These templates are used in a binned likelihood fit to data to extract Γ
t.
The ATLAS detector is described in the next section. Section 3 introduces MC simulated samples and the dataset, followed by a description of the event selection and reconstruction in Section 4. The template fit is described in Section 5, the systematic uncertainties are listed in Section 6. Section 7 presents the results of the measurement and Section 8 concludes the note.
2 ATLAS Detector
The ATLAS experiment [18] at the LHC is a multi-purpose particle detector with a forward-backward symmetric cylindrical geometry and a near 4 π coverage in solid angle. It consists of an inner tracking de- tector surrounded by a thin superconducting solenoid providing a 2 T axial magnetic field, electromagnetic and hadron calorimeters, and a muon spectrometer. The inner tracking detector covers the pseudorapidity range |η | < 2 . 5. It consists of silicon pixel, silicon micro-strip, and transition radiation tracking detect- ors. Lead/liquid-Argon (LAr) sampling calorimeters provide electromagnetic (EM) energy measurements with high granularity. A hadron (iron/scintillator-tile) calorimeter covers the central pseudorapidity range ( |η | < 1 . 7). The end-cap and forward regions are instrumented with LAr calorimeters for both EM and hadronic energy measurements up to |η | = 4 . 9. The muon spectrometer surrounds the calorimeters and is based on three large air-core toroid superconducting magnets with eight coils each. Its bending power is in the range from 2.0 to 7.5 Tm. It includes a system of precision tracking chambers and fast detectors for triggering. A three-level trigger system is used to select events. The first-level trigger is implemented in hardware and uses a subset of the detector information to reduce the accepted rate to at most 75 kHz. This is followed by two software-based trigger levels that together reduce the accepted event rate to 400 Hz on average.
3 Data and Simulated Event Samples
The decay width of the top quark is measured using data which corresponds to an integrated luminosity of 20 . 2 ± 0 . 4 fb
−1[19]. Single-lepton triggers for electrons and muons under stable beam conditions are used. For each lepton type, two single-lepton triggers with the p
Tthresholds of 24 (24) and 60 (36) GeV for electrons (muons) are used. The two triggers with the lower p
Tthresholds impose additional isolation requirements on the lepton to keep a low trigger rate. No isolation requirement is used by the higher p
Tthreshold triggers.
The nominal signal t¯ t sample is generated assuming a top-quark mass of m
t= 172 . 5 GeV using the
Powheg-Box (v1) generator [20–22], referred to in the following as Powheg, providing NLO QCD
matrix element calculations [23]. The h
dampparameter that regulates the high- p
Tradiation in Powheg is
set to m
t. The CT10 parton distribution function (PDF) set [24] is used. The generator is interfaced with
Pythia 6.425 [25] for parton showering, hadronisation and underlying event using the Perugia 2011C set
of tuned parameters [26] and the CTEQ6L1 PDF set [27]. To estimate the impact of the parton shower
model choice, a Powheg+Pythia6 sample is compared to a sample generated with Powheg interfaced with Herwig 6.520 [28] using Jimmy v4.31 [29] to simulate the underlying event. The latter sample is referred to as Powheg+Herwig in the following. The h
dampparameter is set to infinity in both samples used to assess the parton shower systematic effect. The uncertainty due to the MC event generator choice is evaluated using the alternative MC generator MC@NLO [30, 31] for the hard process, interfaced to Herwig for showering and hadronisation which is compared to the Powheg+Herwig sample. To assess the impact of the initial and final state radiation (ISR and FSR), samples generated with Powheg are interfaced to Pythia with different settings for the generator parameters regulating ISR and FSR. In these samples, the h
dampparameter and the factorisation and renormalisation scales in Powheg as well as the transverse momentum scale for space-like parton shower evolution in Pythia are varied to cover the range in additional jet multiplicity corresponding to the uncertainty of t¯ t production measurements in association with jets [32, 33]. The t¯ t samples are normalised using the theoretical cross-section of σ
tt¯= 253
+15−16pb, based on a calculation performed with the top++2.0 [34–39] programme that includes NNLO corrections and resums next-to-next-to-leading logarithmic order (NNLL) soft gluon terms. PDF and scale variations, the choice of α
S, and the input top-quark mass are regarded as systematic uncertainties.
Background events containing a W - or a Z -boson produced in association with jets are generated using the Alpgen 2.14 [40] LO event generator with up to five additional partons and the CTEQ6L1 PDF set [27]. Parton shower and fragmentation are modeled with Pythia 6.425. Separate samples are generated for W/Z + b b ¯ , W /Z + c c ¯ , W + c , and W /Z +light jets. A parton-jet matching scheme (“MLM matching”) [41] is used to prevent double-counting of jets generated by both the matrix-element calculation and the parton-shower evolution. The W +jets events are normalised using a data-driven method utilising the asymmetry of W
±production in pp collision. The corrections for generator mismodelling in the fractions of different flavour components ( W + b b ¯ , W + c c ¯ , W + c and W +light jets) are estimated in a sample with the same lepton and E
missT
selections as the signal selection, but with only two jets and no b -tagging requirement. The b -jet multiplicity, in conjunction with knowledge of the b -tagging and mistag efficiency, is used to extract the heavy-flavour fractions. The measured correction factors used in the analysis are K
bb¯= K
cc¯= 1 . 50 ± 0 . 11 (stat.+syst.), K
c= 1 . 07 ± 0 . 27 (stat.+syst.) and K
light= 0 . 80 ± 0 . 04 (stat.+syst.) [42]. Z +jets events are normalised using the inclusive NNLO theoretical cross-section [43].
Diboson background samples are generated with the Sherpa 1.4.1 generator [44] with up to three additional partons in the LO matrix elements using the CT10 PDF set. In the generation step, heavy flavour quarks ( b , c ) are treated as massive particles. The samples are normalised to the NLO theoretical cross- sections [45].
At leading order, three single-top-quark production mechanisms, s -channel, t -channel and associated W t production, contribute to the single-top-quark background. These processes are simulated with Powheg using the CT10 PDF set. All samples are interfaced to Pythia 6.425 with the CTEQ6L1 PDF set and the Perugia 2011C tune. Overlaps between the t t ¯ and W t final states are removed [46]. All individual single-top-quark samples are normalised using their corresponding approximate NNLO theoretical cross- sections [47, 48] based on an MSTW 2008 NNLO PDF set calculation [49].
Multijet events can pass the selection because of the misidentification of a jet or a photon as an electron
(prompt fake lepton) or because of the presence of a non-prompt lepton (electron or muon), which can
originate from semileptonic decays of heavy-flavour hadrons. This background, referred to as multijet
background in the following, is estimated directly from data using a data-driven matrix method [50].
The detector response [51] is simulated using the GEANT 4 simulation toolkit [52]. To estimate some systematic effects, samples passed through a fast simulation are used. This simulation utilises a paramet- erisation of the performance of the EM and hadronic calorimeters while a full simulation is used for the tracking systems. The effects of in-time and out-of-time pile-up (multiple pp interactions from the same or neighbouring bunch-crossings) are included in the simulation and the simulated events are reweighted in order to match the distribution in the data. Events from minimum-bias interactions are simulated with the Pythia 8.1 generator with the MSTW 2008 LO PDF set and the A2 tune [53].
4 Event Selection and Reconstruction
4.1 Event Reconstruction
Electrons, muons, jets, b -jets and missing transverse momentum are used to select t¯ t events in this analysis.
Electron candidates are reconstructed using energy deposits in the electromagnetic calorimeter matched with reconstructed inner detector tracks [54]. These calorimeter clusters are required to have p
T> 25 GeV and |η| < 2 . 47, with the transition region between the barrel and endcap detector 1 . 37 < |η| < 1 . 52 excluded. Isolation requirements are used to reduce the background from non-prompt electrons, which are produced in jets originating mainly from decays of heavy flavoured hadrons. A 90% efficient p
Tand η -dependent isolation cut is placed on the sum of transverse energy deposited within a cone of ∆R = 0 . 2 around the calorimeter cells associated to the electron. This energy sum excludes cells associated with the electron cluster and is corrected for leakage from the electron cluster itself and for energy deposits from pile-up. Another p
Tand η -dependent isolation cut with 90% efficiency is made on the scalar sum of track transverse momenta around the electron within a cone of ∆R = 0 . 3. Furthermore, the longitudinal impact parameter z
0of the electron track with respect to the selected event primary vertex (PV) is required to be smaller than 2 mm.
Muon candidate reconstruction is based on track segments recorded by the various muon spectrometer layers which are matched with inner-detector tracks [55]. The combined muon track must satisfy p
T>
25 GeV and |η| < 2 . 5 and its longitudinal impact parameter z
0with respect to the PV is required to be smaller than 2 mm. Muon candidates have to be separated from any jet by ∆R > 0 . 4 and are required to satisfy a p
T-dependent track-based isolation requirement. In particular, the scalar sum of the transverse momenta of tracks within a cone of ∆R < 10 GeV /p
Taround the muon candidate (without the muon track itself) has to be less than 5% of the muon transverse momentum.
Jets are reconstructed using the anti- k
talgorithm [56, 57], implemented in the FastJet package [58], with
a radius parameter of R = 0 . 4. The jet reconstruction starts from calibrated topological clusters [59] which
are built based on energy deposits in the calorimeters. To correct for effects due to non-compensation,
dead material and out-of-cluster leakage, a local cluster calibration scheme [60, 61] is applied prior to
jet finding. Simulations of charged and neutral particles are exploited to estimate these corrections. The
jets are calibrated using energy- and |η| -dependent calibration factors, derived from simulations, to the
mean energy of stable particles inside the jets. A residual calibration [62] of the jet energy scale (JES)
was performed based on data taken in 2012. Dijet events are used to calibrate jets in the forward region
against jets in central regions. Photon+jet as well as Z +jet events are used to calibrate central jets and
multijet events are used to calibrate high p
Tjets. These measurements are then combined. Jets are
accepted if they fulfil p
T> 25 GeV and |η| < 2 . 5 after energy calibration [63]. To reduce the contribution
from jets associated with pile-up, jets having p
T< 50 GeV and |η| < 2 . 4 must satisfy a | JVF | > 0 . 5 requirement [64] for the jet vertex fraction2. To prevent double-counting of electrons as jets, the closest jet within ∆R < 0 . 2 of a selected electron is discarded. If the nearest jet surviving the selection described above is within ∆R < 0 . 4 of the electron, the electron is discarded.
The purity of the selected sample is improved by tagging jets containing b -hadrons based on their large mass and decay time. The MV1 algorithm [66] based on multivariate techniques is utilised to identify jets originating from the hadronisation of a b -quark. The chosen working point corresponds to an efficiency of 70% to correctly identify a b -quark jet in simulated t¯ t events, with a light jet rejection factor of around 130 and a c -jet rejection factor of 5. The tagging efficiencies in simulation are corrected to match the results of the calibrations which are performed using data [67, 68].
The E
missT
serves as a measure of the transverse momentum assigned to a neutrino which originates from the leptonically decaying W -boson. It is calculated using all reconstructed and calibrated particles (electrons, muons, photons) and jets. Contributions from the calorimeter clusters and the inner detector tracks from the hard-scatter primary vertex, both not associated with any of these particles, are also taken into account [69].
4.2 Event Selection
Events are required to have at least one reconstructed vertex with at least four associated tracks with p
T> 400 MeV. If more than one vertex fulfils this criterion, the one with the largest sum of squared transverse momenta from its associated tracks is defined to be the primary vertex. If at least one of the jets having p
T> 20 GeV is identified as out-of-time activity from a previous pp collision or as calorimeter noise, the corresponding event is not considered [70].
According to the signature of the t¯ t signal in the lepton+jets decay channel, events are required to have exactly one reconstructed electron or muon and at least four jets, at least one of which is required to be b -tagged. This selection includes W -boson decays into a τ -lepton if the τ decays leptonically. Events are required to pass a single-lepton trigger, either electron or muon.
Events with exactly one b -tagged jet need to have E
missT
> 20 GeV and E
missT
+ m
WT
> 60 GeV, where m
WT
is the transverse mass of the leptonic W -boson defined as m
WT
= q
2 p
`,TE
missT
( 1 − cos ∆ φ(`, E
missT
)) . These requirements suppress the background due to misidentified leptons. As this background becomes very small in high b -tag multiplicity regions, these requirements are not applied for events with at least two b -tagged jets. Selected events are reconstructed under the t¯ t decay hypothesis using a likelihood-based method described in Section 4.3. The logarithm of the likelihood has to satisfy ln( L) > − 50 to suppress the combinatorial background due to wrongly reconstructed events and to decrease other backgrounds. It improves the sensitivity of the measurement by increasing the fraction of well reconstructed t¯ t events in the selected sample.
Events passing all selection criteria are separated into eight exclusive analysis regions. The fit is performed simultaneously in the electron+jets and the muon+jets region using events with exactly one and at least two b -tags. The input distributions are further split into two |η| regions, a central region with all four
2
The jet vertex faction (JVF) [65] is the ratio of the sum of the
pTof tracks associated with the jet and the primary vertex to
the sum of
pTof all tracks associated with the jet, while the
pTof the involved tracks needs to exceed 1 GeV. Hence, the cut
ensures that at least 50% of the sum of the
pTof tracks associated with the jet originates from tracks which are compatible
with originating from the primary vertex.
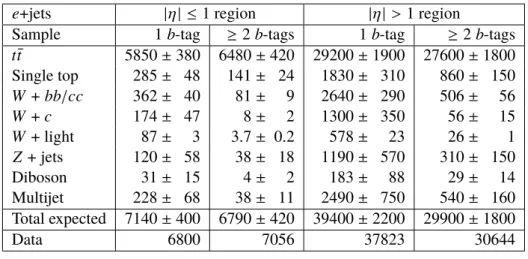
e +jets |η | ≤ 1 region | η| > 1 region
Sample 1 b -tag ≥ 2 b -tags 1 b -tag ≥ 2 b -tags
t t ¯ 5850 ± 380 6480 ± 420 29200 ± 1900 27600 ± 1800 Single top 285 ± 48 141 ± 24 1830 ± 310 860 ± 150 W + bb/cc 362 ± 40 81 ± 9 2640 ± 290 506 ± 56
W + c 174 ± 47 8 ± 2 1300 ± 350 56 ± 15
W + light 87 ± 3 3.7 ± 0.2 578 ± 23 26 ± 1
Z + jets 120 ± 58 38 ± 18 1190 ± 570 310 ± 150
Diboson 31 ± 15 4 ± 2 183 ± 88 29 ± 14
Multijet 228 ± 68 38 ± 11 2490 ± 750 540 ± 160
Total expected 7140 ± 400 6790 ± 420 39400 ± 2200 29900 ± 1800
Data 6800 7056 37823 30644
(a) Electron+jets channel.
µ +jets |η | ≤ 1 region | η| > 1 region
Sample 1 b -tag ≥ 2 b -tags 1 b -tag ≥ 2 b -tags
t t ¯ 7000 ± 450 7640 ± 490 35900 ± 2300 33500 ± 2200 Single top 369 ± 63 160 ± 27 2110 ± 360 980 ± 170 W + bb/cc 473 ± 52 117 ± 13 3450 ± 380 756 ± 83
W + c 223 ± 60 5 ± 1 1540 ± 420 63 ± 17
W + light 96 ± 4 1.8 ± 0.1 797 ± 32 40 ± 2
Z + jets 74 ± 36 16 ± 8 610 ± 290 159 ± 76
Diboson 37 ± 18 6 ± 3 198 ± 95 32 ± 15
Multijet 195 ± 59 34 ± 10 1870 ± 560 400 ± 120
Total expected 8470 ± 470 7980 ± 490 46400 ± 2500 36000 ± 2200
Data 8274 8193 46275 36471
(b) Muon+jets channel.
Table 1: Event yields after the event selection in the (a) electron+jets and (b) muon+jets channel for events with exactly one and at least two b -tags divided into events where all four jets associated with the t t ¯ decay have |η | ≤ 1 and events where at least one jet has |η | > 1. The uncertainties on the signal and background yields arising from normalisation uncertainties of each sample are shown. These correspond to the theory uncertainties as described in Section 5 for the background sources except for the W +jets and the fake lepton background. The uncertainty on these originate from the data-driven methods.
reconstructed jets having |η | ≤ 1 and a second one with at least one jet with |η | > 1. This approach takes advantage of the different sensitivity of these regions to detector resolution effects and pile-up contributions and different amount of background. The corresponding event yields are listed in Table 1.
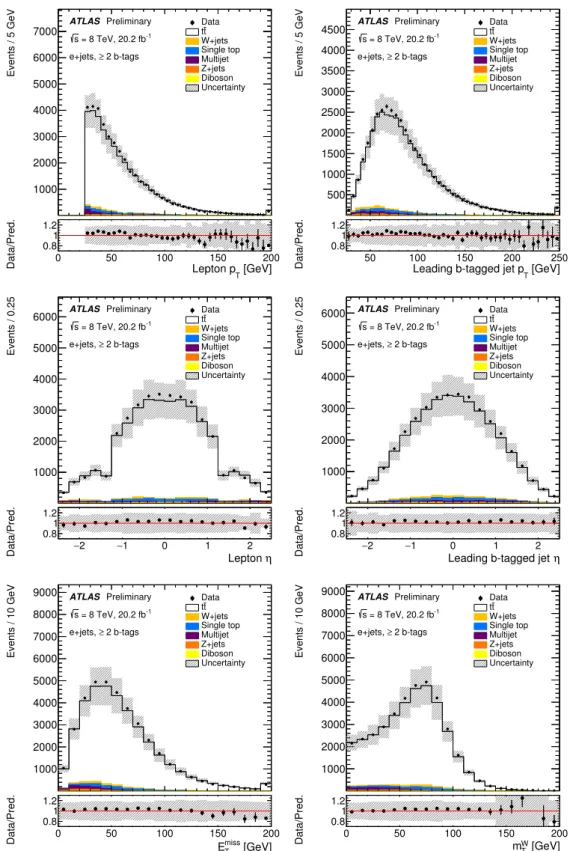
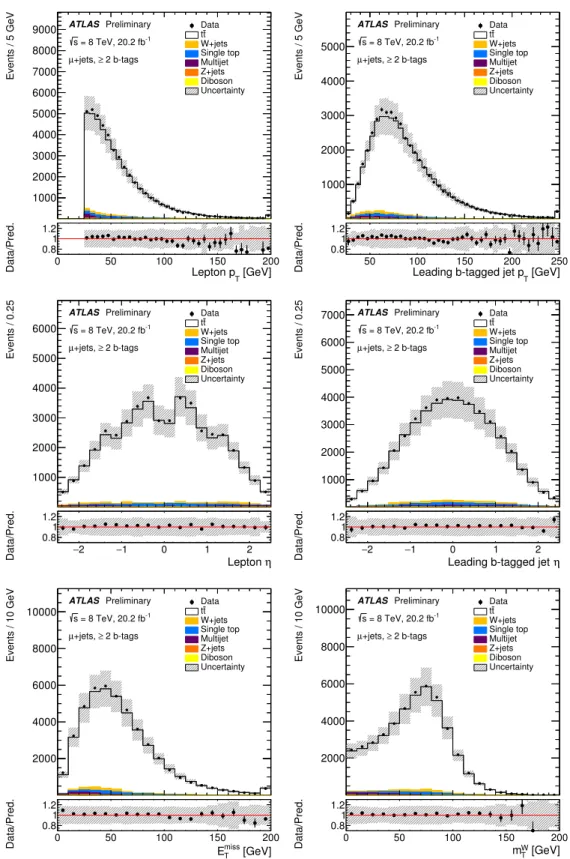
Figures 1 and 2 show the distributions of the lepton and leading b -tagged jet p
T, lepton and leading b -tagged jet η , E
missT
and m
WT
for events with at least two b -tagged jets in the electron and muon channel,
respectively. Good agreement within the assigned statistical and systematic uncertainties is observed
between data and the predictions from simulation.
0 50 100 150 200
Events / 5 GeV
1000 2000 3000 4000 5000 6000 7000
Data t t W+jets Single top Multijet Z+jets Diboson Uncertainty ATLAS Preliminary
2 b-tags e+jets, ≥
= 8 TeV, 20.2 fb-1
s
[GeV]
Lepton pT
0 50 100 150 200
Data/Pred.
0.81
1.2 50 100 150 200 250
Events / 5 GeV
500 1000 1500 2000 2500 3000 3500 4000
4500 Datatt
W+jets Single top Multijet Z+jets Diboson Uncertainty ATLAS Preliminary
2 b-tags e+jets, ≥
= 8 TeV, 20.2 fb-1
s
[GeV]
Leading b-tagged jet pT
50 100 150 200 250
Data/Pred.
0.81 1.2
2
− −1 0 1 2
Events / 0.25
1000 2000 3000 4000 5000
6000 Datatt
W+jets Single top Multijet Z+jets Diboson Uncertainty ATLAS Preliminary
2 b-tags e+jets, ≥
= 8 TeV, 20.2 fb-1
s
Lepton η 2
− −1 0 1 2
Data/Pred.
0.8 1
1.2 −2 −1 0 1 2
Events / 0.25
1000 2000 3000 4000 5000
6000 Datatt
W+jets Single top Multijet Z+jets Diboson Uncertainty ATLAS Preliminary
2 b-tags e+jets, ≥
= 8 TeV, 20.2 fb-1
s
Leading b-tagged jet η 2
− −1 0 1 2
Data/Pred.
0.8 1 1.2
0 50 100 150 200
Events / 10 GeV
1000 2000 3000 4000 5000 6000 7000 8000
9000 Data
t t W+jets Single top Multijet Z+jets Diboson Uncertainty ATLAS Preliminary
2 b-tags e+jets, ≥
= 8 TeV, 20.2 fb-1
s
[GeV]
miss
ET
0 50 100 150 200
Data/Pred.
0.81
1.2 0 50 100 150 200
Events / 10 GeV
1000 2000 3000 4000 5000 6000 7000 8000
9000 Data
t t W+jets Single top Multijet Z+jets Diboson Uncertainty ATLAS Preliminary
2 b-tags e+jets, ≥
= 8 TeV, 20.2 fb-1
s
[GeV]
W
mT
0 50 100 150 200
Data/Pred.
0.81 1.2
Figure 1: Distributions of the lepton and leading b -tagged jet p
T, lepton and leading b -tagged jet η , E
missT
and m
WT
in the electron+jets channel for events with at least two b -tagged jets after event selection. The hashed bands show the normalisation uncertainty on the signal and background contributions and the signal model systematic uncertainties.
The first and last bin contain underflow and overflow events, respectively.
0 50 100 150 200
Events / 5 GeV
1000 2000 3000 4000 5000 6000 7000 8000
9000 Datatt
W+jets Single top Multijet Z+jets Diboson Uncertainty ATLAS Preliminary
2 b-tags +jets, ≥ µ
= 8 TeV, 20.2 fb-1
s
[GeV]
Lepton pT
0 50 100 150 200
Data/Pred.
0.81
1.2 50 100 150 200 250
Events / 5 GeV
1000 2000 3000 4000 5000
Data t t W+jets Single top Multijet Z+jets Diboson Uncertainty ATLAS Preliminary
2 b-tags +jets, ≥ µ
= 8 TeV, 20.2 fb-1
s
[GeV]
Leading b-tagged jet pT
50 100 150 200 250
Data/Pred.
0.81 1.2
2
− −1 0 1 2
Events / 0.25
1000 2000 3000 4000 5000 6000
Data t t W+jets Single top Multijet Z+jets Diboson Uncertainty ATLAS Preliminary
2 b-tags +jets, ≥ µ
= 8 TeV, 20.2 fb-1
s
Lepton η 2
− −1 0 1 2
Data/Pred.
0.8 1
1.2 −2 −1 0 1 2
Events / 0.25
1000 2000 3000 4000 5000 6000
7000 Data
t t W+jets Single top Multijet Z+jets Diboson Uncertainty ATLAS Preliminary
2 b-tags +jets, ≥ µ
= 8 TeV, 20.2 fb-1
s
Leading b-tagged jet η 2
− −1 0 1 2
Data/Pred.
0.8 1 1.2
0 50 100 150 200
Events / 10 GeV
2000 4000 6000 8000 10000
Data t t W+jets Single top Multijet Z+jets Diboson Uncertainty ATLAS Preliminary
2 b-tags +jets, ≥ µ
= 8 TeV, 20.2 fb-1
s
[GeV]
miss
ET
0 50 100 150 200
Data/Pred.
0.81
1.2 0 50 100 150 200
Events / 10 GeV
2000 4000 6000 8000
10000 Datatt
W+jets Single top Multijet Z+jets Diboson Uncertainty ATLAS Preliminary
2 b-tags +jets, ≥ µ
= 8 TeV, 20.2 fb-1
s
[GeV]
W
mT
0 50 100 150 200
Data/Pred.
0.81 1.2
Figure 2: Distributions of the lepton and leading b -tagged jet p
T, lepton and leading b -tagged jet η , E
missT
and m
WT
in the muon+jets channel for events with at least two b -tagged jets after event selection. The hashed bands show the normalisation uncertainty on the signal and background contributions and the signal model systematic uncertainties.
The first and last bin contain underflow and overflow events, respectively.
4.3 Reconstruction of the t t ¯ decay
Correct assignment of reconstructed jets to partons originating from a t t ¯ decay is crucial for this meas- urement. This is achieved using a likelihood-based method (Kinematic Likelihood Fitter, KLFitter [71]) which makes use of the Bayesian Analysis Toolkit [72]. KLFitter maps the four partons of the t t ¯ decay to four reconstructed jets using mass constraints on the top-quark mass m
tand the W -boson mass m
W. In this analysis the four jets with the highest p
Tare used as input to KLFitter. A likelihood L is maximised for all resulting 24 permutations. For each permutation the likelihood is defined as
L = BW (m
q1q2q3|m
t, Γ
t) · BW (m
q1q2|m
W, Γ
W) · BW (m
q4`ν|m
t, Γ
t) · BW (m
`ν|m
W, Γ
W)
· Y
4i=1
W (E
imeas| E
i) · W ( E
`meas|E
`) · W (E
missx|p
νx) · W (E
ymiss| p
νy) . (1)
The W (E
measP| E
P) are transfer functions, where E
measPis the measured energy of an object P , E
Pis the energy of the original parton or lepton P , and p
νxand p
νyare the momentum components of the neutrino ν in the transverse plane. These momentum components as well as the energies E
Pare free parameters of the likelihood maximisation. Transfer functions for electrons, muons, b -jets, light jets (including c -jets) and E
missT
are used. They are derived from simulated t¯ t events using MC@NLO [30, 31]. The decay products of the t¯ t pair are uniquely matched to reconstructed objects to obtain a continuous function which describes the relative energy difference between a parton and a reconstructed object as a function of the parton energy. Parameterisations are derived for different |η | regions. The BW (m
i j(k)|m
t/W, Γ
t/W) terms represent Breit-Wigner functions which stand for the probability distribution of the reconstructed W -boson or top-quark mass given the assumed mass m
t/Wand a decay width Γ
t/W. Indices q 1- q 4 refer to the four quarks mapped to the reconstructed jets.
To exploit the presence of two b -quarks in a t¯ t decay, kinematic information is complemented by b - tagging. To take it into account the likelihood definition of Equation (1) is extended and turned into an event probability which, for a given permutation i , is expressed as
P
i= L
iQ
j
p
i,jP
k
L
kQ
j
p
k,j.
The p
i,jcontain the b -tagging efficiency or the rejection factor corresponding to the b -tagging working point, depending on whether a jet j is b -tagged or not. This factor is calculated for all jets j and multiplied by the likelihood L
i. KLFitter calculates the latter quantity for each permutation in the event according to Equation (1). The classification of a jet as a b -jet or a lighter jet is based on this calculation. The permutation with the largest event probability is chosen as the best jet-to-parton association. In this analysis the mass parameters are set to m
t= 172 . 5 GeV and m
W= 80 . 4 GeV and the decay width parameters are fixed to Γ
W= 2 . 1 GeV and Γ
t= 1 . 33 GeV. The analysis uses KLFitter only to choose the best assignment of jets to partons and does not exploit the fitted four vectors for the reconstructed particles. A variation of the Γ
tparameter used in KLFitter was proven to have no impact on the reconstructed distributions and thus the extracted measurement for Γ
t.
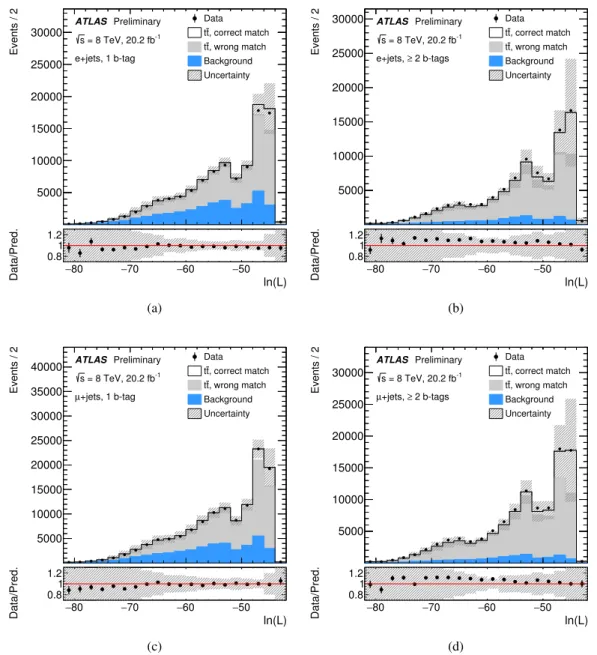
Figure 3 shows distributions of the logarithm of the likelihood for different analysis regions. The events
with ln ( L) < − 50 form a smaller second peak containing mainly events where the correct permutation
is not found. Thus, a requirement of ln (L) > − 50 removes a significant fraction of the combinatorial background. The fraction of events where all four partons are matched correctly increases from 17% to 31% after applying this requirement. This selection also improves the purity of the sample by removing more background events than t t ¯ signal.
−80 −70 −60 −50
Events / 2
5000 10000 15000 20000 25000 30000
Data , correct match t
t
, wrong match t
t Background Uncertainty ATLAS Preliminary
e+jets, 1 b-tag = 8 TeV, 20.2 fb-1
s
ln(L)
−80 −70 −60 −50
Data/Pred.
0.8 1 1.2
(a)
−80 −70 −60 −50
Events / 2
5000 10000 15000 20000 25000
30000 Data
, correct match t
t
, wrong match t
t Background Uncertainty ATLAS Preliminary
2 b-tags e+jets, ≥
= 8 TeV, 20.2 fb-1
s
ln(L)
−80 −70 −60 −50
Data/Pred.
0.8 1 1.2
(b)
80
− −70 −60 −50
Events / 2
5000 10000 15000 20000 25000 30000 35000
40000 Datatt, correct match , wrong match t
t Background Uncertainty ATLAS Preliminary
+jets, 1 b-tag µ
= 8 TeV, 20.2 fb-1
s
ln(L)
−80 −70 −60 −50
Data/Pred.
0.8 1 1.2
(c)
80
− −70 −60 −50
Events / 2
5000 10000 15000 20000 25000 30000
Data , correct match t
t
, wrong match t
t Background Uncertainty ATLAS Preliminary
2 b-tags +jets, ≥ µ
= 8 TeV, 20.2 fb-1
s
ln(L) 80
− −70 −60 −50
Data/Pred.
0.8 1 1.2
(d)
Figure 3: Distributions of the logarithm of the likelihood obtained from the event reconstruction algorithm for
the selected electron+jets (a,b) and muon+jets (c,d) events with exactly one (a,c) and at least two (b,d) b -tagged
jets. The events with ln (L) < − 50 form a secondary broader peak containing mainly events which are not properly
reconstructed, i.e. events for which not all four jets are correctly matched to partons (“wrong match”). Fully matched
events are mainly present in the larger ln (L) regions. The hashed bands show the normalisation uncertainty in the
signal and background contributions and the signal model systematic uncertainties. The first and last bin contain
underflow and overflow events, respectively.
5 Template Fit
The decay width of the top quark is measured using a simultaneous template fit to distributions of two observables associated with the hadronic and semileptonic decay branches of t¯ t events in the eight exclusive analysis regions. The observables are m
`b, which is the reconstructed invariant mass of the b -jet of the semileptonically decaying top quark and the corresponding lepton, and ∆R
min( j
b, j
l) which is the angular distance between the b -jet j
band the closest light jet j
l, both originating from the hadronically decaying top quark. The m
`bhas been chosen due to its good sensitivity to Γ
twhile being less sensitive to jet-related uncertainties compared to reconstructed masses of the hadronic decay branch. Despite the much lower sensitivity of ∆R
min( j
b, j
l) to Γ
t, it is beneficial to use it in the fit because it adds information from the hadronic top-quark decay branch and reduces leading jet-related and signal model systematic uncertainties in the combination with m
`b. Several other observables defined using the invariant mass of or angles between the t t ¯ decay products have been tested, but found to be less suitable because of larger jet-related or signal model uncertainties.
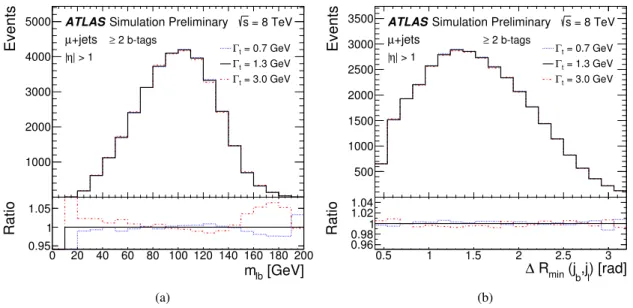
Signal templates are generated by reweighting events at parton-level to Breit-Wigner distributions with alternative top-quark decay-width hypotheses. A total of 54 templates for different values of Γ
tare created:
50 templates cover the range 0 . 1 < Γ
t< 5 . 0 GeV in steps of ∆Γ = 0 . 1 GeV. Four additional templates are created for Γ
t= 0 . 01 , 6 , 7 , 8 GeV to take into account very small and very large width values. The top-quark decay width in the nominal MC signal sample is Γ
t= 1 . 33 GeV corresponding to the NLO calculation. The reweighting method has been validated using a signal MC sample based on Γ
t= 3 . 0 GeV by comparing top-quark mass distributions of the latter sample with top-quark mass distributions obtained from the reweighting procedure at parton level and no significant differences were observed. The impact on the template distributions by varying the decay width in the range of 0.7 to 3.0 GeV is shown in Figure 4.
The binned likelihood fit to data uses these signal templates for the t¯ t contribution. Templates for all other processes, including single-top-quark production, are fixed. The effect on the result of using a fixed width in the single-top quark template was found to be negligible.
The total number of expected events per analysis region and per bin i is given by
n
exp,i= n
signal,i+ X
Bj=1
n
bkg,ji,
where the index j runs over all backgrounds. The likelihood for an observable O is defined as follows:
L (O |Γ
t) =
Nbins
Y
i=1
Poisson(O |n
data,i, n
exp,i, Γ
t) · Y
Bj=1
√ 1
2 πσ
bkg,jexp * ,
−(n
bkg,j− n ˆ
bkg,j)
22 σ
2bkg,j
+ -
, (2)
where N
binsis the number of bins in a template and n
data,iis the number of data events in each bin i .
The expected number of events from a background source j , n
bkg,j, is obtained from n
bkg,jiby summing
over all bins i . The number of background events varies in the fit but it is constrained by Gaussian terms
where ˆ n
bkg,jis the expected background normalisation for source j and σ
bkg,jis its uncertainty. The
normalisation of the signal template is a free parameter of the fit.
Events
1000 2000 3000 4000 5000
+jets µ
ATLASSimulation Preliminary 2 b-tags
≥
| > 1
|η Γt = 0.7 GeV
= 1.3 GeV Γt
= 3.0 GeV Γt
= 8 TeV s
[GeV]
m
lb0 20 40 60 80 100 120 140 160 180 200
Ratio
0.95 1 1.05
(a)
Events
500 1000 1500 2000 2500 3000 3500
+jets µ
ATLASSimulation Preliminary 2 b-tags
≥
| > 1
|η Γt = 0.7 GeV
= 1.3 GeV Γt
= 3.0 GeV Γt
= 8 TeV s
) [rad]
,j
l(j
bR
min∆
0.5 1 1.5 2 2.5 3
Ratio
0.960.981 1.021.04
(b)
Figure 4: Templates for (a) the reconstructed invariant mass of the b -jet of the semileptonically decaying top quark and the corresponding lepton, m
`b, and (b) ∆R
min( j
b, j
l) , the angular distance between the b -jet j
bassociated to the hadronic top quark and the closest light jet j
lfrom the hadronically decaying W -boson, in the range 0 . 7 < Γ
t< 3 . 0 GeV in the muon+jets channel for events with at least 2 b -tags in the |η| > 1 region. The lower panel shows the ratio of the templates with varied Γ
tto the nominal template generated for a decay width of Γ
t= 1 . 33 GeV.
The uncertainties used as constraints in Equation (2) on the W +jets background components normalisation originating from data-driven calibration (see Section 3) amount to 7% for W + b b ¯ and W + c c ¯ , 25% for W + c , and 5% for W +light jets events. The uncertainty on the multijet background is taken from the matrix method and amounts to 30%. For the Z +jets and diboson events, a 4% theory uncertainty on the inclusive cross-section is applied together with a 24% uncertainty per additional jet added in quadrature, which covers the extrapolation to higher jet multiplicities based on MC studies, resulting in an uncertainty of 48% for events with four jets. The uncertainty on single-top-quark production amounts to 17% and considers the variation of initial and final state radiation in the t -channel MC samples and accounts for extra jets in single-top-quark events. All the fit parameters n
jare common across all b -tag bins, lepton channels and |η| regions except for the multijet background. For the latter, separate parameters are defined for each analysis region.
The fit is performed for 55 templates (54 obtained from the reweighting algorithm and the nominal
one). The combined likelihood, defined as the product of two Poisson terms as given in Equation (2),
one for each observable, multiplied by the Gaussian constraints, is maximised for every value of Γ
t.
The measured top-quark decay width is extracted from the minimum of a quadratic fit to the negative
logarithm of the likelihood values and the statistical uncertainty of Γ
tis derived from the likelihood curve
width at − 2 ∆ ln(L ) = 1 around the minimum. The fit method is validated using pseudo-experiments,
and the correlation between the two observables is examined. In each pseudo-experiment, the content
of the bins of the m
`band ∆R
min( j
b, j
l) distributions are varied according to the Poisson and Gaussian
distributions to take into account the number of expected events per bin and the background constraints,
respectively. These pseudo-experiments are used for a linearity test and to produce pull distributions. The
pull is defined as the difference between the fitted value Γ
tand the input value divided by the estimated
uncertainty of the fit result. No deviations from the expectation are found for various decay width values within 1 . 1 < Γ
t< 4 . 0 GeV. For smaller decay width values the pull width decreases since the decay width distribution approaches a limit of 0 GeV. However, this does not bias the result and the fit method is stable and unbiased. Additional pseudo-experiments revealed that the small correlation between m
`band ∆R
min( j
b, j
l) of about 0.1-2.8% does not affect the fit result. The observables are thus treated as independent.
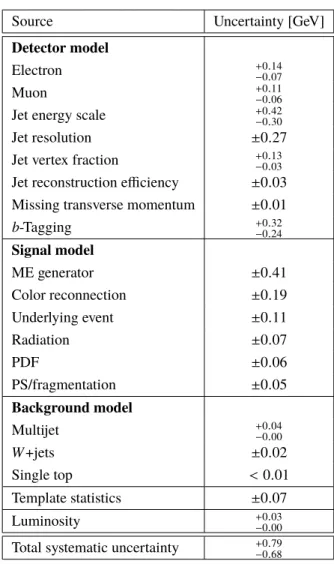
6 Systematic Uncertainties
Systematic uncertainties affect the normalisation of signal and background and the shape of the distribu- tions sensitive to the top-quark decay width. Individual sources of systematic uncertainties are considered uncorrelated and are summed in quadrature to determine the total uncertainty. Correlations of systematic uncertainties are fully maintained for all analysis regions. Pseudo-experiments are used to estimate the impact of the different sources of uncertainty according to the following procedure. For each source of systematic uncertainty templates which correspond to the respective up and down variation are created for all decay width templates. These variations consider shape and acceptance changes of the systematic source under study. Pseudo-data sets are generated by applying Poisson fluctuations and Gaussian con- straints on the background contributions to each bin, as described in Section 5. Then the nominal and varied templates are used to perform a fit to the same pseudo-data. For each systematic variation 2,000 of these pseudo-experiments have been performed, and the differences between the means of the fitted values distribution using the nominal template and the up and down variations are quoted as the systematic uncertainty from this source. The systematic uncertainties in the measurement of the top-quark decay width are summarised in Table 2.
6.1 Uncertainties in Detector Modelling
The systematic uncertainties arising from charged leptons are classified into several categories, related to the reconstruction and trigger efficiency, the identification and the lepton momentum scale and resolution.
This leads to five (six) components of uncertainties associated with the electron [54] (muon [55]).
Jet-related uncertainties arise from the jet reconstruction efficiency, the jet vertex fraction requirement, the jet energy resolution (JER) and the jet energy scale. The JES and its uncertainties have been derived by combining information from test-beam data, LHC collision data and simulation [62, 63]. The JES calibration is described in Section 3. The jet energy scale uncertainty is split into 26 p
Tand η -dependent sources, treated independently. It is the largest of the detector modelling uncertainties in this analysis.
The JER has been measured separately for data and simulation using two in situ techniques [63], improved by additional in situ measurements using dijet, photon+jet or Z +jet processes. For low- p
Tjets, a significant contribution to the JER uncertainty comes from pile-up, measured as in Ref. [62]. The JER uncertainty consists of eleven components and represents an important uncertainty in this measurement.
The per-jet efficiency to pass the JVF selection is measured in Z (→ `
+`
−) +1-jet events in data and
simulation [73]. Motivated by this study, the uncertainty is evaluated by changing the JVF cut value,
increasing and decreasing it by 0.1, and repeating the analysis using this modified value.
Energy scale and resolution correction uncertainties of both leptons and jets are propagated into the calculation of E
missT
. Contributions of calorimeter cells not associated to any jet and associated with soft jets (7 GeV < p
T< 20 GeV) constitute additional uncertainties. A further E
missT
scale uncertainty arises from the uncertainty on additional energy deposits due to pile-up.
The jet flavour-dependent efficiencies of b -tagging algorithms are calibrated using data. The b -tagging efficiency is corrected to match the efficiency measured in the t¯ t data events using the probability density function calibration method [67, 68] based on a combinatorical likelihood applied to a data sample of dileptonic t¯ t events. The mis-tag rate for c -jets is measured using D
∗mesons, the one for light jets is measured based on jets with impact parameters and secondary vertices consistent with a negative lifetime [66, 68]. Efficiencies for b - and c -jets are corrected in simulations by p
T-dependent scale factors (SF). For light jets, these scale factors also depend on the pseudorapidity. Six independent sources of uncertainty affecting the b -tagging efficiency and four affecting the c -tagging efficiency are considered [67].
Twelve uncertainties are considered for the mistagging of light-quark jets which depend on jet p
Tand η [68].
6.2 Uncertainties in Background Modelling
The uncertainties in the background normalisation are included as Gaussian constraints in the fit (see Equation (2)) and thus enter the statistical uncertainty.
To evaluate the uncertainty in the shape modelling of the W +jets background, each of its flavour com- ponents ( W + b b/c ¯ c ¯ , W + c and W +light) is allowed to vary independently in the fit within its uncertainty, corresponding to the uncertainty on the calibration factors. The shape uncertainty of the W +jets contribu- tion is retrieved by varying one component while fixing the other two to their respective normalisations, as given in Section 3.
Two simulated samples are compared to estimate the modelling uncertainty of single-top events. The baseline MC generator for W t production uses the diagram removal technique [74] to account for the overlap with t¯ t events. This sample is compared to a sample generated with the inclusive diagram subtraction technique [74]. The total difference is then symmetrised, i.e. the difference of the two-point comparison is taken as the uncertainty on both sides of the nominal result.
For the multijet background an uncertainty on the total yield of ± 30% is considered. Furthermore, two shape uncertainties are defined by varying the control samples used to obtain the efficiencies used in the matrix method to relate the two identification levels for objects considered as fake or non-prompt and prompt leptons, respectively.
The background yields estimated from MC are affected by the luminosity uncertainty of 1.9% [19], which is propagated to the constraints on the background yields.
6.3 Uncertainties in Signal Modelling
Several uncertainties affect the shape of the t¯ t signal contributions. The uncertainties due to initial
and final state radiation are determined using two dedicated Powheg+Pythia samples (see Section 3)
producing more or less radiation based on varied parameter values. Pseudo-data is created using each
sample, and the largest variation of the top-quark width from the nominal is taken as an uncertainty and
then symmetrised.
The Powheg MC generator interfaced to Pythia is compared to Powheg interfaced with Herwig to estimate the uncertainty on parton shower and the hadronisation model. To evaluate the uncertainty due to the choice of the t¯ t generator, the full difference between Powheg and MC@NLO generators, both interfaced with Herwig, is evaluated. This is the largest signal modelling uncertainty in this measurement. The uncertainty of the colour reconnection modelling is estimated using the nominal t¯ t sample which is compared to a Powheg sample interfaced with Pythia with a special colour reconnection tune. The uncertainty on the underlying event modelling is determined by comparing the nominal t¯ t sample with a Powheg sample interfaced with Pythia employing a special multiparton interaction tune.
The uncertainties due to these four sources are taken as a difference between the nominal and the varied sample and symmetrised.
Following the PDF4LHC [75] recommendations, three different PDF sets are compared using a reweighting technique for the signal t¯ t MC sample to estimate the uncertainty due to the PDF set choice: CT10 NLO (nominal PDF set) [24], MSTW 2008 68% CL NLO [49] and NNPDF 2.3 NLO [76]. Each PDF set uses a different prescription to evaluate the uncertainty based on its error sets: the CT10 set uses a symmetric Hessian, the MSTW set uses an asymmetric Hessian and the NNPDF set uses a standard deviation for uncertainty calculation. Half of the width of the largest deviation from nominal among all three variations is taken as the PDF uncertainty.
6.4 NLO and off-shell effects in the Top-Quark Decay
The t¯ t MC simulation utilised to extract the decay width uses NLO matrix elements for top-quark pair production and LO matrix elements with approximate implementation of finite width and interference effects for the decay of the top quarks. A theoretical study [77] performed in the e µ decay channel of the t t ¯ system indicates that taking into account off-shell effects which include the contributions from t¯ t and W t single-top production as well as their interference is important for the precision measurements of top-quark properties. However, there is no MC implementation yet of NLO decay and off-shell effects for the lepton+jets final state. The potential effect of ignoring these effects has been tested in two different ways. First, the parton-level m
`bdistribution of a sum of t t ¯ and W t single-top contributions without these effects taken into account is reweighted to the m
`bdistribution provided by the authors of Ref. [77] which corresponds to the W W b b ¯ calculation at NLO. Second, the analysis is repeated requiring m
`b< 150 GeV, in the region where these effects are expected to be suppressed according to Ref. [77]. Both rough estimates yield a difference in the measured top-quark decay width of less than 0.5 GeV. For more precise future measurements it will be beneficial to have a MC simulation providing an NLO description of the top-quark decay accounting for off-shell effects.
6.5 Template Statistics
To estimate the systematic uncertainty arising from the limited MC sample size used to produce the
templates, the content of each bin of the signal and background templates is varied within its statistical
uncertainty and a fit to the nominal distribution is repeated. The standard deviation of the distribution of
top-quark decay width values obtained from the fits with the fluctuated templates is quoted as systematic
uncertainty from the template statistics.
Source Uncertainty [GeV]
Detector model
Electron
+0.14−0.07Muon
+0.11−0.06Jet energy scale
+0−0..4230Jet resolution ± 0 . 27
Jet vertex fraction
+0−0..1303Jet reconstruction efficiency ± 0 . 03 Missing transverse momentum ± 0 . 01
b -Tagging
+0.32−0.24Signal model
ME generator ± 0 . 41
Color reconnection ± 0 . 19
Underlying event ± 0 . 11
Radiation ± 0 . 07
PDF ± 0 . 06
PS/fragmentation ± 0 . 05
Background model
Multijet
+0−0..0400W +jets ± 0 . 02
Single top < 0 . 01
Template statistics ± 0 . 07
Luminosity
+0−0..0300Total systematic uncertainty
+0.79−0.68Table 2: Summary of systematic uncertainties in the top-quark decay width measurement.
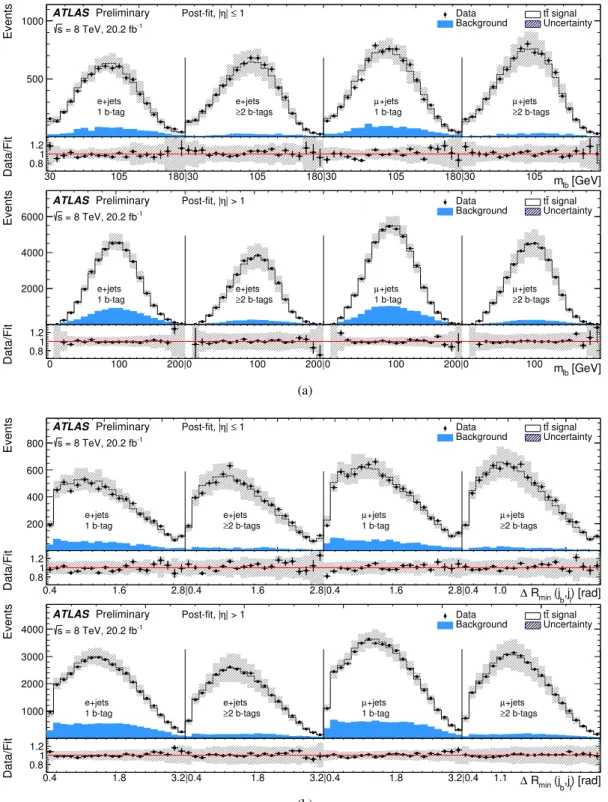
7 Result
The binned likelihood template fit is applied to the data using the concatenated distributions of m
`band
∆R
min( j
b, j
l) in the eight analysis regions. Figure 5 shows post-fit distributions for m
`band ∆R
min( j
b, j
l) . The post-fit yields of the t¯ t signal and each background contribution are summarised in Table 3.
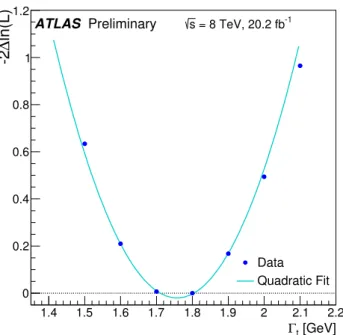
The likelihood curve obtained from the fit can be seen in Figure 6 together with a quadratic fit to the likelihood points. The statistical uncertainty which includes contributions from a limited data statistics and the uncertainties in the backgrounds normalisation is extracted from the likelihood curve width at
− 2 ∆ ln(L ) = 1 around the minimum.
The measured decay width for a top-quark mass of 172.5 GeV is
Γ
t= 1 . 76 ± 0 . 33 ( stat. )
+0− .790.68
( syst. ) GeV = 1 . 76
+0−0..8676GeV ,
Events
500
1000 DataBackground tUncertaintyt signal
ATLAS Preliminary = 8 TeV, 20.2 fb-1
s
1
| ≤ Post-fit, |η
e+jets 1 b-tag
e+jets 2 b-tags
≥
+jets µ 1 b-tag
+jets µ
2 b-tags
≥
[GeV]
mlb
30 105 180|30 105 180|30 105 180|30 105
Data/Fit 0.8
1.21
Events
2000 4000 6000
Data tt signal
Background Uncertainty ATLAS Preliminary
= 8 TeV, 20.2 fb-1
s
| > 1 Post-fit, |η
e+jets 1 b-tag
e+jets 2 b-tags
≥
+jets µ 1 b-tag
+jets µ
2 b-tags
≥
[GeV]
mlb
0 100 200|0 100 200|0 100 200|0 100
Data/Fit 0.8
1.21
(a)
Events
200 400 600 800
Data tt signal
Background Uncertainty ATLAS Preliminary
= 8 TeV, 20.2 fb-1
s
1
| ≤ Post-fit, |η
e+jets 1 b-tag
e+jets 2 b-tags
≥
+jets µ 1 b-tag
+jets µ
2 b-tags
≥
) [rad]
,jl
(jb
Rmin
0.4 1.6 2.8|0.4 1.6 2.8|0.4 1.6 2.8|0.4 1.0 ∆
Data/Fit 0.8
1 1.2
Events
1000 2000 3000 4000
Data tt signal
Background Uncertainty ATLAS Preliminary
= 8 TeV, 20.2 fb-1
s
| > 1 Post-fit, |η
e+jets 1 b-tag
e+jets 2 b-tags
≥
+jets µ 1 b-tag
+jets µ
2 b-tags
≥
) [rad]
,jl
(jb
Rmin
0.4 1.8 3.2|0.4 1.8 3.2|0.4 1.8 3.2|0.4 1.1 ∆
Data/Fit 0.8
1.21
(b)
Figure 5: Post-fit distributions based on the best-fit templates for (a) m
`band (b) ∆R
min( j
b, j
l) . The background
contributions are combined. The lower panel shows the ratio of data over post-fit t t ¯ signal and background. The eight
analysis regions corresponding to different b -tag multiplicity and jet pseudorapidity are shown. The vertical lines
show the boundaries between the binned variables in different lepton and b -tag regions. The hashed band shows
the total uncertainty. The systematic uncertainties are calculated bin-by-bin based on the systematic variations by
adding differences quadratically. Then, statistical and systematic uncertainties are added quadratically to obtain the
quoted total uncertainty.
Sample Post-fit yields
t t ¯ 156360 ± 750
Single top 5700 ± 930
W + bb/cc 7060 ± 510
W + c 1650 ± 550
W + light 1603 ± 65
Z + jets 2770 ± 710
Diboson 320 ± 240
Misid. lepton 6070 ± 380
Total 181600 ± 1700
Data 181536
Table 3: Post-fit yields of the t t ¯ signal and background contributions. The yields represent the sum of the number of events in each of the eight analysis regions. Only the normalisation uncertainties are shown.
[GeV]
Γt
1.4 1.5 1.6 1.7 1.8 1.9 2 2.1 2.2
ln(L) ∆ -2
0 0.2 0.4 0.6 0.8 1 1.2
Data Quadratic Fit ATLAS Preliminary s = 8 TeV, 20.2 fb-1