A TL-PHYS-PROC-2010-034 28 June 2010
IL NUOVO CIMENTO
Vol. ?, N. ??
Prospects for the measurement of the top-quark mass with early ATLAS data
G. Cortiana(
1) on behalf of the ATLAS Collaboration (
1)
Max-Planck-Institut fuer Physik - Munich, DESummary.
—
The prospects are presented for a top-quark mass,
mtop, measurement in the
t¯t→lepton+jets channel via the template method using early ATLAS data. Two variants of the template analysis are presented. A 1-dimensional template analysis which adopts the stabilized top-quark mass variable,
mstabtop, exploiting the event-by- event ratio of the reconstructed top-quark and
Wboson masses associated to the hadronically decaying top quark candidate, to minimize the impact of the jet energy scale, JES, uncertainty on
mtop. A 2-dimensional analysis which simultaneously ex- tracts
mtopand the JES from the data. The latter, making uses of
b-tagging, as well as of a kinematic fit of the decay products, offers a more precise determination of
mtop, while requiring a better understanding of the detector. The 1-d analysis is optimized for very first data with integrated luminosities,
Lint, up to 100 pb
−1; whereas the 2-d analysis is targeted at
Lintof 1 fb
−1, the total integrated luminosity currently expected from the ongoing 2010
−2011 LHC operations.
PACS
12.15.Ff– Quark and lepton masses and mixing.
PACS
14.65.Ha– Top quarks.
1. – Introduction
The top-quark mass is a fundamental parameter of the Standard Model, SM, of parti- cle physics. It gives large contributions to electroweak radiative corrections which, when connected to precision electroweak measurements, can be used to derive constraints on the masses of the yet-unobserved Higgs boson, and of particles predicted by some SM extensions. The top quark mass has been measured using various techniques, and multi- ple decay channels by the Tevatron experiments. The present m
topworld average value is 173.1 ± 1.3 GeV [1].
Top pair production will be copious at the LHC: the corresponding cross sections are enhanced by factors of about 20 or 125 with respect to the Tevatron collider, for pp collisions at √ s= 7 or 14 TeV respectively [2]. As a consequence, m
topresults from LHC will also be soon limited by systematics. For early measurements, the golden channel is t ¯ t → lepton+jets as it provides the best compromise of branching ratio and signal over
c Societ`a Italiana di Fisica
1
2 G. CORTIANA ON BEHALF OF THE ATLAS COLLABORATION
background ratio (S/B). In this channel the complete detector capability is explored: the events contain many jets (two of which originate from b-quarks), one high p
T, isolated charged lepton, and missing transverse energy, E
Tmiss, from the escaping neutrino.
In general m
topanalyses, relying on the reconstruction of the hadronic top decays, suffer from the limited experimental knowledge of the jet energy scale, JES. In view of this difficulty, ATLAS explored two complementary measurement paths either aimed at being as independent of the JES as possible, which may be poorly known at the beginning of the data taking, or at determining the JES together with m
top[3]. The first scenario is realized by a 1-d analysis based on the stabilized top-quark mass, m
stabtopdefined as:
m
stabtop=
mreco top
mrecoW
· m
W(with m
W= 80.4 GeV). The second, the 2-d analysis, simultaneously determines m
topand the JES, by combining m
recotopand m
recoWinformation from the data.
Both analyses utilize the template method to determine m
topfrom the measured top- quark mass distributions, and for the 2-d analysis by also exploiting the distribution of the measured invariant mass of the W boson. Signal templates are derived from the distributions of Monte Carlo t t ¯ events generated under different m
topassumptions in the range [160-190] GeV. For the 2-d analysis templates for different JES assumptions are also constructed. Background templates are derived in a similar way from the sum of all physics processes considered as background. Templates are parameterized by means of probability density functions, then used in an un-binned likelihood fit to the data, whose free parameters are the numbers of signal and background events, m
top(and the JES for the 2-d analysis). The method validation, as well as the linearity and sanity checks are performed using the pseudo-experiment technique.
2. – Selection of lepton+jets candidates and event reconstruction
In order to reduce the background contamination, different strategies are adopted for the 1-d and 2-d analyses. Starting from a common pre-selection requiring exactly one lepton (e, µ) with p
T> 20 GeV within the detector acceptance, E
Tmiss> 20 GeV, and at least 4 jets with p
T> 20 GeV, the 1-d analysis tightens the jet p
Trequirements (p
T> 75, 40, 40 GeV for the three highest p
Tjets), and imposes restrictions to the allowed range for m
recoW( ± 25 GeV from the observed peak position). On the other hand, the 2-d analysis increases the p
Tthresholds for all jets to 40 GeV, and requires the presence of at least two jets identified as originating from b-quarks. In the case of the 2-d analysis, jets are pre-calibrated using Monte Carlo based corrections to account for the light- to b-jet response differences. The expected signal yields, assuming SM cross sections at √ s=10 TeV, and L
int=100 pb
−1, for the 1-d analysis correspond to 615 ± 3 (734 ± 3) events in the electron (muon) channel, with a S/B of 1.3 (1.4). With the same assumptions, the 2-d analysis selection provides 120 ± 1 signal events in the combined (e+µ) channel, and a S/B of 8.0.
The event reconstruction is limited to the hadronic top quark in the case of the 1-d
analysis: jets belonging to the top candidate are chosen as the jet triplet whose 4-vector
sum yields the maximum p
T. Within this triplet, the W boson is reconstructed as the
pair of jets, in the top quark candidate rest-frame, closest in ∆R. The 2-d analysis, on
the other hand, performs jet associations based on the results of a kinematic fit to the t ¯ t
decay hypothesis. Inputs to the fit are the differences of the measured and fitted charged
lepton and jet energies; the differences of m
recoWand m
W, for the leptonic and hadronic W
boson candidates; the differences of the (q, q, b) and (ℓ, ν, b) invariant masses and m
recotop,
for the leptonic and hadronic top-quark candidates, all normalized to the corresponding
PROSPECTS FOR THE MEASUREMENT OF THE TOP-QUARK MASS WITH EARLY ATLAS DATA3
[GeV]
stab
mtop
100 200 300 400 500 600 700
Entries / 10 GeV
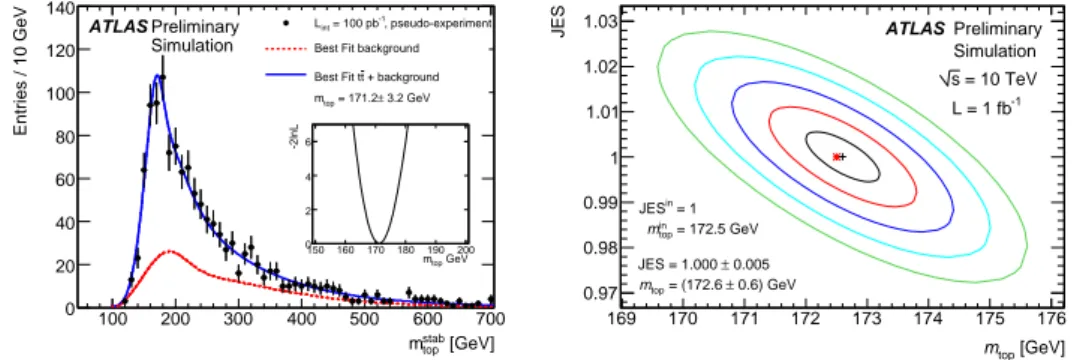
0 20 40 60 80 100 120 140
, pseudo-experiment = 100 pb-1
Lint Best Fit background
+ background t Best Fit t
3.2 GeV
± = 171.2 mtop
ATLAS Preliminary Simulation
top GeV 150 160 170 180m190 200
-2lnL
0 2 4 6
[GeV]
mtop
169 170 171 172 173 174 175 176
JES
0.97 0.98 0.99 1 1.01 1.02
1.03 ATLAS Preliminary
Simulation = 10 TeV s L = 1 fb-1
= 172.5 GeV
in
mtop
0.6) GeV
± = (172.6 mtop
in = 1 JES
0.005
± JES = 1.000