Investigations towards a Measurement of the Top-Quark Mass in dileptonic Decay Channels of
Top-Antitop Quark Pairs at ATLAS
Diploma Thesis
supervised by Prof. Dr. S. Bethke
Andreas Alexander Maier Physik-Department Technische Universit¨at M¨unchen
and
Max-Planck-Institut f¨ur Physik (Werner-Heisenberg-Institut)
Munich, December 3, 2012
Abstract
The mass of the top quark is a fundamental parameter of the Standard Model. The LHC at CERN serves as a top quark factory and by imposing strict quality criteria data samples with very high signal purity can be obtained. Due to the increased statistics measurements exploiting the dileptonic final state of the top quark pair decay can now contribute to a precision measurement of top quark mass. This thesis presents investigations towards a top quark mass measurement in top quark pair dileptonic final states at the ATLAS detector.
Dilepton events contain two charged leptons, two neutrinos and two jets originating from bottom quarks, i.e. tt → W bW b → `νb`νb. The presence of the undetectable neutrinos in the final state yields an under-constrained system of kinematic equations. Three methods to measure the top quark mass despite this limitation are investigated, namely the mlb Method, the mT2 Method and the νWT Method. The properties of the methods are investigated using Monte Carlo events simulated at next to leading order with the program MC@NLO. A first measurement of the top quark mass using 4.7 fb−1 of 2011 ATLAS data and an evaluation of the systematic uncertainties are presented.
Contents
1. Introduction 3
1.1. Standard Model of Particle Physics . . . . 3
1.2. Top Quark Physics . . . . 5
1.2.1. Top Quark Production and Decay . . . . 5
1.2.2. Motivation for Top Quark Physics . . . . 6
1.3. The Large Hadron Collider . . . . 7
1.4. The ATLAS Experiment . . . . 8
1.4.1. The Inner Detector . . . . 9
1.4.2. The Calorimeter System . . . . 10
1.4.3. The Muon System . . . . 10
1.4.4. Trigger and Data Processing . . . . 12
2. Event Selection Procedure and Background Estimation 13 2.1. The Signal Process . . . . 13
2.2. Background Processes . . . . 15
2.3. Selection Cuts and Event Yields . . . . 16
3. The Analysis Methods 23 3.1. Analysis Tools . . . . 24
3.1.1. The Template Method . . . . 24
3.1.2. The Pseudo-Experiment Technique . . . . 29
3.2. The mlb Method . . . . 33
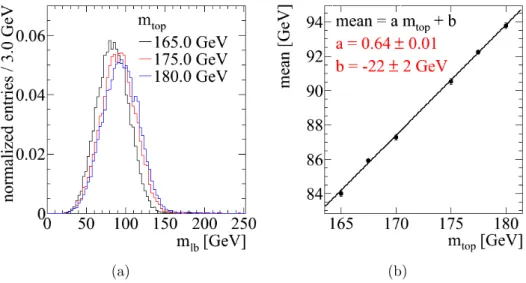
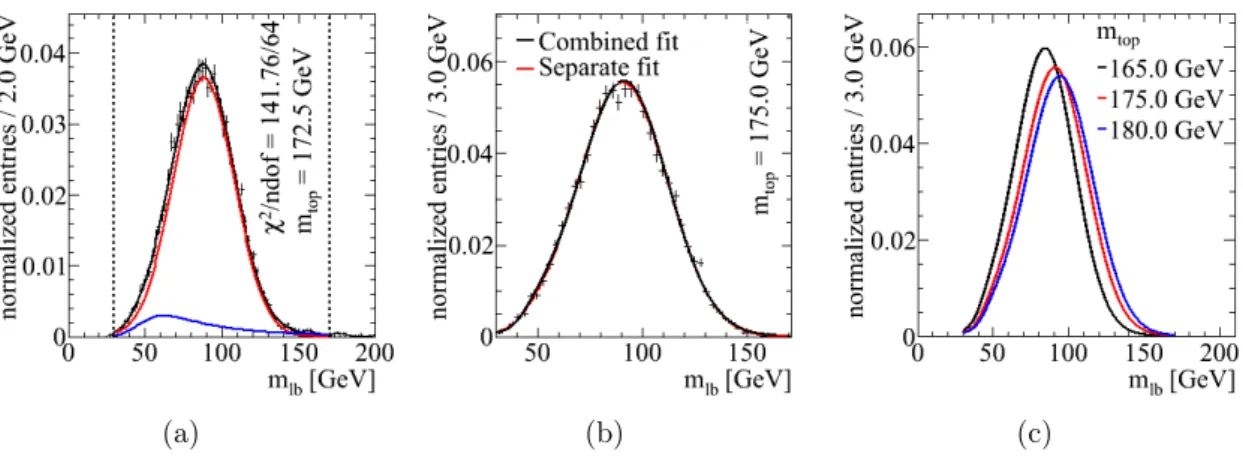
3.2.1. The mlb Estimator . . . . 33
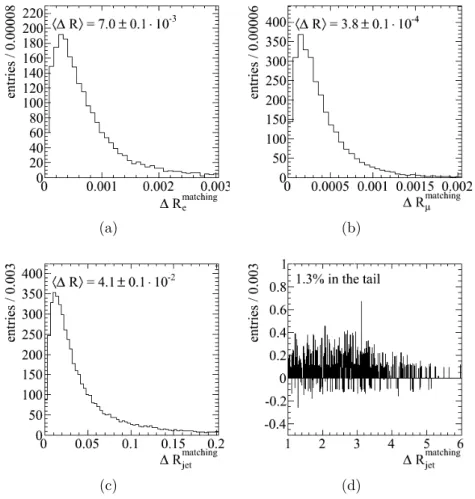
3.2.2. Jet to Parton Matching . . . . 33
3.2.3. Method Validation . . . . 37
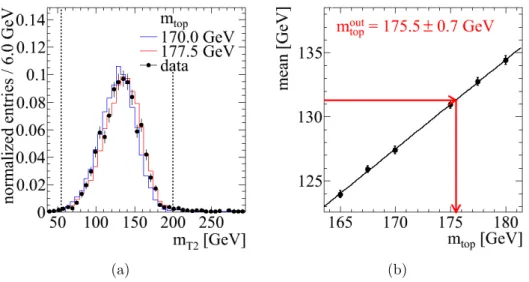
3.3. The mT2 Method . . . . 40
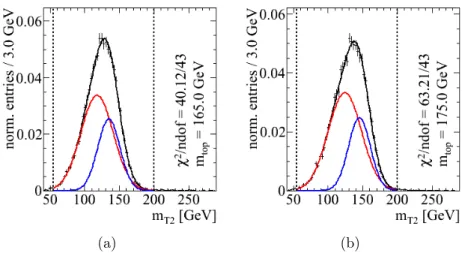
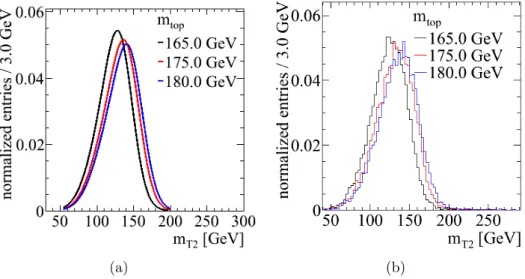
3.3.1. The mT2 Estimator . . . . 40
3.3.2. Method Validation . . . . 43
3.3.3. The W± boson mass . . . . 43
3.4. The Neutrino Weighting (νWT) Method . . . . 46
3.4.1. TheνWT Algorithm . . . . 46
3.4.2. Method Validation . . . . 50
3.5. Summary . . . . 51
4. Method Application and Stability 53 4.1. Application on 2011 ATLAS Data . . . . 53
4.2. Evaluation of Systematic Uncertainties . . . . 55
4.3. Investigations of the Method Stability . . . . 59
4.3.1. Stability of the template method . . . . 60
4.3.2. Stability of the mT2 Method . . . . 61
4.3.3. Stability of the νWT Method . . . . 61
4.4. Summary . . . . 63
5. A Measurement at Hadron Level 65 5.1. Motivation . . . . 65
5.1.1. The Top Quark Pole Mass Problem . . . . 65
5.1.2. Accessibility and Forward Compatibility . . . . 66
5.2. Technical Aspects . . . . 67
5.2.1. Object Definition . . . . 67
5.2.2. Selection Cuts . . . . 67
5.2.3. The Unfolding Procedure . . . . 68
5.3. A first Approach at LO using the mlb Estimator . . . . 69
5.4. Summary . . . . 71
6. Conclusions and Outlook 73 A. Monte Carlo and Data Samples 75 A.1. Monte Carlo Samples . . . . 75
A.2. Data Samples . . . . 77
B. Solution of the Kinematic Equations 79
List of Figures 81
List of Tables 83
Bibliography 85
Overview
In this thesis an approach to measure the top quark mass from dileptonic top quark pair decays at ATLAS is presented. Three methods to handle the under-constrained kinematics are applied.
The structure of the thesis is outlined below:
Chapter 1: Introduction
A short glance at the Standard Model is provided. This is followed by a brief review of top quark physics with emphasis on dileptonic top quark pair decays and an introduction to the LHC machine and the ATLAS detector.
Chapter 2: Event Selection Procedure and Background Estimation
The Monte Carlo simulations for signal and background contribution used for this analysis are presented and the applied selection cuts and quality criteria are explained. An estimation of the most relevant background sources is performed.
Chapter 3: The Analysis Methods
The peculiarities of the dilepton channel are discussed and the analysis techniques are introduced. The mlb Method, the mT2Method and the νWT Method are explained and their performance is investigated.
Chapter 4: Method Application and Stability
The methods are applied to data recorded by the ATLAS detector in the year 2011, corresponding to an integrated luminosity of 4.7 fb−1. The most relevant systematic uncertainties and the stability of the methods are investigated.
Chapter 5: A Measurement at Hadron Level
In view of improving precisions in top quark mass analyses an approach to clarify relevant sub-GeV effects is presented.
2
1. Introduction
1.1. Standard Model of Particle Physics
The Standard Model of particle physics describes the elementary constituents of matter via particle fields and their interactions, namely the strong, the weak and the electromagnetic interaction. As of today the Standard Model is in extremely good agreement with experimental data. However, there are some important shortcomings. The Standard Model does neither include particle masses nor gravity proposed by the theory of general relativity. Moreover does it not incorporate dark energy, dark matter or a mechanism for the observed matter anti-matter asymmetry. All those are signs of an effective theory - the fundamental theory still awaits discovery.
A short outline of the main aspects of the Standard Model will be presented in the following [1].
The Standard Model is a quantum field theory based on a SU(3)C×SU(2)L×U(1)Y gauge symmetry. The particles are called fermions and carry spin 1/2. They split up in leptons and quarks and can be grouped into three generations as shown in Figure 1.1. The quarks carry multiples of 1/3 of the elementary electrical chargeeand are subject to the electromagnetic, the weak and the strong interaction. The quark generations are filled with quarks of two different flavours each, which in the first are the up quark and the down quark with the electrical charges 2/3 and −1/3 respectively. The charm quark, strange quark, top quark and bottom quark represent the second and third quark generation. On the lepton side the first generation consists of the electron and its corresponding electrically neutral neutrino. The muon and the tauon together with their respective neutrinos build up the second and third lepton generation.
Leptons are subject to the electromagnetic and the weak but not the strong interaction. It is a remarkable feature that the entire matter as we know it is made of fermions of the first generation. Higher generation fermions are heavier, resulting in high energy requirements for their production as achieved e.g. in a particle collider. They decay rapidly to lower generation fermions. The transition probabilities between the different quark flavours, are listed in the empirically determined CKM matrix1.
The gauge symmetry structure gives rise to interaction mediating vector bosons carrying integer spin. Their respective coupling strength is expressed as a parameter called the gauge charge.
The boson resulting from electromagnetic part of hypercharge in the U(1)Y gauge symmetry of quantum electrodynamics is the photon (γ) mediating the electromagnetic interaction affecting all electrically charged fermions. Expanding the theory to SU(2)L×U(1)Y provides the Z0,W+ and W− boson describing the weak interaction affecting all left-handed fermions [3]. The terms left and right-handed refer to the quantum number helicity which is the spin direction projected on the momentum direction. Massive particles can be boosted into a Lorentz frame where the momentum direction changes its sign, they are in a mixed state of both - they have a left and a right-handed part. Consequently massless particles can either be left or right-handed. By adding the SU(3) group and thus expanding the theory to an SU(3)C×SU(2)L×U(1)Y gauge
1The Cabibbo-Kobayashi-Maskawa matrix contains the strength of flavour changing weak interactions.
4 Introduction
u
up2.3 MeV/c
⅔
½
c
charm
1.28 GeV/c
⅔
½
t
top
173.5 GeV/c
⅔
½
down
d
4.8 MeV/c
-⅓
½
s
strange
95 MeV/c
½
-⅓
b
bottom
4.2 GeV/c
½ -⅓
ν
e<2 eV/c
0
½ <0.19 MeV/c
ν
μ0
½ <18.2 MeV/c
ν
τ0
½
electron
e
0.511 MeV/c
-1
½
μ
muon
105.7 MeV/c
½
-1
τ
tauon
1.777 GeV/c
½ -1
γ
photon
0 0 1
g
gluon
0 1 0
Z
91.2 GeV/c
0 1
80.4 GeV/c
1
±1
mass→
spin→
charge→
QuarksLeptons Gauge bosons
I II III
name→
electron
neutrino muon
neutrino tau
neutrino Z boson
W boson
Three fermion generations
μ W
0
±
2 2 2
2 2 2
2 2 2
2 2 2 2
2
Figure 1.1.: The particles of the Standard Model and their properties [2].
symmetry the strong interaction comes into play with eight bosons called gluons. In contrast to the other bosons they carry themselves the charge they mediate, the colour charge, which gives rise to self interactions and confinement, meaning the quarks and gluons binding together to form colour neutral objects, called hadrons. The process of quarks forming colorless objects is called hadronization. Quarks and gluons in a hadron are called partons and the theory of the strong interaction is called Quantum ChromoDynamics (QCD). Each particlepis complemented by an antiparticlepwhich bears opposite values for all non-zero quantum numbers, apart from mass and spin. Additionally, particles and antiparticles can annihilate except for self-conjugate particles like the photon and theZ0 boson, which are their own anti-particles2.
The Standard Model does not incorporate a mechanism for the origin of particles’ masses.
Those masses can be introduced by adding a Higgs field to the theory [4–9]. This does not only give rise to fermion masses but it also predicts masses for theZ0 boson, W+ and W− boson.
This theory requires a particle called the Higgs boson. On July 4th the ATLAS and the CMS experiments announced the discovery of a new boson compatible with the Standard Model Higgs boson. Its mass has been determined to be 126.0±0.4±0.4 Gigaelectronvolts3 (GeV) with a significance of 5.9 by the ATLAS collaboration [10] and 125.3±0.4±0.5 GeV with 5.8 σ by the CMS collaboration [11]. Further investigations on its characteristics are ongoing.
2Even the neutrinos could be self-conjugate if they turn out to be Majorana fermions.
3Throughout this thesis natural units, i.e. c=~= 1, are used.
1.2 Top Quark Physics 5
1.2. Top Quark Physics
The top quark is one of the two third generation quarks and as such the weak isospin partner of the bottom quark with a charge of 23. It has an average lifetime of τ = 0.5·10−24 s and so it decays before it can form bound states with other quarks. This provides the unique possibility of oberserving the properties of an approximately bare quark. The top quark is the heaviest of all quarks with the current most precise measurement for its mass being mtop = 173.18±0.56±0.75 GeV [13]. Due to the high mass it was not discovered until 1995 [16, 17] at the Tevatron collider at Fermilab which provided sufficient energy and luminosity to first observe it.
1.2.1. Top Quark Production and Decay
At particle colliders new particles are produced according to E =mc2 from the centre of mass energy of a collision. At hadron colliders only the partons in the hadron interact and they carry just a fraction of the original hadron momentum. The probability for the momentum fraction x of a given parton is largest at lowx. This requires hadron colliders to provide much more energy than the mass of the particle to be produced. Top quarks are mainly produced as top quark pairs4. At current LHC energies they are produced via gluon fusion or quark anti-quark annihilation in 85% or 15% of the cases respectively as shown in Figure 1.2(a) and 1.2(b). The t¯tproduction has a cross-section of 177±3+8−7±7 pb at a centre of mass energy of 7 TeV [12] with the uncertainties relating to statistics, systematics and luminosity respectively.
(a) (b)
Figure 1.2.: The two production processes for t¯t pairs. (a) Gluon fusion dominates at the LHC and while (b) qq annihilation dominates at lower energy facilities like the Tevatron [18].
Top quarks decay in almost 100% of the cases into a W± boson and a bottom quark. The W± bosons subsequently decay into either a charged lepton`and a neutrino ν or into aqq-pair.¯ This results in three decay modes of the top quark pair labelled according to the decay products of the W± bosons and whose corresponding branching ratios are shown in Figure 1.3(a).
Alljets channel Both W± bosons decay to quarks. This channel has the largest branching ratio (44%) but it also suffers from a large background fraction. This makes a precise understanding of the detector necessary to extract a clean signal from the recorded events.
The final state of this channel contains 6 jets5 and so it is called alljets channel as well.
4Single top quark production processes will be discussed in section 2.2 as they contribute to the background of a top quark pair measurement
5As mentioned in Section 1.1 quarks are subject to hadronization. This leads to the observable final state of a quark: a spray of particles flying in the direction of the original quark, called jet.
6 Introduction
Lepton+jets channel One W±boson decays to leptons and the other decays to quarks. Thanks to the charged lepton this channel has a clean signature and a reduced background. Final states involving τ leptons are not considered here because of their intricate reconstruction.
This leaves a branching ratio of 30% for this channel. The signature of this channel is one charged lepton, four jets and missing transverse energy from the neutrino escaping the detector undetected. Up to now the most precise top quark mass measurements were performed in this channel [13].
Dilepton channel Both W± bosons decay leptonically as shown in Figure 1.3(b). This channel has a very low background but suffers without τ final states from a low branching ratio of 5%. The final state of the dileptonic top quark decay contains two charged leptons, two jets and large missing transverse energy from the two neutrinos. Depending on the kind of charged leptons in the final state the dilepton channel is further divided into the ee, µµ and eµsubcategories.
(a) (b)
Figure 1.3.:(a)Leading order branching ratios of thet¯t decay channels and(b) the diagram of the dileptonic channel with a muon and an electron in the final state [18].
This thesis concentrates on a top quark mass measurement in the dileptonic decay channel.
This is particularly interesting because at ATLAS the dileptonic channel has not been used for a precision top quark mass measurement yet. This becomes possible because the LHC is performing well and hence the low branching fraction is compensated for by the large amount of data.
1.2.2. Motivation for Top Quark Physics
A precise measurement of the top quark properties pays off in many ways. Firstly, all its properties especially its mass are parameters of the Standard Model and as such of fundamental interest.
Secondly, the possibility that the observed top quark is not the Standard Model top quark but an exotic particle is not yet fully excluded. Thirdly, in many supersymmetric models top quarks are involved in the decay chain of massive supersymmetric particles or can decay into supersymmetric particles themselves [14]. This would lead to a deviation in the production cross-section or the decay rates which could be observed. Fourthly, a major background for searches for physics beyond the Standard Model arises from top quarks. A precise understanding of the production and decay mechanisms are hence essential for discovering new physics signals. Finally, due to its
1.3 The Large Hadron Collider 7
high mass it couples strongly to the predicted Higgs field. Together with the W± boson mass this allows indirect constraints on the Higgs boson mass [15]. A mass comparison of the boson recently discovered at CERN with the indirect masurements will serve as a test of the consistency of the Standard Model.
1.3. The Large Hadron Collider
The Large Hadron Collider (LHC) [19] is a particle accellerator operated at CERN, the European Organization for Nuclear Research near Geneva6.
The LHC is a synchrotron particle accelerator for proton or lead ion beams. It was constructed from 1998 to 2008 and was built with a circumference of 27 km in the tunnel of the dismantled Large Electron Positron Collider (LEP). Its aim is to measure the parameters of the Standard Model with high accuracy and to test theories extending or replacing it. This comprises the search for the Higgs boson, the measurement of CP violation which presumably caused the matter antimatter asymmetry, the probing of the quark gluon plasma and much more. To achieve these goals two equally important issues had to be taken into account, high energies and high event rates. Highest particle energies need to be reached to increase the centre of mass energy available for hard interactions and thus to enter regions of new physics. The LHC is designed for energies of up to 14 TeV for proton-proton (pp) collisions and up to 2.8 TeV per nucleon for heavy ion collisions thereby pushing former limits by almost an order of magnitude. It ran at a centre of mass energy of 7 TeV until April 2012, currently runs at 8 TeV and it is intended to reach its design energy of 14 TeV after a long shutdown in 2013 for repairs and tunings. High luminosities corresponding to a high event rate must be provided. Because of the quantum probabilistic behaviour of nature below atomic scale it does not suffice to perform a single measurement. In fact one needs billions of measurements to draw a conclusion from the outcomes. To further enhance the accuracy of measurements achieved so far the LHC is designed for a luminosity of L= 1034cm−2s−1 for proton-proton collisions and 1027cm−2s−1 for heavy ion collisions. This overtakes former accelerators by almost two orders of magnitude. The beams are not continuous but structured in 2808 bunches. Currently, the LHC routinely runs at L= 6·1033cm−2s−1 and produces about 1 fb−1 per week. Up-to-date information can be drawn from [21] and [20].
Four large and two small detectors are built at the four beam interaction points of the LHC.
The LHC site and the detector locations are shown in Figure 1.4. The large detectors ATLAS [23]
and CMS [24] are multi-purpose instruments situated at opposite sides of the ring. ALICE [25] is a detector designed for analyzing heavy ion collisions and LHCb [26] is devoted to investigating bottom quark physics and rare bottom quark decays with a focus on CP violation studies. The TOTEM [27] experiment, placed at the CMS interaction point, measures interaction parameters like the total pp cross-section and elastic pp scattering. Finally, LHCf [28] situated near the ATLAS experiment measures neutral particle cross-sections in the very forward region in proton and heavy ion collisions. Up-to-date information on the experiments and accelerators at CERN can be found at [29].
6CERN is an acronym for Conseil Europ´een pour la Recherche Nucl´eaire. Founded in 1954 for the investigation of the atomic nucleus it is today the world’s largest fundamental research centre.
8 Introduction
Figure 1.4.: The LHC ring at CERN crossing the borders between France and Switzerland with the locations of its four main detectors [22].
1.4. The ATLAS Experiment
The ATLAS detector is one of the two large multi-purpose detectors at the LHC. It exhibits a cylindrical symmetry with a length of 44 m and a diameter of 25 m and it is centred around the interaction point. It weighs 7000 t and covers almost the full solid angle around the interaction point [23]. The general structure of the detector is shown in Figure 1.5. The ATLAS detector was built to detect a wide spectrum of physics signals at the terascale with high efficiency.
This comprises for example the search for the Higgs boson, supersymmetric final states or the precision measurement of standard model parameters like the top quark mass. The unique physics opportunities provided by the intense and high-energetic beams come with significant experimental challenges. All central components have to be resistent against the high radiation dose close to the interaction region. High luminosity goes with a large number of superimposed proton-proton collisions in the same bunch crossing, the pile-up. Thus extremely fast detector electronics and efficient disentangling and selection of possibly interesting events are necessary.
This has to be combined with high acceptance and precision in measuring the produced particles.
The right-handed ATLAS coordinate system is defined with the positive x-axis pointing towards the centre of the LHC ring and the positive y-axis pointing towards the surface. Consequently, the z-axis is oriented in the counter-clockwise beam direction. For simplicity, in many cases spherical coordinates are used. The azimuth angleφ defining the rotation around the z-axis with φ = 0 pointing towards the positive x-axis and the polar angle θ with θ = 0 pointing towards the positive z-axis. As a Lorentz-invariant measure of distances inθ-space θis generally replaced by the pseudorapidityη:=−ln tan(θ/2). A direction perpendicular to the beam axis therefore corresponds to η = 0 and a high absolute value of η indicates a direction closer to the z-axis which is called forward direction. Distances inη−φspace are measured in terms of
∆R =p
∆η2+ ∆φ2.
The ATLAS detector consists of four main parts immersed in magnetic fields. As seen from
1.4 The ATLAS Experiment 9
Figure 1.5.: The ATLAS detector with its subdetectors and magnet systems [22].
the centre of the detector those are the Inner Detector, the Electromagnetic and the Hadronic Calorimeter and the Muon System. Due to the final states of a top quark pair decay some of their most important features for this work and for top quark mass measurements in general are:
• momentum reconstruction of electrons and muons in the Inner Detector
• energy determination of electrons and jets in the electromagnetic calorimeter
• energy determination of jets in the hadronic calorimeter
• momentum reconstruction of muons in the muon system Those main parts will be briefly discussed in the following.
1.4.1. The Inner Detector
The Inner Detector shown in Figure 1.6 consists of three parts. Seen from the centre those are the Pixel Detector, the SemiConductor Tracker (SCT) and the Transition Radiation Tracker (TRT).
The Pixel Detector is designed to measure impact parameters and secondary vertices and has the highest spatial resolution. It is crucial for the b-jet identification, the b-tagging7. The SCT is a silicon microstrip detector. Due to its distance from the interaction region and to cover larger volumes at moderate number of readout channels, it is made of silicon strips instead of pixels. It contributes to the vertex reconstruction, the measurement of the impact parameters and the momenta of charged particles. The TRT is composed of straw tubes 4 mm in diameter, equipped with a central wire and filled with a Xe gas mixture for the absorption of photons. In between the straws lie radiator foils to produce transition radiation from incoming particles. Thus the
7For brevity a bottom quark jet and the bottom quark tagging will be denoted as b-jet and b-tagging throughout this thesis.
10 Introduction
Figure 1.6.: The Inner Detector and its components [22].
signal in the straws can be used for discriminating electrons from pions. The TRT can operate at very high rates and serve as additional tracker to measure momenta of charged particles. The whole Inner Detector is immersed in a magnetic field of 2 T produced by the Central Solenoid magnet system. This bends the trajectories so the charge and the momentum can be determined.
1.4.2. The Calorimeter System
The calorimeter system consists of two main parts as shown in Figure 1.7. ATLAS calorimeters are sampling calorimeters i.e. particle energies are measured via full absorption in alternating absorbing and active layers. Most particles entering the calorimeter create showers and hereby deposit almost all of their energy in it. This leaves detectable signals in the active parts of the calorimeter. The original particle energy can then be determined from the signal by applying jet energy scale factors from test beam measurements together with in-situ calibration based e.g. on the decay products of resonnances with known masses.
The Electromagnetic CALorimeter (ECAL) is designed to measure electron and photon energies.
Its accordeon shaped layers consist of lead plates as absorber and Liquid Argon (LAr) in between as active material. Due to the high atomic number of lead this stops electromagnetic particles very effectively. It is divided into two parts: The barrel in the central region and the ElectroMagnetic End-Cap (EMEC) in the forward region. The Hadronic CALorimeter (HCAL) determines the hadronic energies of jets stemming from the hadronization of quarks. It is divided into two parts:
The barrel in the central region, whose absorber material is copper or tungsten and whose sensors are tiles of scintillating plastic. The forward region is covered by the Hadronic End-Cap (HEC), which is a LAr calorimeter with copper plates as absorber.
1.4.3. The Muon System
The muon system is the biggest and outermost part of the ATLAS detector. It consists of two main parts, the tracker and the trigger system as shown in Figure 1.8. Muons are the only detectable particles capable of traversing the entire calorimeter system. To measure their
1.4 The ATLAS Experiment 11
Figure 1.7.: The central Calorimeter System and its components [22].
Figure 1.8.: The Muon System and its components [22].
momenta the whole muon system lies within an inhomogenous magnetic field of up to 4 T provided by the large magnet system.
The tracker system provides a precision measurement of the muon tracks. It operates with Monitored Drift Tube (MDT) chambers that function similar to the straws of the TRT but have a larger diameter of 30 mm. The large diameter drift tubes cannot be used in the forward region so Cathode Strip Chambers (CSCs) with high granularity are employed to cope with the higher event rates and track densities. For a fast detection of possible muon candidates the trigger system uses Resistive Plate Chambers (RPCs). In the forward region Thin Gap Chambers
12 Introduction
(TGCs) are used for the same reason as for the MDTs. Together with the Inner Detector a complete reconstruction of muon momenta is possible.
1.4.4. Trigger and Data Processing
With a bunch crossing rate of about 40 MHz not all events can be recorded and written on disk, so a three level trigger system performs a selection. It is a combination of hardware and software based selection processes to identify possibly interesting events and trigger their storage at a rate of about 300 Hz. Due to its requirements in speed, the level 1 trigger is purely hardware based. It consists of the trigger systems in the calorimeters and the muon system mentioned above and reduces the event rate to about 75 kHz. The level 2 trigger is software based and uses the Regions of Interest (RoI) defined by the level 1 trigger to perform a further selection. It uses full granularity information of all subdetector buffers and reduces the event rate to about 1 kHz. The level 3 trigger or event builder performs the final selection using refined calibrations and the full-event buffers. This leads to an event storage rate of about 300 Hz, corresponding to a data volume of about 300 MB/s. The further processing of data is performed on the Worldwide LHC Computing Grid (WLCG). It is a computing infrastructure to store data, to distribute computation tasks and to ensure access and reliability for physicists all around the world. The structure of the WLCG ranges from the Tier-0 centre at CERN to local Tier-3 centres at institutes or universities.
2. Event Selection Procedure and Background Estimation
New findings in physics rely on the comparison of experimental findings to the current physics expectations. Due to their complexity today’s expectations are implemented in event generators that simulate physics events like proton-proton collisions incorporating the current physics knowledge. They use pseudo random numbers to mimic the quantum mechanical processes and are thus called Monte Carlo (MC) generators. Many simulated event samples based on different assumptions are needed to validate analysis procedures and to evaluate the background contribution.
To separate signal events from background events the vast amount of data collected by the detector or produced by MC generators has to pass certain quality criteria, called selection cuts.
Every event has to pass all selection cuts before it may enter the final sample. In this case dilepton events are separated from background events. In this chapter the MC samples used for signal and background estimation as well as the selection cuts for a dileptonict¯tevent are introduced. The MC signal, background and the data samples are listed in appendix A. The code for this analysis was written in C++and ROOTv5.30/05 [30], an object oriented data analysis framework.
2.1. The Signal Process
The dileptonic t¯tdecay is, in contrast to a background process, the signal process of this analysis.
Datasets exclusively made from signal events are called signal samples. The signal samples used in this analysis were produced with different assumptions for the top quark mass: 165, 167.5, 170, 175, 177.5 and 180 GeV. This was done with the general purpose event generator program MC@NLOv4.01 [31] for the hard process in a Next-to-Leading-Order (NLO) calculation using the CT10 [32] parton distribution function for a centre of mass energy of 7 TeV. The program Herwig v6.520 [33, 34] using the cluster hadronisation model was used for parton showers and Jimmyv4.31 [35] for the underlying events using the CT10 Herwig and theJimmy ATLAS AUET2 tune [36]. All t¯tsamples were normalised to the cross-section 166.8 + 16.5−17.8 pb as predicted for Next-to-Next-to-Leading-Order (NNLO) by theHathor[37] tool. The resulting particles were passed on to the detector simulation programGeant4[38], simulating a virtual ATLAS detector and all its interactions and responses to particles. The output events ofGeant4 are processed the same way as raw data from the detector. Every simulated event is assigned an event weight from the event generator step. Physical distributions and event yields are obtained by weighting every event by its corresponding weight. Not all processes modelled during the event generation process are theoretically well described. In certain phase space regions this leads to a deviation of MC prediction from data that has to be corrected afterwards. This is done by applying phase space dependent scale factors, that are determined experimentally in adequate control regions. The most prominent of those are the pile-up weight, the b-tagging and the luminosity scale factor. The pile-up weight is a scale factor depending on the vertex multiplicity
14 Event Selection Procedure and Background Estimation
per event. It accounts for different pile-up event yields in data and MC. The b-tagging scale factor accounts for different modelling of the efficiency of a selection algorithm for b-jets in MC and data. It will be described in detail in Chapter 4.2. The luminosity scale factor scales the MC integrated luminosity down to the luminosity observed in data. Due to the limited time-frame and CPU constraints of the MC 11 production many samples used in this analysis were produced with the fast simulation packageAtlFast2[39,40], bypassing the highly computing intensive step of the fullGeant4simulation. This is done by applying smearing functions and interpolating particle behaviour and detector response with resolution functions measured in full simulation studies. The limited CPU time is the reason why the central samplemtop = 172.5 GeV just has about twice the data statistics (see appendix A). Therefore it was left out for this analysis.
Figure 2.1.: The dileptonict¯tdecay with two neutrinos, two leptons and two bottom quarks in the final state.
As shown in Figure 2.1 there are six particles in the signal final state. The object definition and the observable final states are explained in the following.
Neutrinos: The two neutrinos escape the detector undetected and carry away energy and momentum. The initial momentum of the beam in the xy-plane transverse to the beam direction is zero. Hence requiring momentum conservation allows to identify any non- detected transverse momentum, which is called missing transverse energy1 ETmiss. It is reconstructed using theMET RefFinal algorithm [41].
Charged leptons: The two charged leptons can be detected with high accuracy. They are required to be either electrons or muons, since τ leptons bear difficulties for reconstruc- tion. Electrons are reconstructed from tracking and calorimeter information using the egamma[43] algorithm and muons from tracking and muon chamber information using the muid algorithm [44]. They have to pass certain quality criteria specified in Section 2.3.
Bottom quarks: The two bottom quarks in the final state form B hadrons, composite objects of a bottom quark and light quarks. They have a lifetime long enough to travel a short distance of about 0.5 mm from the primary interaction point before they decay and start to form jets [2]. Thus b-jets originate from a secondary vertex resulting in a large impact parameter that can be measured in the Pixel Detector. To identify jets originating from a bottom quark the MV1 b-tagging algorithm is used. It is a neural network based algorithm
1Transverse momentum is generally defined aspT =p
p2x+p2yand transverse energy asET=E·sinθfrom the calorimeter cell position. The quantityETmiss denotes the negative sum of transverse energy of calorimeter objects and the transverse momentum of muons.
2.2 Background Processes 15
combining information from three b-tagging algorithms (JetFitter, IP3D, SV1), that make use of the information on the secondary vertex and the impact parameter [48]. It constructs a b-tagging weight for every jet that is used as selection criterion. Different working points for theMV1 algorithm corresponding to different weight cuts yield different b-tagging efficiency and light jet rejection factor2. An optimal balance has to be found for each analysis. For this analysis a working point corresponding to a b-jet identification efficiency of 70 % and a rejection factor of 1/137 was chosen. This analysis requires exactly two b-tagged jets. Jets are reconstructed using the anti-kt algorithm [45] with a cone radius parameterR= 0.4, corrected for pile-up [46] and calibrated to the hadronic scale [47].
It is not possible to reconstruct the charge of the bottom quarks and so assigning them to the correct lepton of the W± boson decay and thus to the parent top quark is not trivial.
Different solutions for the b-pairing problem will be discussed in Chapter 3. Jets have to pass certain quality criteria specified in Section 2.3.
2.2. Background Processes
Although the dilepton channel can be considered a very clean channel there are still some background processes which have to be well understood to make a measurement possible. The background contribution has to be estimated and taken into account for the analysis. The different sources of background events and the estimation of their contribution will be introduced in the following. All samples used for the background estimation are listed in appendix A.
(a) (b) (c)
Figure 2.2.:(a)Drell-Yan + jets event with the same final state as the dileptonic top quark pair decay. (b) QCD multijet event with one fake lepton. (c)Single top event with one jet arising from gluon radiation [18].
Processes with the same final state as the dilepton event are called physics background. In the dilepton channel this is due to Drell-Yan processes with two additional jets (Figure 2.2(a)).
The contribution of this background is taken from simulated Z/γ∗+ jets events based on the well known cross-section from measurements at the Z0 boson peak. The samples are produced with Alpgenv2.13 [49] interfaced to Herwig and Jimmyusing suitable parton distribution functions and tunes to ATLAS data. Alpgen cannot match heavy flavour partons and jets explicitly and so the same final states can occur in different samples e.g. Z+b+ 1pand Z+ 2p
2Light jets are jets not originating from bottom quarks.
16 Event Selection Procedure and Background Estimation
with partonsp. To avoid double counting the heavy flavour overlap removal tool [50] is applied.
More information on vector boson production in 2011 analyses can be found in [51].
Events wrongly reconstructed as dilepton events due to imperfect instruments are called instrumental background. Those are mainly fake leptons together with b-tagged jets and true or fakeETmiss as shown. A QCD event faking an electron is shown in Figure 2.2(b). The term fake leptons is used for two kinds of objects. Firstly, jets wrongly reconstructed as electrons can fake an electron. Secondly, non-prompt leptons arising from secondary quark decays can fake prompt leptons from the hard interaction. Those processes are the main background source in the dilepton channel due to the large QCD multijet background stemming from inclusive quark production via QCD diagrams. The QCD background is estimated via the data driven matrix method [51]. It bases on an estimation of fake yields in a background enhanced control region with lowEmissT and a region around theZ0 boson peak where true leptons can easily be identified.
From this, fake efficiencies as a function of the leptonη and pT can be derived, which are used to estimate the expected fake yield in the data sample. The matrix method and details on the procedure are described in appendix A.2.
Another important background source is the single top quark production. The event shown in Figure 2.2(c) contributes to the background given the jet is b-tagged and the W± boson and the top quark decay leptonically. Because of its small contribution and large intrinsic uncertainties the single top quark contribution is taken as top quark mass independent. The central value mtop = 172.5 GeV is chosen as baseline for the estimation of this background. The single top quark samples for the s and the Wt channel were produced usingMC@NLOinterfaced with HerwigandJimmy. The t channel samples were produced with AcerMC [53] with Pythia. The generated events are normalized to the MC@NLOpredicted cross-section and corrected for double counting witht¯tevents [52]. More information on single top quark events can be found in [54].
2.3. Selection Cuts and Event Yields
The selection cuts applied in this analysis are the outcome of optimisation studies performed by the ATLAS Top Reconstruction Group. Some of them turn out to be ineffective but for comparability this analysis sticks to the recommendations. They are tuned to select top quark pair events while at the same time rejecting other events as efficiently as possible. The selection criteria are checked one after the other for every event. If the event fails at one, it is dropped.
Data is recorded in streams stemming from the high-level trigger output. For this analysis the egamma and the muon stream were used. The cut flow shows the events of both streams together.
For computing reasons duplicate events from different data streams were not removed before cut 4. The selection cuts, their efficiencyεon 4.7 fb−1 of ATLAS data and their motivation are described below.
True dilepton/pass GRL: This cut is different for data and MC. For signal MC the event is required to be a dilepton event at parton level. The GRL cut just concerns data.
Data taking periods are structured in runs. For the events in every run several detector performance criteria have to be met, the detector has to be functional. If this is true, the run is set on the Good Run List (GRL). If the run corresponding to the event is not on the GRL the event is not allowed to be used for analysis and it is dropped.
Event has triggered: The trigger system described in Section 1.4 has to have fired to initiate
2.3 Selection Cuts and Event Yields 17
ee channel µµ channel eµchannel
# Selection cut events ε[%] events ε[%] events ε[%]
Total number of events 248102737 241972642 493357854
1 True dilepton/pass GRL 225719564 91.0 221021854 91.3 450023893 91.2 2 Event has triggered 169042673 74.9 179941701 81.4 353057521 78.5
3 Good vertex 168290088 99.6 178982808 99.5 351344119 99.5
4 Cosmic rejection 168290088 100.0 178982805 100.0 351344116 100.0 5 At least two good leptons 683658 0.4 1813482 1.0 12976 <0.1 6 Lepton trigger matching 683658 100.0 1813418 100.0 12972 100.0
7 eµoverlap removal 683641 100.0 1813417 100.0 12916 99.6
8 Jet cleaning 680187 99.5 1803202 99.4 12852 99.5
9 ETmiss,HT cut 1734 0.3 5218 0.3 7546 58.7
10 At least two good jets 989 57.0 2793 53.5 5463 72.4
11 Exactly two good leptons 984 99.5 2779 99.5 5438 99.5
12 Opposite sign leptons 972 98.8 2757 99.2 5334 98.1
13 Low mass cut 967 99.5 2738 99.3
14 Z0 boson mass window cut 736 76.1 2024 73.9 15 Lepton truth matching
14 LAr error flag 734 99.7 2013 99.5 5319 99.7
17 At least one b-jet 573 78.1 1560 77.5 4345 81.7
18 Exactly two b-jets 271 47.1 693 44.4 1964 45.2
Table 2.1.: The list of dilepton selection cuts applied on 4.7 fb−1of ATLAS data. For comparison of efficiencies it is split up into the three sub-channels. The horizontal line after cut 4 indicates the position of the removal of duplicate events.
the recording of the event. Certain trigger criteria, that are specific for each data taking period, have to be fulfilled.
Good vertex: The offspring of the first vertex has to be close enough to the beam line and have more than four tracks. This reduces non collision background.
Cosmic rejection: The muons recorded in the event are not allowed to match the typical track shape of a muon from cosmic radiation, a straight path through both hemispheres of the detector.
At least two good leptons: At least two leptons are required that pass certain quality criteria.
Electron candidates in insensitive parts of the detector are excluded. In particular this concerns all leptons with|η|>2.47 or electrons in the transition region between the central and the forward calorimeter, 1.37 < |η| < 1.52. Leptons from a top quark decay are on average high energetic so a transverse energy of ETe > 25 GeV for electrons and a transverse momentum ofpµT >20 GeV for muons is required. Furthermore they have to be isolated from jets. Together with the energy requirement this rejects QCD background and secondary leptons produced during hadronisation processes.
Lepton trigger matching: One of the leptons is required to match the one that made the trigger fire.
18 Event Selection Procedure and Background Estimation
eµ overlap removal: Objects reconstructed as electrons are not allowed to share a track with a reconstructed muon. Muons could fake electrons in the Inner Detector and the Calorimeter System. This would lead to a double counting of a single lepton. The final lepton selection is not done until cut 10 and so this cut has an effect in the ee and µµchannel as well.
Jet cleaning: The event is required to have no bad jets with pT >20 GeV. Bad jets are not associated to real energy deposits in the calorimeter originating from pp collisions. They arise e.g. from hardware problems or cosmic air showers.
EmissT , HT cut: Two neutrinos in the final state result in large ETmiss. So for the ee and µµ channel ETmiss>60 GeV is required. The eµchannel has to be treated differently because its background processes involve diboson andZ →τ τ events. The neutrinos resulting from boson or τ decays represent a natural source of ETmiss and make a ETmiss cut ineffective.
A cut on theHT variable, the scalar sum of pT of the selected two leptons and the jets, is chosen instead: HT >130 GeV is required for the eµ channel. The ETmiss cut removes efficiently Drell-Yan+jets background events because they have no neutrinos in the final state.
At least two good jets: At least two jets are required to pass certain quality criteria. Their transverse energy has to satisfy ET >25 GeV because of insufficient jet energy corrections for lower energetic jets and to suppress instrumental background. Furthermore jets have to comply with |η|<2.5 because of limited tracking information and thus limited b-tagging possibilities in the forward region. A Jet Vertex Fraction |J V F|>0.75 is required. The JVF is the fraction of tracks associated to the jet by the jet algorithm coming from the primary vertex, JVF =Ntracksprimary/Ntracks. A low JVF indicates that the jet has significant contributions from pile-up events.
Exactly two good leptons: Exactly two leptons are required.
Opposite sign leptons: The two leptons are required to have opposite sign.
Low mass cut: In the ee andµµchannel the low mass cutm(ee, µµ)>15 GeV aims at reducing background from low mass resonances like mesons decaying to lepton anti-lepton pairs.
Z0 boson mass window: This cut in the ee and µµ channel vetoes an invariant mass of the lepton-lepton system compatible with theZ0boson mass: |m(/ee, µµ)−91 GeV|>10 GeV.
This reduces the Drell-Yan+jets background significantly.
Lepton truth matching: This cut only applies to MC samples. Both reconstructed leptons have to match truth leptons at parton level.
LAr error flag: This cut only applies to data samples. Events containing electrons or jets marked as passing through a dead part of the LAr calorimeter are rejected.
At least one b-jet: At least one b-tagged jet with MV1 weight >0.601713 is required.
Exactly two b-jets: Exactly two b-tagged jets withMV1 weight >0.601713 are required.
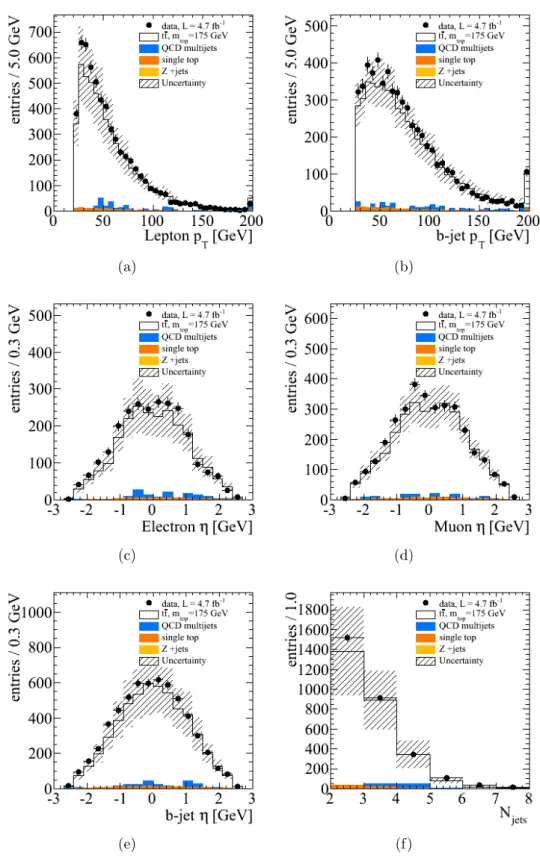
More information on the triggers, the reconstruction and b-tagging algorithms can be found in [51]. Table 2.2 lists the expected contributions for the leading background sources in all channels together after all selection cuts have been applied. The square root of the number of data
![Figure 1.4.: The LHC ring at CERN crossing the borders between France and Switzerland with the locations of its four main detectors [22].](https://thumb-eu.123doks.com/thumbv2/1library_info/4025748.1542090/12.892.273.666.155.475/figure-cern-crossing-borders-france-switzerland-locations-detectors.webp)
![Figure 1.5.: The ATLAS detector with its subdetectors and magnet systems [22].](https://thumb-eu.123doks.com/thumbv2/1library_info/4025748.1542090/13.892.171.674.170.470/figure-atlas-detector-subdetectors-magnet-systems.webp)