A TLAS-CONF-2012-131 17 September 2012
ATLAS NOTE
ATLAS-CONF-2012-131
September 17, 2012
Measurement of the top quark pair production cross section with ATLAS in pp collisions at √
s = 7 TeV in the single-lepton channel using semileptonic b decays
The ATLAS Collaboration
Abstract
The cross section for top quark pair production in pp collisions at √
s = 7 TeV is mea- sured using data recorded with the ATLAS detector at the Large Hadron Collider. Events are selected requiring a single high- p
Tisolated electron or muon, missing transverse momen- tum and jets. Semileptonic b decays are identified by a lower momentum muon close to a jet, leading to substantially di ff erent sources of systematic uncertainty compared with other measurements. With a data sample corresponding to 4.66 fb
−1of integrated luminosity the top quark pair production cross section is measured to be
σ
tt¯= 165 ± 2(stat.) ± 17(syst.) ± 3(lumi.) pb
in agreement with theoretical predictions based on perturbative QCD and with other mea- surements which used different techniques or decay channels.
c
Copyright 2012 CERN for the benefit of the ATLAS Collaboration.
Reproduction of this article or parts of it is allowed as specified in the CC-BY-3.0 license.
1 Introduction
Measurements of the top quark pair (t¯ t) production in hadronic collisions are important for two main reasons. The first one is that the precision experimental determination of the cross section itself and of the related differential distributions provides precise tests of perturbative Quantum Chromo Dynamics (QCD). The predicted Standard Model (SM) t¯ t cross section for pp collisions at a centre-of-mass energy of √
s = 7 TeV is σ
tt¯= 167
+17−18pb, for a top quark mass of 172.5 GeV. This cross section has been calculated at approximate NNLO in QCD with Hathor 1.2 [1] using the MSTW2008 90% C.L. NNLO PDF sets [2] incorporating PDF + α
Suncertainties, according to the MSTW prescription [3], added in quadrature to the scale uncertainty and cross checked with the NLO + NNLL calculation of Cacciari et al. [4] as implemented in Top++ 1.0 [5]. The ATLAS Collaboration has measured σ
tt¯with a precision of about 7% [6, 7]. The CMS Collaboration has measured σ
t¯twith a precision of about 3% [8]. The second reason is that the various t¯ t final states are similar to those produced by a number of new physics processes, including those arising from the production of supersymmetric particles and Higgs bosons.
These new physics contributions could be detected initially through discrepancies in the production or decay rate of a particular t¯ t final state, or by observing discrepancies in restricted phase space regions of the top quark pair. It is therefore important to test the production of t¯ t in all its final states for consistency with the SM.
This notes reports on the measurement at the LHC of the production of t¯ t in the single-lepton plus jets decay channel in which one of the jets contains a muon from a semileptonic b decay. Since this muon has a softer momentum than those coming from W bosons, this technique is referred to as Soft Muon Tagging (SMT). The measurement of semileptonic decays in jets can be sensitive to processes of cascade decays of non-SM bottom-flavoured objects, such as in SUSY b → bX ˜ → µcX
0[9–13]. Such particles, if present within the candidate t¯ t sample or produced in top quark decays, could give rise to an apparent enhancement of the semileptonic branching fraction in t¯ t events and anomalous soft muon kinematics and charge distributions. In addition, the measurement of the t¯ t production cross section using the SMT technique is complementary to lifetime-based b identification measurements and is sensitive to different systematic uncertainties. This analysis uses a newly developed identification algorithm for muons in jets, solely based on muon-reconstruction quality, that can be exploited to detect both b and c semileptonic decays.
2 The ATLAS detector
The ATLAS detector [14] consists of inner tracking devices surrounded by a solenoid delivering a 2T axial field, electromagnetic and hadronic calorimeters and a muon spectrometer with a toroidal mag- netic field. The Inner Detector (ID) system provides precision tracking of charged particles within a pseudorapidity
1range of |η| < 2.5. It consists of a silicon pixel detector, a silicon microstrip detector and a straw tube tracker that also provides transition radiation measurements for electron identification.
The calorimeter system covers the range |η| < 4.9. It is composed of sampling calorimeters with either liquid argon (LAr) or scintillating tiles as the active media. The Muon Spectrometer (MS) surrounds the calorimeters, consists of three large superconducting toroids with eight coils per toroid and has sep- arate trigger and high-precision tracking chambers which provide muon identification and momentum measurement for |η| < 2.7.
1
The pseudorapidity
ηis defined as
η = −ln[tan(θ/2)], where the polar angle
θis measured with respect to the LHC
beam-line.
Source PDG Herwig PDG / Herwig P ythia PDG / P ythia b → µ 0.1095 ± 0.0029 0.0957 ± 0.0003 1.14 ± 0.03 0.1001 ± 0.0003 1.09 ± 0.03 b → τ → µ 0.0042 ± 0.0004 0.0070 ± 0.0002 0.60 ± 0.06 0.0067 ± 0.0001 0.62 ± 0.06 b → c → µ
+0.0802 ± 0.0019 0.0824 ± 0.0003 0.97 ± 0.02 0.0889 ± 0.0003 0.90 ± 0.02 b → c ¯ → µ
−0.0160 ± 0.0050 0.0251 ± 0.0002 0.64 ± 0.20 0.0266 ± 0.0002 0.60 ± 0.19 c → µ (W → c¯ s) 0.0820 ± 0.0050 0.0854 ± 0.0006 0.96 ± 0.06 0.1053 ± 0.0007 0.78 ± 0.05
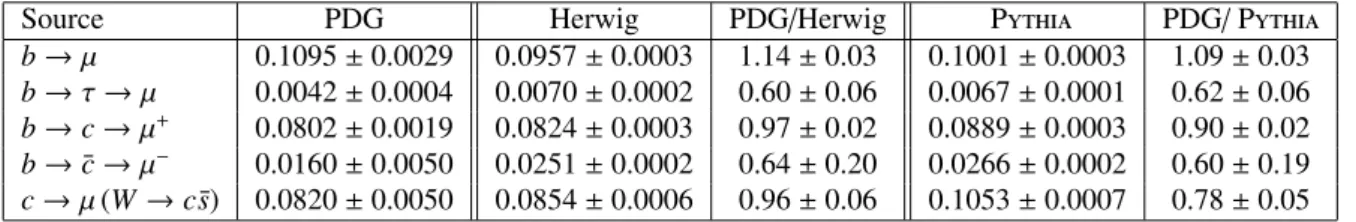
Table 1: Comparison of Branching Ratios (BR) for various decays of b and c quarks producing muons between measured values, Herwig and Pythia . “PDG” indicates the reference values used [24] to determine the weights applied to the MC generators, as listed in the fourth and sixth columns respectively for H erwig and P ythia . Uncertainties in the columns titled “H erwig ” and “ P ythia ” are the statistical uncertainties due to the limited generated sample size when computing the branching ratio from each generator.
3 Data and simulated samples
This measurement uses data recorded by ATLAS between March and November 2011 at the LHC. After the requirements on beam, detector and data quality, the dataset corresponds to an integrated luminosity of 4.66±0.08 fb
−1[15]. Simulated event samples are used to aid in the description of some of the backgrounds, and to determine the detector acceptance, the reconstruction e ffi ciencies and the expected event yields for the t¯ t process. The t¯ t signal Monte Carlo (MC) has been simulated using the MC@NLO v4.01 [16,17] generator interfaced to H erwig [18] for parton showering and hadronisation and J immy [19]
for the underlying event simulation. The Parton Distribution Function (PDF) set is CT10 [20] and the top quark mass is set to 172.5 GeV. The W/Z + jets MC samples were generated using A lpgen [21] interfaced to Herwig+Jimmy. The single top quark MC samples used MC@NLO interfaced to Herwig+Jimmy for the s-channel and Wt-channel, while the t-channel was generated using the AcerMC [22] generator interfaced to P ythia [23]. The diboson (WW/WZ/ZZ) MC samples were generated using H erwig . The special MC samples used to determine the various systematic uncertainties are described in Section 7.
In order to extract a correct estimate of the signal acceptance for the t¯ t signal, it is important that the Monte Carlo samples reproduce accurately both the overall rates of the soft muons coming from the semileptonic b/c decays and the relative ones from the various decay modes. To this end, each event in the simulation containing a muon originating from the decay of a heavy flavour quark is re-weighted such that the branching ratio of b → µX decays, particularly the dominant ones (b → µ (direct) and b → c → µ (sequential)), is scaled to match the most recent measurements in Ref. [24]. In addition, the inclusive fraction of charm into muons ( Γ (c → µ + anything)/ Γ (c → anything)) is used to rescale the fraction of charm into muons from W → c s ¯ decays. This value was experimentally determined for an admixture of charm hadrons at LEP at the Z pole and is therefore suited for W-boson decays [24]. The weights determined for the generator used for parton showering and hadronisation are shown in Table 1 for Herwig and P ythia .
4 Soft Muon Tagging algorithm
The SMT algorithm used in this analysis relies on the presence of a reconstructed muon within a jet.
The total b → µX branching ratio, including cascade b → c → µX decays, is about 20%, consequently
36% of simulated t¯ t events contain at least one b-jet which decays semimuonically. The tagger uses the
quality of the match between the ID and MS tracks of the muon (χ
2match) as a discriminating variable to
separate heavy flavour (b, c) jets from light flavoured (u, d, s or gluon) ones. Selecting muons that have
a good χ
2matchrejects those coming from decays in flight of light hadrons and random association of an
ID track with a muon segment, characteristic of light jets. Muons are required to have a χ
2match< 3.2 which has been optimized to provide a b-jet identification e ffi ciency of 10% whilst providing a light jet rejection factor of about 200 per jet as measured in t¯ t simulated events. Considering only b-jets which decay semimuonically, the tagger has an identification efficiency of about 50%.
Muons considered by the tagger are required to pass a series of quality cuts on the numbers of hits present in the various tracking subdetectors [25]. The list of tagger-specific cuts is shown in Table 2. The variable ∆ R(µ, jet) represents the distance between the soft muon and the jet and is used to define the association between a jet and a soft muon. The transverse impact parameter, |d
0|, and the longitudinal impact parameter, |z
0· sin θ| , of the soft muon track with respect to the primary vertex are used to reject spurious matches between tracks reconstructed in the ID and in the MS, in particular matches with tracks originating from additional vertices due to pile-up at high luminosity. The ∆ R(µ
W, µ
SMT) cut between the muon from the W decay and the SMT muon ensures that the soft muon selected is not the same as the identified muon from the W decay. The last criterion makes use of the jet EM fraction, the fraction of jet energy deposited in the electromagnetic calorimeter, and the jet charged track multiplicity to ensure that the jet associated with the muon has not originated from the muon itself (final state radiation or energy losses in the calorimeters).
∆ R(µ, jet) < 0.5
|d
0| < 3 mm
|z
0· sin θ| < 3 mm p
T> 4 GeV
∆ R(µ
W, µ
SMT) > 0.01
|η| < 2.5 χ
2match< 3.2
Jet track multiplicity > 3 or Jet EM fraction <0.8 Table 2: List of the soft muon tagger cuts.
The e ffi ciency of the soft muon χ
2matchrequirement has been measured directly on J/ψ → µµ and Z → µµ data using a tag-and-probe technique [26, 27] since it only depends on muon related measure- ments and is independent of the event topology. It is studied as a function of p
T, η, φ and several isolation variables. The time evolution of the e ffi ciency with the data-taking period is also monitored and found to be stable.
A significant dependence, however, has been observed for the ratio between the efficiencies measured in data and those expected from simulation as a function of both the p
Tand η of the muons. Consequently, correction factors for simulation are calculated for all 2011 data and are binned in both p
Tand η. For each of five regions in pseudorapidity, corresponding to five different regions of the muon systems of the ATLAS detector, a scale factor is derived as function of the muon p
T. The scale factors obtained from J/ψ → µµ data and MC simulation cover the range: 4 ≤ p
T≤ 12 GeV, the range relevant to the SMT muon. Scale factors for the range: 12 ≤ p
T≤ 40 GeV are obtained from Z → µµ studies. In general, the scale factors across the p
Tand η ranges of interest are between 0.97 and 1 within an uncertainty ≤1%.
Figure 1(a) shows the χ
2matche ffi ciency and data / simulation scale factor with respect to the p
Tof the probe muon.
It is particularly important to study the scale factors as a function of the isolation of the muon track
since the soft muon coming from semileptonic b decays is surrounded by tracks while muons from J/ψ
SMT Efficiency2Match
0.6 0.7 0.8 0.9 1
For Approval ATLAS
L dt = 4.7 pb-1
| < 1.1 0.1 < | probe
µ) MC simulation (J/ µ Uncertainty
candidates) µ
Data (J/ µ Uncertainty
[GeV]
probe muon pT
4 5 6 7 8 9 10 11 12
Data/MC Scale Factor
0.95 1 1.05
-
Internal-
-
66 fbP
i I
-1IIIIIIII
scale factore IIIIIIIIIIIIIIIIIIIIIIIIIPreliminarySMT Efficiency2Match
0.6 0.7 0.8 0.9 1
For Approval ATLAS
L dt = 4.7 pb-1
µ) MC simulation (J/ µ Uncertainty
candidates) µ
Data (J/ µ Uncertainty
probe muon ptcone40 [GeV]
5 10 15 20 25 30 35
Data/MC
0.8 1 1.2
-
Internal-
P 66 fb-1
-
PIIIIIIIIIII IIIIIIII I
Data/MC scale factore
IIIIIIIIIIIIIIIIIIIIIIIIIIIIIIIII III
IIIIIIIIIIIIIIIIIIIIIIIIIIIIIIIII Probe muon isolation pI T
IIIIIIIIII IIIIIIIIII IIIIIIIIII
Probe muon track IIIIIIIIIII
III IIIIIIIIIIPreliminary
Figure 1: SMT χ
2matche ffi ciencies and data over simulation comparisons - shaded regions represent statis-
tical + systematic uncertainties. The top figure shows the SMT χ
2matche ffi ciencies with respect to the p
Tof the muon, in the barrel region of the detector. The bottom figure shows the SMT χ
2matchefficiencies
with respect to the sum of the transverse momenta of tracks in a cone of ∆R < 0.4 surrounding the muon.
or Z bosons are isolated. The efficiency and data/simulation comparison for the sum of the transverse momenta of tracks in a cone of ∆ R < 0.4 surrounding the muon in is shown in Figure 1(b). Both the efficiency of the χ
2matchcut in data and the associated data-to-simulation scale factor are found to be constant with respect to isolation, up to high values of isolation energy.
The mistag rate (tagging rate of Light Flavour (LF)-originated jets) is measured directly on data using an inclusive sample of dijet events selected using a mixture of single-jet triggers with p
Tthresholds between 15 and 40 GeV. All jets with p
T> 25 GeV and |η| <2.5 are considered. In order to reduce the Heavy Flavour (HF) contributions from b b ¯ and c c ¯ decays, the mistag rate is extracted from the combination of two calibration samples defined using the information of a lifetime–based flavour tagger [28]. A looser sample includes events where one of the two jets is required not to be tagged by the lifetime tagger; in the second sample only events where neither jet is tagged by the lifetime tagger are accepted.
The HF contribution in the latter is strongly suppressed (< 1%). A systematic uncertainty is assigned to account for the effect of the residual contribution by varying the HF fractions in the simulation. A system of two equations, relating the number of pre-tagged and SMT-tagged jets in data with the mistag rate and the HF tagging e ffi ciency, is constructed from the above two samples. The mistag rate is extracted by solving the system, which eliminates any dependence on the HF tagging efficiency.
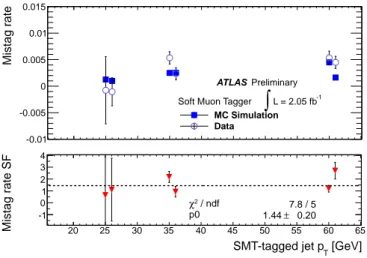
The mistag rate is studied as a function of the jet kinematics (p
Tand η) in order to probe any possible physics as well as instrumental e ff ects (like LF-originated jets punching through the ATLAS calorimetry and being reconstructed as muons). Three p
Tbins (20-30, 30-60 and >60 GeV) and two |η| bins (<1.05 and >1.05) are considered, according to the available number of events from the single-jet triggers. No dependence is observed on either, as can be seen from Figure 2.
Mistag rate
-0.01 -0.005 0 0.005 0.01 0.015
L = 2.05 fb-1
∫
Soft Muon Tagger MC Simulation Data
ATLAS Preliminary
[GeV]
SMT-tagged jet pT
20 25 30 35 40 45 50 55 60 65
Mistag rate SF
-1 0 1 2 3 4
/ ndf
χ2 7.8 / 5
p0 1.44 ± 0.20
Figure 2: Top: Mistag rate of the SMT algorithm as a function of the jet p
T. The filled squares show the expected rate in MC simulation, the circles show the observations from collision data. For graphics purposes, in each p
Tbin the left most point is for central pseudorapidities, the rightmost for forward pseudorapidities. The estimated mistag rate in the first p
Tbin is negative due to statistical fluctuations when solving the system of equations. Bottom: scale factor of the mistag rate, defined as the ratio of rates in data and simulation. The values are fitted with a constant function and the fit parameters are also shown.
The measured mistag rate on data is compared with expectations from Monte Carlo simulation,
derived from Pythia dijet samples covering the full p
Tspectrum. As a result of a fit with a constant
function, a single scale factor, SF = 1.44 ± 0.20 (stat. ⊕ syst.), is found to be sufficient to describe the
differences between data and simulation. Systematic uncertainties are evaluated for each value of the mistag rate and include contributions from muon momentum corrections to the simulation made in order to describe the width of Z → µµ decays observed in data and the uncertainty on the calibration of the lifetime tagger efficiency for b− and c-originated jets, used to define the single- and double-veto samples.
The relative ratio of b− to c-originated jets in the simulation is also varied by a factor of 50% in order to study the effect of the residual contribution of the inclusive HF sample after the vetoes. All of the related systematic uncertainties are found to be negligible with respect to the 0.20 uncertainty from the fit. Finally, the above method is found to su ff er from a relative bias of approximately 20% with respect to the true mistag rate in simulation at low jet transverse momenta. This effect is assumed to be the same in data and the related uncertainty is incorporated into the other background systematics term in Table 8.
5 Event selection
The analysis requires collision data selected by an inclusive single electron or muon trigger with offline- reconstructed candidates satisfying p
T> 25 GeV for electrons and p
T> 20 GeV for muons to ensure good trigger e ffi ciency. Electrons are also required to have |η| < 2.47 and not be in the transition region be- tween the barrel and the endcap calorimeters (1.37 ≤ |η| ≤ 1.52). They must satisfy the “tight” selec- tion using calorimeter, tracking and combined variables [29]. Muon candidates, known as “combined”
muons, are obtained by combining track segments from the layers of the muon chambers with tracks found in the inner detector within |η| < 2.5. The combined track is refitted using the complete tracking information from both detector systems.
Leptons from W decays are isolated and thus, to reduce backgrounds, both calorimeter
2and track
3isolation are required. For the electron, the cut value on the calorimeter and track variables depend on the electron p
Tand η such that the isolation cut e ffi ciency for each variable is maintained at 90%. For the muon, the calorimeter isolation is required to be less than 4 GeV while the track isolation is required to be less than 2.5 GeV. Leptons are also required to be further than an angular distance ∆ R = 0.4 from any jet. Events are required to contain only one selected electron or muon. Both electron and muon channels are considered and include contributions from the tau channel where the tau decays leptonically. Tau channels in which the tau decays hadronically are not considered.
Jets are reconstructed with the anti-k
talgorithm [30,31] with a distance parameter R = 0.4. Calorime- ter topological clusters, calibrated at the electromagnetic (EM) scale [32] are used as the input to the jet reconstruction algorithm. A jet energy calibration based on a p
Tand η dependent correction derived from in-situ measurements is applied. Jets are required to have a p
T> 25 GeV, |η| < 2.5 and an absolute jet vertex fraction
4> 0.75. Jets that are within ∆ R < 0.2 from a selected electron are rejected.
The magnitude of the missing transverse momentum (E
missT) is constructed from the vector sum of all calorimeter cells contained in topological clusters [33]. These are associated with the reconstructed physics objects selected in the analysis. The association order is electrons, jets and muons, such that a cell can only be matched to a single object. The cells are corrected according to the energy scale of associated jets/electrons and the measured muon momenta or, if not matched to any object, calibrated at the EM scale.
In the e +jets channel the requirements that E
missTbe greater than 30 GeV and that the transverse W
2
Calorimeter isolation is defined using the transverse energy deposited in the calorimeter, not associated with the lepton, and summed in a cone of radius
∆R=0.2 around the lepton, where the variable
∆Ris defined as:
∆R= p(∆φ)
2+(∆η)
2.
3
Track isolation is defined using the sum of the track transverse momenta, for tracks with
pT>1 GeV, in a cone of radius
∆R=
0.3 around the lepton.
4
The jet vertex fraction discriminant is defined by combining tracks and their primary vertex with calorimeter jets to
measure the probability that a jet originated from the identified hard-scattering interaction vertex. The discriminant is assigned
a negative value if the jet has no tracks matched to it.
mass
5, denoted m
T(W), be greater than 30 GeV are imposed, while in the µ +jets channel the E
missTre- quirement is looser (> 20 GeV) and a triangular cut is performed by requesting that E
Tmiss+ m
T(W) > 60 GeV.
In the analysis, events passing all selections described above with at least 3 jets are defined as “pretag”
events. Pretag events with at least one jet identified as coming from a semileptonic b-quark decay by the SMT algorithm are referred to as “tagged”. In the µ + jets channel, events for which the invariant mass of the W-decay muon and the b− tagged SMT muon is in the ranges 8 GeV ≤ m
µµ≤ 11 GeV and 80 GeV ≤ m
µµ≤ 100 GeV are vetoed to remove contributions from Υ and Z dimuon decays. Addition- ally, to ensure that the tagged muon is not the same as the W-decay muon, a cut of ∆ R(µ
W, µ
SMT) > 0.01 is applied.
The signal selection efficiencies, found by applying the full selection described above on the simu- lated t¯ t signal sample, are 1.42% in the e + jets channel and 2.15% in the µ + jets channel. The selection efficiencies quoted are for both single lepton and dilepton events with at least three jets where at least one jet has been tagged by the SMT algorithm. Since the tagger identifies muons from semileptonic decays of b-quarks the selection e ffi ciencies have the branching ratio of b → µX of 20% along with the acceptance of the tagger (see Section 4) folded in. The fully hadronic acceptance is negligible and consequently is not quoted.
6 Data-driven background determination
Data-driven estimations are used for the dominant multijet and W +jets backgrounds while MC samples are used for the electroweak backgrounds (single top quark and dibosons) and the Z +jets background.
6.1 Multijet background in the muon channel
Multijet events can contaminate the signal region producing “fake” isolated muons misidentified as orig- inating from W boson decays. The main sources of fake muons from the decay of W bosons are: muons from semileptonic decay of a heavy (b / c) quark jet, muons from the decay in flight of pions and kaons and
“punch-through” hadrons that are not fully absorbed within the hadronic calorimeter and are observed in the muon spectrometer.
At pretag level the contribution of such a background is estimated using the so-called matrix method [34]. In addition to the standard lepton selection requirements, a selection with a looser isolation require- ment is defined. Candidate µ + jets events are selected using the loose isolation requirement and events are categorized according to whether the muon passes the standard selection or the loose selection. The number of loose events, N
loose, and the number of standard events, N
std, can be expressed as a linear combination of events containing a “real” (prompt) or “fake” muon as follows:
N
loose= N
realloose+ N
fakelooseN
std= rN
realloose+ f N
fakeloose(1)
where r is the fraction of “real” muons in the loose selection that also pass the standard selection and f is the fraction of “fake” muons in the loose selection that also pass the standard selection. Given a measured N
looseand N
stdand if r and f are known, the number of events with fake muons can be calculated. The relative e ffi ciencies r and f are measured in data in control samples enriched in either real or fake muons.
The e ffi ciency r is obtained from an inclusive sample of Z → µµ events. The value of f is obtained from data with two different methods: from a control region where the E
Tmiss+ m
T(W) cut is inverted and an
5
The transverse mass of the
Wboson is defined as
mT(W)
= q2p
`TpνT1
−cos
φ`−φν, where
EmissTis identified with the
neutrino in order to calculate
pνTand
φν.
additional cut of m
T(W) < 20 GeV is applied; and from a fit of the muon’s transverse impact parameter significance distribution in a sample where the both the E
missT+ m
T(W) and the E
missTcut are inverted.
The central value for the pretag multijet estimate is the average of the two estimations and is found to be 27000±5400. The uncertainty of 20% covers the difference between the two estimations as well as the intrinsic uncertainties of each method.
The estimate for the multijet background after tagging is obtained by multiplying the matrix method pretag estimate by the probability that a multijet event is SMT tagged. The SMT tagging rate is deter- mined in two control regions: one which implements the selection described in Section 5 for the µ + jets channel, except that the E
missTand E
Tmiss+ m
T(W) cut is inverted; and the other region is defined by an inverted muon isolation. In each control region, the non-multijet contributions from t¯ t, W +jets and other simulated backgrounds are subtracted. The obtained tagging rates are shown in Table 3. The sys- tematic uncertainty on the tagging rate in each control region is obtained by varying the W +jets and t¯ t normalisation by 25% and 15% respectively and also includes contributions from SMT b-tagging and the branching ratio re-weighting.
Multijet control region SMT tagging rate (%) Inverted isolation 5.7±0.1 Inverted triangular cut 4.0±0.5 Unweighted average 4.9 ± 0.8
Table 3: SMT tagging rates as measured in the two multijet dominated data control regions. Uncertainties are quoted as the sum in quadrature of statistical and systematic contributions.
The central value of the tagging rate is obtained by taking the unweighted average of the two control region tagging rates. The total uncertainty is set to half the difference between the two control region rates, as this is a greater systematic uncertainty than those associated with each control region.
The final tagged multijet estimate is 1310±350, where the total uncertainty is obtained by combining the uncertainties on the pretag background estimate and on the average SMT tagging rate.
6.2 Multijet background in the electron channel
In the electron channel, the multijet background consists of both non-isolated and misidentified electrons, where the latter includes both electrons from photon conversions and charged hadrons. Analogously to the muon channel, the matrix method is used to obtain the pretag estimate of the multijet background in the signal region. In addition to the standard electron selection requirements, a selection with a looser isolation requirement is defined. The e ffi ciency r is obtained from an inclusive sample of Z → ee events. The value of f is obtained from events containing exactly one loose lepton, at least one jet with p
T> 25 GeV and with E
Tmiss< 20 GeV. The pretag estimate is found to be 16200 ± 8100, where an uncertainty of 50% is assigned to the pretag estimate to cover the respective uncertainties on r and f .
To derive a tagged estimate the pretag estimate is multiplied by the probability to tag multijet events with the soft muon tagger. The tagging probabilities are obtained in several control regions (denoted A, B and C) as described in Table 4.
The event tagging rate is obtained for the various regions on a per jet-bin basis and the results are summarized in Table 5. The systematic uncertainty on the tagging rate in each region is determined by scaling up and down the W + jets and t¯ t contributions by 25% and 15% respectively. The systematic un- certainty also includes the uncertainty arising from SMT b-tagging and the branching ratio re-weighting.
The tagging rate used in the background estimation is the unweighted average of the three regions. The
systematic uncertainty on the average tagging rate is defined as half the largest di ff erence between the
E
Tmiss< 30 GeV E
Tmiss> 30 GeV Non-isolated e A (control) B (control)
Isolated e C (control) D (signal)
Table 4: Definitions of the control regions used for the multijet background estimation in the e +jets channel. Region A is dominated by multijet events, whereas B and C contain a mixture of electroweak and multijet processes. Note that the signal region is included for completeness.
Multijet control region SMT tagging rate (%) A (Low-E
missT, non-isolated e) 3.8 ± 0.1 B (High-E
missT, non-isolated e) 5.1±0.4 C (Low-E
Tmiss, isolated e) 2.5±1.3
Unweighted average 3.8±1.3
Table 5: Multijet SMT event tagging rates (in percent) in regions A, B and C. Uncertainties are quoted as the sum in quadrature of statistical and systematic contributions.
individual tag rates since this is greater than any of the uncertainties on the individual regions. The final tag estimate is 620 ± 310 events.
The results for the SMT tagging rate obtained from the muon and electron signal regions are, as expected, in agreement with each other within their uncertainties which are only partially correlated.
6.3 W + jets background
The W + jets background is the dominant background since these events already contain a real lepton and significant E
missT. Within this background, W +HF jets is the largest contribution. Since there is a significant uncertainty on the overall normalisation of the W +jets predictions, especially for the HF contribution, and since the W + LF jet component involves a mis-tagged jet, a data-driven method, known as the W charge asymmetry method [35], is used to estimate this background and its uncertainty.
The W charge asymmetry method relies on the observation that the ratio of positively charged W bosons to negatively charged W bosons su ff ers from relatively small theoretical uncertainty [36] [37] and hence can provide the overall normalisation. Equation (2) describes how the charge asymmetry can be used to obtain the normalisation:
N
W++ N
W−= N
WMC++ N
WMC−N
WMC+− N
WMC−(D
+− D
−)
= r
MC+ 1
r
MC− 1 (D
+− D
−) (2)
where D
+/−are the number of events in data with a positive or negative lepton and r
MCis the ratio of
events in the W +jets simulation with a positive lepton to those with a negative lepton. This method will
only work if the data is composed of charge symmetric processes except for the W + jets. The t¯ t process
and the multijet background are, to first approximation, charge symmetric, but the single top quark and
the diboson backgrounds are not. Therefore, their contributions are subtracted from D
+/−, using their
respective simulation predictions.
The charge asymmetry method provides the overall normalisation of the number of W +jets events in the simulation before any tagging requirement is made, denoted W
pretag. The relative number of Wb b ¯ +jets, Wc¯ c +jets and Wc +jets events are known only within large uncertainties in the W +jets simu- lation. To account for this, the relative ratios of W +HF jets (or HF fractions) in the W +jets simulation are adjusted to match those observed in data using the lifetime-based b-tag counting method [38].
To derive an estimate of the W +jets background in the tagged sample, W
tag, the event tagging rates for HF and LF are used, following Equation (3):
W
tag= R
LFtag· W
pretagLF+
HF=c,cc,bb
X
HF
R
HFtag· W
pretagHF(3) where R
LFtagis defined as the probability to mistag a LF event and R
HFtagis the probability to correctly tag a HF event. The tagging rates are derived from the simulation where the b-tagging mistag rate scale factor and tagging e ffi ciency scale factor (discussed in Section 4) along with the b → µX reweighting have been applied to each tagged jet.
e+ jets µ + jets
Flavour W
pretagR
tagW
tagW
pretagR
tagW
tagbb 4400 ± 1800 0.108 ± 0.007 480 ± 200 7700 ± 2800 0.094 ± 0.005 720 ± 260 cc 8300 ± 3400 0.044 ± 0.003 360 ± 150 14700 ± 5300 0.040 ± 0.003 590± 210 c 7000 ± 4000 0.045 ± 0.004 290 ± 170 16700 ± 7200 0.043 ± 0.003 710 ± 310 Light 40000 ± 6000 0.013 ± 0.002 500 ± 110 78000 ± 11000 0.011 ± 0.001 860 ± 170
Total 60000 ± 5000 1630 ± 330 117000 ± 9000 2900 ± 500
Table 6: Estimation of the W + jets background split into LF and HF (c, c c, ¯ b b) contributions for jets ¯ in both the electron and muon channels. The tagged estimate, W
tag, for each flavour is obtained by multiplying the pretag estimate, W
pretag, by the tagging rate, R
tag. Uncertainties are quoted as the sum in quadrature of statistical and systematic contributions; note that some of the HF uncertainties on the pretag estimates are anticorrelated.
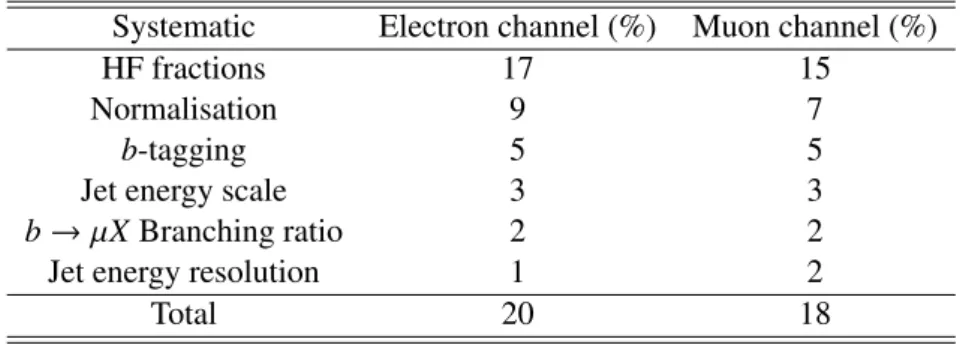
Table 6 contains the W +jet pretag estimate, along with the tagging rates and tagged estimate for both LF and HF events. The final tagged estimate, the sum of all individual flavour estimates, is found to be 1630 ± 330 events in the electron channel and 2900 ± 500 events in the muon channel. The systematic uncertainties on the tagged estimate are shown in Table 7. The dominant systematic uncertainties are the HF fractions and the overall normalisation of the pretag W + jets estimate.
Systematic Electron channel (%) Muon channel (%)
HF fractions 17 15
Normalisation 9 7
b-tagging 5 5
Jet energy scale 3 3
b → µX Branching ratio 2 2
Jet energy resolution 1 2
Total 20 18
Table 7: Sources of relative systematic uncertainties in percent on the tagged W + jets background esti-
mate.
6.4 Kinematic distributions
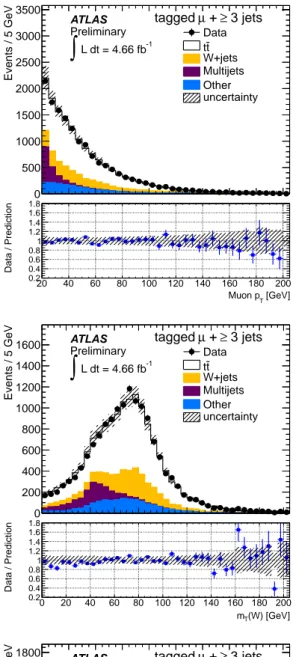
Kinematic distributions are shown at the SMT-tagged level in Figure 3 for events with at least three jets in both the electron and muon channels. The shapes for the multijet background are taken from data. In the electron channel the shape is taken from control region B, as defined in Section 6.2, where contamination from both signal and non-multijet background events in the control region have been subtracted from the data. The shape in the muon channel is taken from the loose selection in data, after the application of per-event weights obtained from the matrix method (see Section 6.1). For both channels the shapes are normalised to their respective data-driven estimates. The shape of the t¯ t signal is taken from simulation and is normalised as discussed in Section 3.
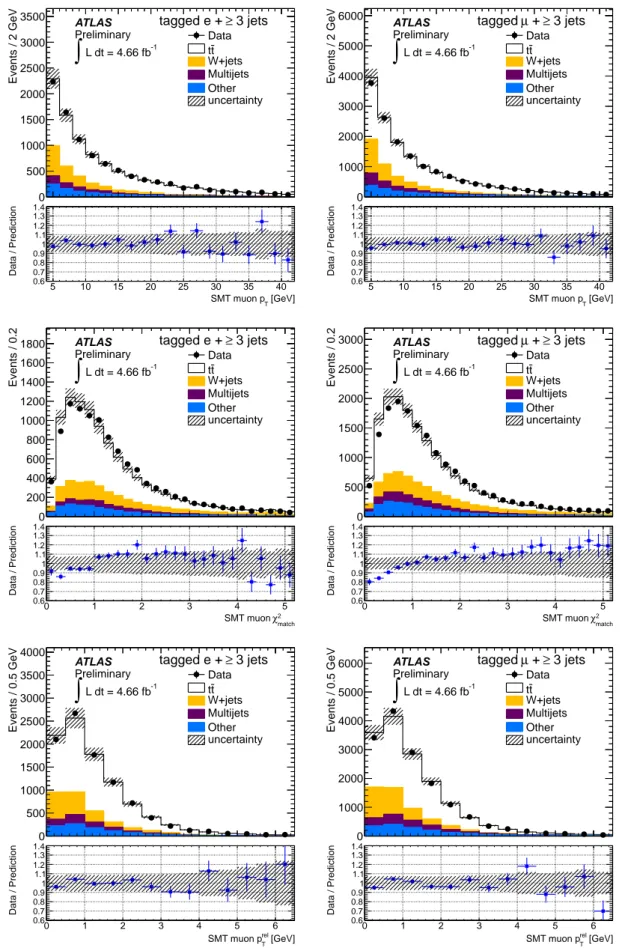
SMT muon distributions for signal and background events are shown in Figure 4. It is noted that the χ
2matchdistribution in both channels is shifted in data versus simulation. Any mis-modelling of the detector geometry in the simulation is accounted for by the χ
2matchscale factors. In addition to the transverse momentum of the soft muons, the p
relTof soft muons, defined as the momentum of the muon transverse to the jet axis, is shown in Figure 4. Good agreement is observed comparing the data to the estimated rate of multijet and W +jets summed with the other simulation predictions.
7 Systematic uncertainties
The systematic uncertainty on the cross section measurement arises from a variety of di ff erent systematic sources, as described below. These include the uncertainty on the acceptance, the background estimates, the semileptonic decay rate, b-tagging and the uncertainty on the integrated luminosity.
For each uncertainty, the combined t¯ t cross section is recalculated by summing the e + jets and µ + jets event yields, providing an uncertainty on the combined t¯ t cross section. This procedure takes into account any correlation that may be present across the e + jets and µ + jets analyses. The individual systematic un- certainties on the t¯ t cross section are summed in quadrature to provide an overall systematic uncertainty.
Reconstruction systematic uncertainties are evaluated using the simulation samples of the t¯ t signal.
The lepton trigger, reconstruction and identification MC e ffi ciencies are corrected to match the data via scale factors, to which systematic uncertainties [27, 29] are assigned. The systematic uncertainty on the t¯ t cross section is evaluated by varying each scale factor uncertainty individually. The Jet Energy Scale (JES), jet energy resolution, jet energy reconstruction e ffi ciency, jet vertex fraction and their uncertainties are described in [32]. The additional JES uncertainty on b-jets (1-2% dependent on the jet p
T) is derived from differences in b and light jet response observed in MC and is independent of the b-tagging algorithm.
Since the analysis relies on the semileptonic decay of b-jets, the effect of using a specific semileptonic b-jet JES uncertainty was also investigated. The e ff ect was found to be negligible.
The b-tagging systematic uncertainty is unique to this analysis and relies on the systematic uncer- tainty on the scale factor for the SMT mistag rate and χ
2matchefficiency, as described in Section 4.
All systematic e ff ects detailed above are evaluated on the MC backgrounds and are listed in Table 8 under ”Other Bkg Systematics”.
Signal modelling uncertainties are evaluated by using alternative simulated samples in place of the
main analysis t¯ t sample. The MC generator uncertainty covers the modelling of signal kinematics at
parton level as a result of the hard interaction in different NLO generators. This is evaluated by com-
paring the acceptance of the signal selection in A lpgen [21] and P owheg [39, 40] samples to the nominal
MC@NLO ( + H erwig/ J immy ) sample. Initial and Final State Radiation (ISR / FSR) a ff ects the number
of LF jets within the t¯ t events. The associated systematic uncertainty due to ISR/FSR is estimated by
studies using samples generated with A cer MC [22] interfaced to P ythia , and by varying the parameters
controlling ISR and FSR in a range consistent with experimental data [41, 42]. The ISR / FSR uncertainty
is found to be larger in the e +jets channel compared to the µ +jets channel since the isolation requirements
Events / 5 GeV
0 200 400 600 800 1000 1200 1400
1600 ATLAS tagged e + ≥ 3 jets Preliminary
L dt = 4.66 fb-1
∫
DatatW+jetstMultijets Other uncertainty
[GeV]
Electron pT
40 60 80 100 120 140 160 180 200
Data / Prediction
0.2 0.4 0.6 0.8 1 1.2 1.4 1.6 1.8
Events / 5 GeV
0 500 1000 1500 2000 2500 3000
3500 ATLAS tagged µ + ≥ 3 jets Preliminary
L dt = 4.66 fb-1
∫
DatatW+jetstMultijets Other uncertainty
[GeV]
Muon pT
20 40 60 80 100 120 140 160 180 200
Data / Prediction
0.2 0.4 0.6 0.8 1 1.2 1.4 1.6 1.8
Events / 5 GeV
0 200 400 600 800 1000
3 jets
≥ tagged e + ATLAS
Preliminary L dt = 4.66 fb-1
∫
DatatW+jetstMultijets Other uncertainty
(W) [GeV]
mT
40 60 80 100 120 140 160 180 200
Data / Prediction
0.2 0.4 0.6 0.8 1 1.2 1.4 1.6 1.8
Events / 5 GeV
0 200 400 600 800 1000 1200 1400
1600 ATLAS tagged µ + ≥ 3 jets Preliminary
L dt = 4.66 fb-1
∫
DatatW+jetstMultijets Other uncertainty
(W) [GeV]
mT
0 20 40 60 80 100 120 140 160 180 200
Data / Prediction
0.2 0.4 0.6 0.8 1 1.2 1.4 1.6 1.8
Events / 5 GeV
0 200 400 600 800 1000 1200
1400 ATLAS tagged e + ≥ 3 jets Preliminary
L dt = 4.66 fb-1
∫
DatatW+jetstMultijets Other uncertainty
[GeV]
miss
ET
40 60 80 100 120 140 160 180 200
Data / Prediction
0.2 0.4 0.6 0.8 1 1.2 1.4 1.6 1.8
Events / 5 GeV
0 200 400 600 800 1000 1200 1400 1600
1800 ATLAS tagged µ + ≥ 3 jets Preliminary
L dt = 4.66 fb-1
∫
DatatW+jetstMultijets Other uncertainty
[GeV]
miss
ET
20 40 60 80 100 120 140 160 180 200
Data / Prediction
0.2 0.4 0.6 0.8 1 1.2 1.4 1.6 1.8
Figure 3: From the top to the bottom, the transverse momentum p
Tof the lepton from the W, the W transverse mass m
T(W) and the transverse missing energy E
Tmissin the e +jets channel (left) and µ +jets channel (right). This figure shows only events with at least three jets and at least one SMT tagged jet.
“Other” denotes the smaller Z + jets, single top and diboson backgrounds which are estimated with Monte
12
Events / 2 GeV
0 500 1000 1500 2000 2500 3000
3500 ATLAS tagged e + ≥ 3 jets Preliminary
L dt = 4.66 fb-1
∫
DatatW+jetstMultijets Other uncertainty
[GeV]
SMT muon pT
5 10 15 20 25 30 35 40
Data / Prediction
0.6 0.7 0.8 0.9 1 1.1 1.2 1.3 1.4
Events / 2 GeV
0 1000 2000 3000 4000 5000
6000 ATLAS tagged µ + ≥ 3 jets Preliminary
L dt = 4.66 fb-1
∫
DatatW+jetstMultijets Other uncertainty
[GeV]
SMT muon pT
5 10 15 20 25 30 35 40
Data / Prediction
0.6 0.7 0.8 0.9 1 1.1 1.2 1.3 1.4
Events / 0.2
0 200 400 600 800 1000 1200 1400 1600
1800 ATLAS tagged e + ≥ 3 jets Preliminary
L dt = 4.66 fb-1
∫
DatatW+jetstMultijets Other uncertainty
match
χ2
SMT muon
0 1 2 3 4 5
Data / Prediction
0.6 0.7 0.8 0.9 1 1.1 1.2 1.3 1.4
Events / 0.2
0 500 1000 1500 2000 2500
3000 ATLAS tagged µ + ≥ 3 jets Preliminary
L dt = 4.66 fb-1
∫
DatatW+jetstMultijets Other uncertainty
match
χ2
SMT muon
0 1 2 3 4 5
Data / Prediction
0.6 0.7 0.8 0.9 1 1.1 1.2 1.3 1.4
Events / 0.5 GeV
0 500 1000 1500 2000 2500 3000 3500
4000 ATLAS tagged e + ≥ 3 jets Preliminary
L dt = 4.66 fb-1
∫
DatatW+jetstMultijets Other uncertainty
[GeV]
rel
SMT muon pT
0 1 2 3 4 5 6
Data / Prediction
0.6 0.7 0.8 0.9 1 1.1 1.2 1.3 1.4
Events / 0.5 GeV
0 1000 2000 3000 4000 5000
6000 ATLAS tagged µ + ≥ 3 jets Preliminary
L dt = 4.66 fb-1
∫
DatatW+jetstMultijets Other uncertainty
[GeV]
rel
SMT muon pT
0 1 2 3 4 5 6
Data / Prediction
0.6 0.7 0.8 0.9 1 1.1 1.2 1.3 1.4
Figure 4: From the top left to the bottom right, the transverse momentum p
T, the χ
2match(note that the cut is applied at χ
2match< 3.2) and the transverse momentum relative to the jet axis p
relTof the soft muons in the e + jets channel (left) and µ + jets channel (right). This figure shows only events with at least three jets and at least one SMT tagged jet. “Other” denotes the smaller Z + jets, single top and diboson backgrounds which are estimated with Monte Carlo. Uncertainties include statistical and systematic contributions as
13
for electrons are tighter than those for muons.
The uncertainty on the Parton Distribution Function (PDF) is evaluated using three di ff erent PDF sets, the nominal CT10 [20] as well as MSTW [36] and NNPDF [43]. The PDF are varied based on the uncertainty along each of the PDF eigenvectors. Each variation is evaluated via an event-by-event re-weighting of the signal t¯ t MC. The total uncertainty assigned to σ
t¯tis half the spread of the envelope of all PDF uncertainties.
As outlined in Section 3, the b → µX and sequential mode branching ratios are rescaled in simu- lated samples to match those in the PDG. The experimental uncertainty on each of the PDG values is propagated to the final result, yielding a systematic of 3% on the measured cross section.
The effect of different showering and hadronisation models is taken into account by comparing two samples of t¯ t events, generated by P owheg , one of which have been showered by H erwig/ J immy and the other by Pythia. To ensure that only the effects of the parton showering models are compared, rather than the difference in decay tables used by each hadronisation routine, the branching ratio of b → µX in both simulated samples is again re-weighted to match that in Ref [24] (See Table 1).
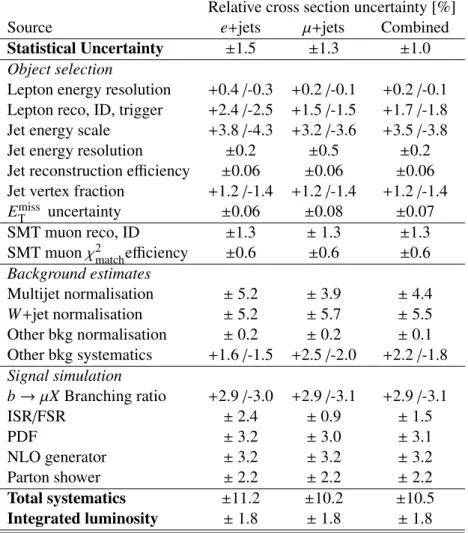
The relative uncertainty on the total integrated luminosity is 1.8% [15]. The full table of systematic uncertainties is shown in Table 8. The dominant systematic uncertainties come from the uncertainty on the multijet and W + jets backgrounds and from the jet energy scale.
Relative cross section uncertainty [%]
Source e + jets µ + jets Combined
Statistical Uncertainty ±1.5 ±1.3 ±1.0 Object selection
Lepton energy resolution + 0.4 / -0.3 + 0.2 / -0.1 + 0.2 / -0.1 Lepton reco, ID, trigger +2.4 /-2.5 +1.5 /-1.5 +1.7 /-1.8 Jet energy scale +3.8 /-4.3 +3.2 /-3.6 +3.5 /-3.8
Jet energy resolution ±0.2 ±0.5 ±0.2
Jet reconstruction efficiency ± 0.06 ± 0.06 ± 0.06 Jet vertex fraction +1.2 /-1.4 +1.2 /-1.4 +1.2 /-1.4
E
Tmissuncertainty ±0.06 ±0.08 ±0.07
SMT muon reco, ID ±1.3 ± 1.3 ±1.3
SMT muon χ
2matchefficiency ± 0.6 ± 0.6 ± 0.6 Background estimates
Multijet normalisation ± 5.2 ± 3.9 ± 4.4
W + jet normalisation ± 5.2 ± 5.7 ± 5.5
Other bkg normalisation ± 0.2 ± 0.2 ± 0.1 Other bkg systematics +1.6 /-1.5 +2.5 /-2.0 +2.2 /-1.8 Signal simulation
b → µX Branching ratio +2.9 /-3.0 +2.9 /-3.1 +2.9 /-3.1
ISR / FSR ± 2.4 ± 0.9 ± 1.5
PDF ± 3.2 ± 3.0 ± 3.1
NLO generator ± 3.2 ± 3.2 ± 3.2
Parton shower ± 2.2 ± 2.2 ± 2.2
Total systematics ±11.2 ±10.2 ±10.5
Integrated luminosity ± 1.8 ± 1.8 ± 1.8
Table 8: Summary of individual relative systematic uncertainty contributions to the cross section mea-
surement, in percent.
8 Results
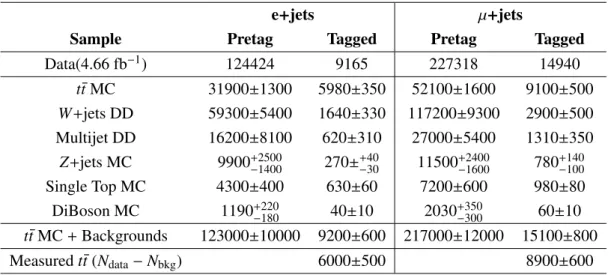
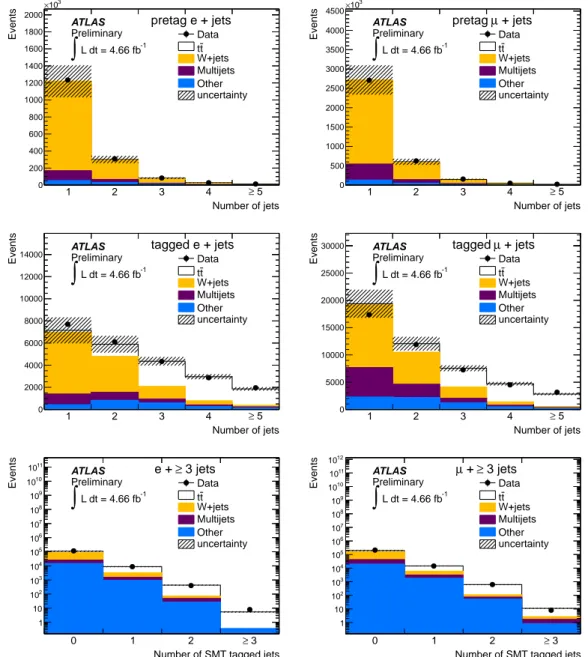
The data and background yields, including the data-driven estimates presented in Section 6, are shown in Table 9. The t¯ t signal yields have been normalised to a reference cross section of σ
tt¯= 167 pb. The sum of the expected signal and of the data-driven backgrounds together with the smaller backgrounds estimated from simulation is in agreement with the observed data within the uncertainties. Figure 5 shows the jet multiplicity for both the e and µ channels along with the number of tagged SMT b-jets in events with at least three jets.
e + jets µ + jets
Sample Pretag Tagged Pretag Tagged
Data(4.66 fb
−1) 124424 9165 227318 14940
t¯ t MC 31900±1300 5980±350 52100±1600 9100±500
W + jets DD 59300±5400 1640±330 117200±9300 2900±500
Multijet DD 16200±8100 620±310 27000±5400 1310±350
Z + jets MC 9900
+−14002500270±
+−304011500
+−16002400780
+−100140Single Top MC 4300 ± 400 630 ± 60 7200 ± 600 980 ± 80 DiBoson MC 1190
+−18022040±10 2030
+−30035060±10 t¯ t MC + Backgrounds 123000±10000 9200±600 217000±12000 15100±800
Measured t¯ t (N
data− N
bkg) 6000±500 8900±600
Table 9: Observed and estimated event yields in the pretag and tagged samples. The multijet and W +jets backgrounds are evaluated with Data Driven (DD) techniques whilst signal t¯ t and all other backgrounds are evaluated with Monte Carlo (MC) simulation. Uncertainties are quoted as the sum in quadrature of statistical and systematic contributions.
8.1 Cross section measurement
The cross section is calculated using Equation 4,
σ
tt¯= N
data− N
bkgR L dt · · BR(noFullHad) (4)
where N
dataand N
bkgare the data and background yields respectively, is the signal e ffi ciency for single- lepton and dilepton channels (note that the acceptance for the t¯ t fully hadronic channel is negligible) and BR(noFullHad) = 0.543 is the single-lepton and dilepton total branching ratio derived using a W → lν branching ratio of 0.108 per flavour (e, µ, τ) [24]. The combined t¯ t cross section is calculated by summing the e +jets and µ +jets event yields. The selection efficiencies for each measurement are given in Table 10.
The measured cross section in the e + jets, µ + jets and combined channels are:
σ
ett+jets¯= 167 ± 3(stat.) ± 20(syst.) ± 3(lumi.) pb
σ
µt¯t+jets= 164 ± 2(stat.) ± 17(syst.) ± 3(lumi.) pb
σ
tt¯= 165 ± 2(stat.) ± 17(syst.) ± 3(lumi.) pb
Number of jets
1 2 3 4 ≥ 5
Events
0 200 400 600 800 1000 1200 1400 1600 1800 2000
103
×
pretag e + jets ATLAS
Preliminary L dt = 4.66 fb-1
∫
DatatW+jetstMultijets Other uncertainty
Number of jets
1 2 3 4 ≥ 5
Events
0 500 1000 1500 2000 2500 3000 3500 4000 4500
103
×
+ jets µ pretag ATLAS
Preliminary L dt = 4.66 fb-1
∫
DatatW+jetstMultijets Other uncertainty
Number of jets
1 2 3 4 ≥ 5
Events
0 2000 4000 6000 8000 10000 12000
14000 ATLAS tagged e + jets
Preliminary L dt = 4.66 fb-1
∫
DatatW+jetstMultijets Other uncertainty
Number of jets
1 2 3 4 ≥ 5
Events
0 5000 10000 15000 20000 25000
30000 ATLAS tagged µ + jets
Preliminary L dt = 4.66 fb-1
∫
DatatW+jetstMultijets Other uncertainty
Number of SMT tagged jets
0 1 2 ≥ 3
Events
1 10 102
103
104
105
106
107
108
109
1010
1011 ATLAS e + ≥ 3 jets Preliminary
L dt = 4.66 fb-1
∫
DatatW+jetstMultijets Other uncertainty
Number of SMT tagged jets
0 1 2 ≥ 3
Events
1 10 102
103
104
105
106
107
108
109
1010
1011
1012
3 jets
≥ µ + ATLAS
Preliminary L dt = 4.66 fb-1
∫
DatatW+jetstMultijets Other uncertainty