ATLAS-CONF-2012-149 12November2012
ATLAS NOTE
ATLAS-CONF-2012-149
November 10, 2012
Measurement of the top quark pair production cross section in the single-lepton channel with ATLAS in proton-proton collisions at 8 TeV
using kinematic fits with b-tagging
The ATLAS Collaboration
Abstract
A measurement of the top quark pair (t¯
t) inclusive production cross section inppcolli- sions at a centre-of-mass energy of
√s=
8 TeV is presented. Data were collected with the ATLAS detector at the CERN Large Hadron Collider. The analysis has been done in the lepton+jets final state in a dataset corresponding to an integrated luminosity of 5.8 fb
−1. A multivariate technique and
b-jet identification were employed to separate the signaltt¯ events from the various backgrounds. The inclusive
tt¯ production cross section is measured to be
σtt¯=241
±2 (stat.)
±31 (syst.)
±9 (lumi.) pb and is in good agreement with the theoretical prediction
σtheor.t¯t =238
+22−24pb.
c Copyright 2012 CERN for the benefit of the ATLAS Collaboration.
Reproduction of this article or parts of it is allowed as specified in the CC-BY-3.0 license.
1 Introduction
The top quark is the heaviest fermion discovered so far. According to the Standard Model (SM), it has the largest Yukawa coupling with the Higgs boson. It may also couple to other heavy particles predicted by extensions of the SM. Additional processes beyond the SM can modify the top pair (t t) production ¯ rate, therefore a measurement of the t t ¯ inclusive production cross section
σt¯tmay reveal the presence of new physics. It can also help to verify the state-of-the-art theoretical cross section calculations, and to better understand t t ¯ production as one of the primary backgrounds in many searches for physics beyond the SM.
The inclusive top quark pair production cross section has been measured by the ATLAS experiment in pp collisions at 7 TeV [1] and by CMS at 7 TeV [2] and 8 TeV [3]. All measurements have been found to be in good agreement with theoretical predictions for these energies. The predicted t t ¯ cross section for
pp collisions at a centre-of-mass energy of
√s
=8 TeV is
σtheor.t¯t =
238
+22−24pb for a top quark mass of 172.5 GeV. It has been calculated at approximate next-to-next-to-leading order (NNLO) in QCD with HATHOR 1.2 [4].
In the SM, the top quark decays to a W boson and a b-quark with a branching ratio close to 100%.
The final event signature depends on the decay of the W boson. This analysis is based on final states where one of the W bosons decays leptonically into an electron or muon together with the corresponding neutrino, and the other decays hadronically. In this case the final state is characterized by the presence of a highly energetic and well isolated lepton, large missing transverse energy carried away by a neutrino, and at least four jets, two of which originate from b-quarks. Due to jet merging, the finite detector coverage, and jet reconstruction efficiencies it is possible to miss one of the four expected jets, leading to a three jet configuration in the final state. Therefore candidate events are selected by requiring at least three jets, with at least one of them identified as a b-jet. A multivariate likelihood method is used to provide signal-to-background discrimination. The number of t t ¯ events in data is determined from a fit to a distribution of the multivariate likelihood discriminant in data to a sum of signal and background distributions (“templates”). This number is then converted to the t t ¯ production cross section using the total integrated luminosity and the t t ¯ event selection efficiency. The latter is obtained using Monte Carlo (MC) simulation.
The note is organized as follows. The ATLAS detector and the data sample are described in Section 2.
The MC samples for signal and backgrounds are listed in Section 3. Event selection and object definition are discussed in Section 4. Section 5 is devoted to the determination of the multijet background. The measurement strategy is outlined in Section 6. Section 7 lists the sources of systematic uncertainties considered in the analysis. Finally, the results of the analysis are summarized in Section 8.
2 ATLAS detector and data sample
The ATLAS detector [5] at the LHC covers nearly the entire solid angle around the collision point.
It consists of an inner tracking detector surrounded by a thin superconducting solenoid, electromagnetic and hadronic calorimeters, and an external muon spectrometer incorporating three large superconducting toroid magnet assemblies.
The 8 TeV centre-of-mass energy data used in the analysis have been collected between April and June 2012 using single lepton (electron or muon) triggers. After data quality requirements, the amount of data used by the analysis corresponds to an integrated luminosity of 5.8 fb
−1. The average number of
pp collisions per bunch crossing in the dataset is 19.3.
3 Signal and background simulation
The nominal MC sample used for the simulation of the t t ¯ events was produced using the MC@NLO v4.01 [6] event generator with the CT10 [7] parton distribution functions. The parton shower and the underlying event simulation were performed with HERWIG v6.520 [8] and JIMMY v4.31 [9], respec- tively, using the AUET2 tune [10]. Additional t t ¯ samples used to estimate various systematic effects were generated with POWHEG [11] interfaced to HERWIG/JIMMY, POWHEG interfaced to PYTHIA v6.4 [12], A
MC generator v3.8 [13] interfaced to PYTHIA, and ALPGEN v2.13 [14] interfaced to HERWIG/JIMMY. Two samples of t t ¯ events produced at a centre-of-mass energy of
√s
=7 TeV us- ing the MC@NLO and ALPGEN generators were used for evaluation of the systematic uncertainty due to MC modelling of the signal. Both samples were reweighted using PDF rescaling to match the t t ¯ production at
√s
=8 TeV.
The backgrounds are expected to originate from vector boson production with associated jets (W+jets and Z/γ
∗+jets), single top, diboson (WW, WZ, ZZ), and multijet production. All backgrounds ex- cept that from multijet production in the
µ+jets channel were simulated with MC. The dominant back-ground (vector boson production with associated jets) was simulated using ALPGEN interfaced to HER- WIG/JIMMY. The W+jets normalization was derived from a fit to the data as explained in Section 8.
The contribution from single top quark production was simulated with MC@NLO interfaced to HER- WIG/JIMMY for the s- and Wt-channels, and with A
MC interfaced to PYTHIA for the t-channel, and normalized to approximate NNLO theoretical cross sections [15–17]. Finally, diboson production was simulated with HERWIG.
All generated events were passed through the full ATLAS detector simulation [18] based on GEANT4 [19] and then processed with the same reconstruction chain as the data. MC events were overlaid with ad- ditional minimum bias events generated with PYTHIA to simulate the effect of additional proton-proton interactions. The multijet background was estimated using the methods described in Section 5.
4 Event selection
The present analysis relies on the measurement of jets, electrons, muons and the magnitude of the miss- ing transverse energy E
Tmiss. Jets were reconstructed using the anti-k
talgorithm [20] with a distance parameter R
=0.4. Jets from additional proton-proton interactions were suppressed by requiring the jet vertex fraction (JVF) to be larger than 0.5. The JVF value is defined using tracks matched to the jet as the ratio of the scalar sum of transverse momenta of tracks associated to the primary vertex to that of all tracks. Jets were b-tagged using the MV1 [21] algorithm at 70% b-tagging efficiency operating point. Data-to-MC corrections derived for this tagger were used to compensate the differences between the tagger algorithm performance on data and MC. For that purpose, the results obtained with 7 TeV data [21–24] have been updated with 8 TeV data.
Electrons were identified as energy clusters in the electromagnetic calorimeter matched to a recon- structed track in the inner detector and fulfilling additional isolation requirements in both the calorimeter and the inner detector. Electrons were required to have transverse energy E
T >40 GeV and pseudora- pidity in the range
|η| <2.47 excluding the region 1.37
< |η| <1.52. Muons were reconstructed using information from the muon spectrometer and the inner detector. They were required to have transverse momentum p
T >40 GeV and pseudorapidity
|η| <2.5. As for electrons, isolation criteria were im- posed on muons in both the calorimeter and the inner detector. Both electrons and muons in MC were corrected to reflect the performance observed in the data. The missing transverse energy E
Tmisswas calcu- lated from the vectorial energy sum of all topological clusters in the calorimeter and transverse momenta of reconstructed muons. More details on the reconstruction of objects can be found in [25].
The events were selected using the following criteria:
•
the appropriate single-electron or single-muon trigger fired;
•
a primary vertex reconstructed from at least five tracks;
•
at least three jets with p
T >25 GeV and
|η|<2.5;
•
a reconstructed electron with E
T >40 GeV or muon of p
T >40 GeV matching the corresponding high level trigger object;
•
no second lepton (reconstructed electron with E
T >25 GeV or muon with p
T >25 GeV);
•
in the e+jets channel: E
missT >30 GeV and the transverse mass of the W boson
1m
T(W)
>30 GeV;
•
in the
µ+jets channel:E
Tmiss>20 GeV and m
T(W)
+E
Tmiss>60 GeV;
•
at least one selected jet in the event must be identified as a b-jet.
Compared to the previous analyses [1, 26] the electron E
Tand muon p
Tcuts were increased to control the multijet background.
The number of events observed in data and expected yield of events based on simulation are summa- rized in Table 1.
Table 1: The numbers of expected events from signal and backgrounds and numbers of events observed in data. The multijet uncertainty is assumed to be 50%. All other uncertainties are derived using theoretical cross section uncertainties only.
e+
≥3 jets
µ+≥3 jets t t ¯ 31000
+2900−310044000
±4000 W+jets 5700
±2400 9000
±4000 Multijet 1900
±900 1100
±500 Z+jets 1400
±600 1200
±500 Single top 3260
±160 4610
±230
Dibosons 115
±6 158
±8
Total Expected 43000
±4000 61000
±6000
Data 40794 58872
5 Multijet background evaluation
Events with vector bosons in the final state, as selected by single lepton triggers, are characterized by the presence of high- p
Tisolated leptons. The processes that give rise to “fake” leptons (either non-isolated leptons or objects mimicking isolated leptons) include semileptonic b-quark decays, photon conversions, decays of long-lived particles that produce an electron or a muon in the decay chain, or mis-identification of jets as electrons.
Two different methods were employed in this analysis for the fake lepton background evaluation. The Matrix Method (MM) [27] was used to obtain the estimation of the fake lepton background in the
µ+jetschannel. In this method, the probability for a high- p
Tsinal lepton to pass the standard event selection
1The transverse mass is defined asmT(W)= q
2pℓTpνT(1−cos(φℓ−φν)), wherepT is the transverse momentum,φis the azimuthal angle, andℓandνrefer to the charged lepton and the neutrino, respectively.
criteria was derived with data in the high E
Tmiss>80 GeV region free of fake lepton contamination. Theprobability for a fake lepton to pass the same criteria was obtained from the low E
missT <20 GeV regionafter the subtraction of the contribution from the W/Z decays as predicted by MC. In the e+jets channel, the Jet-electron method [25] using a dijet sample simulated with PYTHIA was applied. The shape of the fake lepton background was determined by selecting events with similar kinematics to the signal selection, with jets mimicking electrons. The background from photon conversions was suppressed by demanding at least four tracks to be associated with the jet. The estimation of the multijet background obtained with the Jet-electron method was performed by fitting the E
missTdistribution.
6 Analysis method
The analysis strategy is as follows. The number of t t ¯ events is obtained from the data using a likelihood discriminant template fit. The likelihood discriminant function is constructed using the projective like- lihood method defined in the TMVA package [28]. The likelihood discriminant for event i is defined as the ratio of the signal likelihood L
isto the sum of signal and background likelihoods (L
is+L
ib):
D
i=L
is(L
is+L
bi) (1)
The signal and background likelihoods are defined as products of the corresponding probability den- sity functions of each kinematic variable used in the likelihood. For the likelihood construction, the t¯ t and W+jets events are considered as signal and background, respectively. After the likelihood discrim- inant function is constructed, binned distributions (templates) are made for the t t ¯ signal and each of the backgrounds.
The variables used in the likelihood are lepton pseudorapidity
ηland the transformed event aplanarity A
′=exp(
−8A), where the (regular) aplanarity A is defined as A
= 32λ3,
λ3being the smallest eigenvalue of the normalized momentum tensor calculated using the momenta of all jets and the lepton. The A
→A
′transformation is done in order to increase the separation power of the aplanarity distribution as discussed in Ref. [29].
The number of t t ¯ events in each channel j is obtained by minimizing the log-likelihood function
Xi
νi j−
n
i j+n
i jln n
i j−n
i jln
νi j,(2)
where the sum is taken over all template bins i. The observed number of events is n
i j, while
νi jis the expected number of events. The latter is defined as
νi j=
p
t¯ts
i j+p
Wjb
i j+m
i j,(3)
where s
i j, b
i j, and m
i jare the predicted numbers of events for the t t ¯ signal, the W+jets, and other back- grounds (Z+jets, single top, dibosons, and multijet), respectively, and p
t¯t, p
Wjare the parameters of the fit (equal to 1 for a cross section equal to the MC expectation). The resulting value of the fit parameter
p
tt¯is used to extract the number of t t ¯ events in the data.
The combination of the e+jets and
µ+jets channels is done by minimizing the sum of (2) over bothchannels. The contributions from W+jets are fitted separately in the e+jets and
µ+jets channels. Thisis done because the W+jets fraction variation can absorb uncertainties in other backgrounds, notably in Z+jets (see further discussion in Section 7).
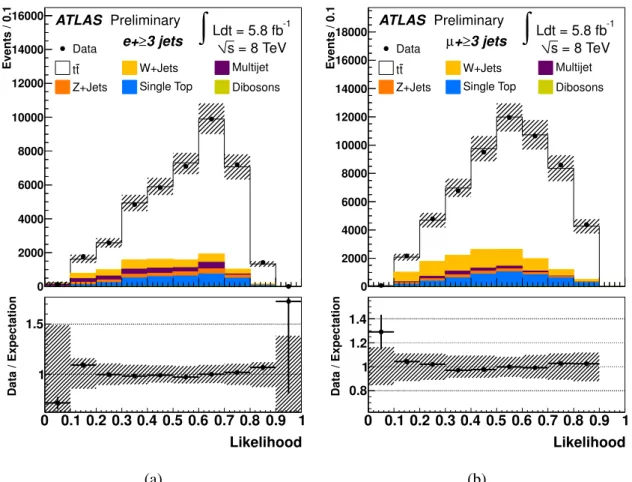
The likelihood discriminant distribution in data fitted to the sum of the signal and background tem-
plates is shown in Fig. 1. An example of the comparison between data and MC for the likelihood variables
Events / 0.1
0 2000 4000 6000 8000 10000 12000 14000 16000
3 jets
≥ e+
ATLAS Preliminary -1
Ldt = 5.8 fb
∫
s = 8 TeVData t
t W+Jets Multijet
Z+Jets Single Top Dibosons
Likelihood 0 0.1 0.2 0.3 0.4 0.5 0.6 0.7 0.8 0.9 1
Data / Expectation
1 1.5
Events / 0.1
0 2000 4000 6000 8000 10000 12000 14000 16000 18000
3 jets
≥ µ+
ATLAS Preliminary -1
Ldt = 5.8 fb
∫
s = 8 TeVData t
t W+Jets Multijet
Z+Jets Single Top Dibosons
Likelihood 0 0.1 0.2 0.3 0.4 0.5 0.6 0.7 0.8 0.9 1
Data / Expectation 0.8 1 1.2 1.4
(a) (b)
Figure 1: Fit to the likelihood discriminant distribution D(η
l,A
′) in data in the e+jets (a) and
µ+jets (b)channels. The hatched bands display the combined expected statistical and systematic uncertainty.
after the fit is shown in Fig. 2. Figures 3 and 4 show distributions of basic kinematic quantities after the fit in both channels.
The t¯ t production cross section is calculated as
σtt =
N
t¯tL ×
BR
×εsig,(4)
where
Lis the integrated luminosity, BR is the combined branching ratio for dileptonic and semileptonic t¯ t decays, and
εsigis the product of the signal acceptance and efficiency calculated on a t¯ t sample without fully-hadronic decays.
The fitted numbers N
tt¯of t t ¯ events and the corresponding cross sections are shown in Table 2. The quoted statistical uncertainties are evaluated from the fit. The fitted W+jets scale factors p
Wjare found to be 0.54
±0.05 (stat.) in the e+jets channel and 0.73
±0.04 (stat.) in the
µ+jets channel. The correlationcoefficent between the t t ¯ and W+jets fractions is found to be
−0.7 for both channels.
7 Systematic uncertainties
The systematic uncertainties relevant to this analysis fall into several categories. The instrumental sys-
tematic uncertainties are related to the reconstruction of jets and E
missT(jet energy scale, jet energy res-
olution, jet reconstruction efficiency, soft jet related uncertainties in E
missTcalculations), and leptons
Events / 0.05
0 1 2 3 4 5
103
×
3 jets
≥ e+
ATLAS Preliminary -1
Ldt = 5.8 fb
∫
s = 8 TeVData t
t W+Jets Multijet
Z+Jets Single Top Dibosons
A’
0 0.2 0.4 0.6 0.8 1
Data / Expectation 0.8 1 1.2 1.4
Events / 0.25
0 1 2 3 4 5 6 7
103
×
3 jets
≥ µ+
ATLAS Preliminary -1
Ldt = 5.8 fb
∫
s = 8 TeVData t
t W+Jets Multijet
Z+Jets Single Top Dibosons
η muon
-3 -1.8 -0.6 0.6 1.8 3
Data / Expectation 0.8 1 1.2 1.4
(a) (b)
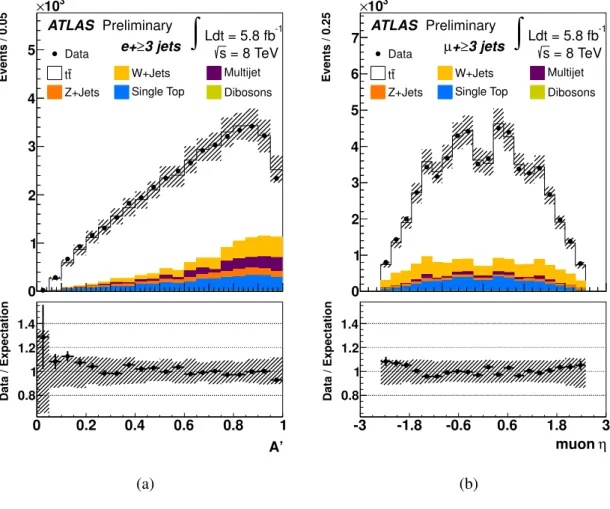
Figure 2: Transformed aplanarity A
′distribution in the e+jets channel (a) and muon pseudorapidity
ηdistribution in the
µ+jets channel (b). The distributions in the data (dots) are compared to the modelexpectations, which include both signal and background processes. The hatched bands display the com- bined expected statistical and systematic uncertainty.
Table 2: Number of t¯ t events and corresponding cross sections obtained from the likelihood fit to data together with their statistical uncertainties.
Channel N
tt¯ σtt¯(pb)
e+
≥3 jets 31050
±350 239
±3
µ+≥3 jets 45000
±400 242
±2
l+
≥3 jets 76000
±500 241
±2
Events / 10 GeV
0 2 4 6 8 10 12
103
×
3 jets
≥ e+
ATLAS Preliminary -1
Ldt = 5.8 fb
∫
s = 8 TeVData t
t W+Jets Multijet
Z+Jets Single Top Dibosons
[GeV]
miss
ET
0 40 80 120 160 200
Data / Expectation 0.8 1 1.2 1.4
Events / 10 GeV
0 1 2 3 4 5 6 7 8 9
103
×
3 jets
≥ e+
ATLAS Preliminary -1
Ldt = 5.8 fb
∫
s = 8 TeVData t
t W+Jets Multijet
Z+Jets Single Top Dibosons
[GeV]
W
mT
0 40 80 120 160 200
Data / Expectation 0.8 1 1.2 1.4
Events / 10 GeV
0 2 4 6 8 10 12 14 16
103
×
3 jets
≥ e+
ATLAS Preliminary -1
Ldt = 5.8 fb
∫
s = 8 TeVData t
t W+Jets Multijet
Z+Jets Single Top Dibosons
[GeV]
electron ET
0 40 80 120 160 200
Data / Expectation 0.8 1 1.2 1.4
(a) (b) (c)
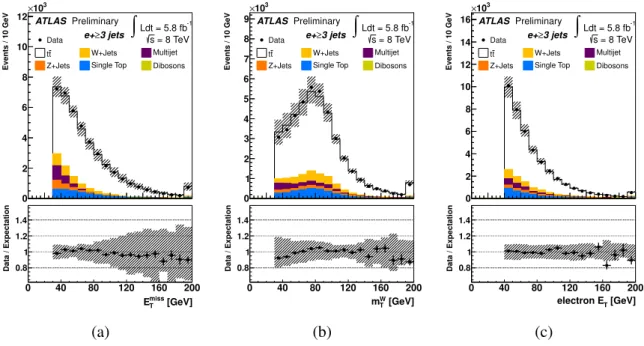
Figure 3: Missing transverse energy (a), transverse W mass (b), and electron E
T(c) distributions in the e+jets channel. The distributions in the data (dots) are compared to the model expectations, which in- clude both signal and background processes. The hatched bands display the combined expected statistical and systematic uncertainty.
Events / 10 GeV
0 2 4 6 8 10 12
103
×
3 jets
≥ µ+
ATLAS Preliminary -1
Ldt = 5.8 fb
∫
s = 8 TeVData t
t W+Jets Multijet
Z+Jets Single Top Dibosons
[GeV]
miss
ET
0 40 80 120 160 200
Data / Expectation 0.8 1 1.2 1.4
Events / 10 GeV
0 2 4 6 8 10 12
103
×
3 jets
≥ µ+
ATLAS Preliminary -1
Ldt = 5.8 fb
∫
s = 8 TeVData t
t W+Jets Multijet
Z+Jets Single Top Dibosons
[GeV]
W
mT
0 40 80 120 160 200
Data / Expectation 0.8 1 1.2 1.4
Events / 10 GeV
0 5 10 15 20 25
103
×
3 jets
≥ µ+
ATLAS Preliminary -1
Ldt = 5.8 fb
∫
s = 8 TeVData t
t W+Jets Multijet
Z+Jets Single Top Dibosons
[GeV]
muon pT
0 40 80 120 160 200
Data / Expectation 0.8 1 1.2 1.4
(a) (b) (c)
Figure 4: Missing transverse energy (a), transverse W mass (b), and muon p
T(c) distributions in the
µ+jets channel. The distributions in the data (dots) are compared to the model expectations, which in-clude both signal and background processes. The hatched bands display the combined expected statistical
and systematic uncertainty.
(momentum/energy scale and resolution, trigger efficiency, reconstruction and lepton identification ef- ficiency), as well as the b-tagging performance uncertainty. All of these uncertainties are evaluated by performing ensemble tests using modified likelihood templates for signal and background. The dominant instrumental systematic uncertainty (6%) is due to the jet energy scale, and here mostly due to its impact on the signal reconstruction efficiency.
For the multijet contribution, the variation of results due to scaling of the background up and down by 50%, as well as the difference between results obtained using the Matrix Method and the Jet-electron model, were used as a systematic uncertainty. Because of the low level of multijet background in the selected sample the systematic uncertainty on the cross section
σtt¯due to multijet modelling is small (about 1%).
As discussed in Section 6, the contributions from W+jets are fitted separately in the e+jets and
µ+jetschannels to allow for absorption of uncertainties in other backgrounds. To verify the fitting procedure, W+jets and Z+jets were merged into a single template and the combined fit was performed with the W/Z+jets cross section forced to be the same in both channels. The difference in the t t ¯ cross section obtained by the two methods is small (0.2%).
The systematic uncertainty related to the modelling of W+jets, which results in a variation of likeli- hood template shapes, is found to be small (<1%). The systematic uncertainty due to single top, diboson, and Z+jets production is evaluated by varying their cross sections [27]. The effect on the t¯ t cross section is also small (about 1%).
The uncertainty due to the modelling of Initial/Final State Radiation (ISR/FSR) is estimated using t t ¯ events produced with the A
MC generator interfaced with PYTHIA, where the parameters controlling ISR/FSR were varied in a range suggested by the data in the rapidity gap analysis [30, 31]. The resulting
σtt¯uncertainty is 4%. The systematic uncertainty due to MC modelling of the t t ¯ production process is estimated by comparing results obtained with MC@NLO, POWHEG, and ALPGEN signal samples.
This uncertainty is found to be 6%. In addition, there are uncertainties due to parton distribution functions (PDF) 6% and the choice of the parton shower model, the latter being estimated by comparing results obtained with POWHEG interfaced to PYTHIA and HERWIG (6%). Finally, the luminosity uncertainty, measured using techniques similar to those described in [32, 33], is 3.6%. This uncertainty is quoted separately.
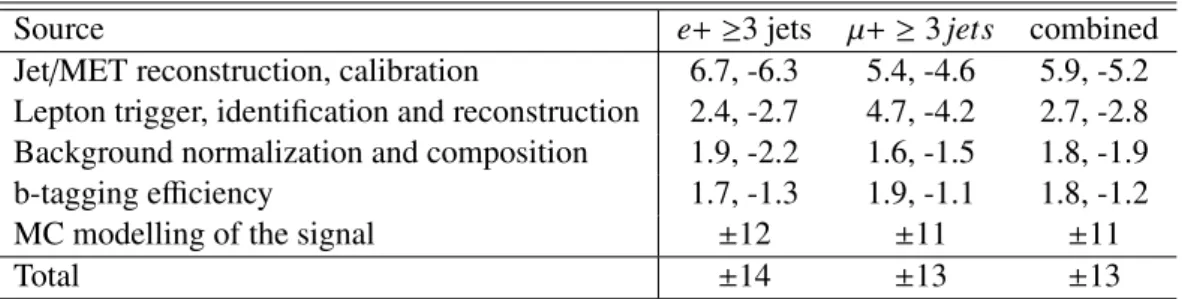
The systematic uncertainties on the inclusive t t ¯ cross section measurement are summarized in Ta- ble 3. The uncertainties due to ISR/FSR, MC generator modelling, PDF, and parton shower model are combined in a single category named “MC modelling of the signal.”
Table 3: Systematic uncertainties (%) on the inclusive t t ¯ cross section measurement in the lepton+jets channel.
Source e+
≥3 jets
µ+≥3 jets combined
Jet/MET reconstruction, calibration 6.7, -6.3 5.4, -4.6 5.9, -5.2 Lepton trigger, identification and reconstruction 2.4, -2.7 4.7, -4.2 2.7, -2.8 Background normalization and composition 1.9, -2.2 1.6, -1.5 1.8, -1.9
b-tagging efficiency 1.7, -1.3 1.9, -1.1 1.8, -1.2
MC modelling of the signal
±12
±11
±11
Total
±14
±13
±13
The t t ¯ production cross section is determined under the assumption of a fixed top quark mass m
top=172.5 GeV. Using the t¯ t MC samples generated with m
top =170 and 175 GeV, it is observed that the
result varies by
∓1% when m
topchanges by
±2.5 GeV. This variation is not included in the systematic
uncertainty.
8 Summary of results
A measurement of the inclusive t t ¯ production cross section in pp collisions at
√s
=8 TeV using the ATLAS detector at the Large Hadron Collider has been performed using a data set corresponding to an integrated luminosity of 5.8 fb
−1. The cross section is found to be
σtt¯=