ATLAS-CONF-2015-022 28June2015
ATLAS NOTE
ATLAS-CONF-2015-022
27th June 2015
Measurement of jet fragmentation in 5.02 TeV proton-lead and 2.76 TeV proton-proton collisions with the ATLAS detector
The ATLAS Collaboration
Abstract
A measurement of jet fragmentation functions into charged particles in √
sNN =5.02 TeV p+Pb collisions and pp collisions at √
s = 2.76 TeV is presented. The analysis utilizes 28 nb−1 of p+Pb data and 4.0 pb−1 of ppdata both collected in 2013 by the ATLAS de- tector at the LHC. The measurement is reported in the center of mass frame in the range
|yjet∗ |<1.6 as a function of the charged-particle longitudinal momentum fraction and for jets
with transverse momentum 45< pT <260 GeV and charged particles withpT > 3.5GeV.
The √
s=2.76 TeVppfragmentation functions were extrapolated to √
s=5.02 TeV in or- der to provide a comparison for thep+Pb fragmentation functions. Differences are observed between the fragmentation functions measured inp+Pb collisions and the extrapolated pp fragmentation functions at high-zwhich are not statistical in nature.
c
2015 CERN for the benefit of the ATLAS Collaboration.
Reproduction of this article or parts of it is allowed as specified in the CC-BY-3.0 license.
1 Introduction
Heavy ion collisions at collider energies are performed in order to produce and study the quark-gluon plasma (QGP), a phase of QCD matter which emerges at high temperature. Measurements of jets and their modifications in such collisions are powerful tools to determine the properties of this matter. The rates of jet production [1] are observed to be modified in a centrality dependent manner in lead-lead (Pb+Pb) collisions. In addition, the charged particle longitudinal fragmentation functions are also observed to be modified in Pb+Pb collisions [2, 3]. Those results provide evidence for partonic energy loss in the QGP.
Proton-proton collisions (pp) provide a reference for jet properties to which the heavy ion data can be compared. Furthermore, proton-nucleus collisions are studied in order to investigate possible effects arising from the difference between a nucleon and a nucleus in the initial state of the collision. Jet mea- surements in this data sample can provide information regarding the modifications to parton distribution functions within a large nucleus, for example (for a recent compilation see Ref. [4]). Parameterizations of parton distribution functions in nuclei based on the present world data are available in nuclear parton distribution function sets (nPDFs), such as EPS09 [5].
Inclusive jet production in proton-lead (p+Pb) collisions was measured and found to agree with expec- tations from EPS09 nPDFs [6]. High-pT charged hadrons dominantly originate from the fragmentation of jets. If the process of jet fragmentation is unmodified betweenppandp+Pb collisions, the production of charged particles inp+Pb collisions is expected to be comparable to their production inppcollisions in the same way as the jet production. However, both CMS [7] and ATLAS [8] have observed a signif- icant excess of highpTcharged hadron yields compared to expectations from ppcollisions. CMS have compared their measurement to the EPS09 nPDF expectations and the measured excess was found to be significantly greater than the expectations from that calculation.
One possible explanation is that there is an unexpected modification to the parton showering process from the aftermath of the p+Pb collision itself. Another possibility is that relative contributions from quark and gluon jets to the inclusive jet spectrum is altered in p+Pb collisions with respect to pp collisions at the same center of mass energy leading to observed differences in the charged particle production due to differences in the fragmentation of gluon initiated and quark initiated jets. The results of the measurements of the jet and charged particle yields inp+Pb collisions suggest some modification to the fragmentation functions of jets inp+Pb collisions. Charged particle longitudinal fragmentation function measurements inp+Pb andppcan provide useful additional information on the relationship between these two measurements. Furthermore, these jet fragmentation measurements are central to the interpretation of the observed modification of fragmentation functions in Pb+Pb collisions since similar effects are also present also in heavy ion collisions.
In this note, the jet internal structure is studied using jets measured in the calorimeter and charged particles reconstructed in the tracking system. The charged particles were associated with the jets based on an angular matching∆R < 0.4, where∆R = p
∆η2+∆φ2and∆η and∆φare the distance between the jet axis and the charged particle position in pseudorapidity and azimuth1respectively. Results are presented
1 ATLAS uses a right-handed coordinate system with its origin at the nominal interaction point (IP) in the centre of the detector and thez-axis along the beam pipe. Thex-axis points from the IP to the centre of the LHC ring, and theyaxis points upward.
Cylindrical coordinates (r, φ) are used in the transverse plane, φbeing the azimuthal angle around the beam pipe. The pseudorapidity is defined in terms of the polar angleθasη=−ln tan(θ/2).
for fragmentation functions:
D(z) ≡ 1 Njet
dNch
dz , (1)
where Nch is the number of charged particles, Njet is the number of jets under consideration and z is defined as:
z ≡ pTtrk pjetT
cos∆R (2)
wherepTtrkandpjetT are the charged particle and jet transverse momenta, respectively.
The resulting fragmentation functions are presented forp+Pb and ppcollisions as a function of pjetT in the centre-of-mass rapidity2 interval |y∗jet| < 1.6. The fragmentation functions in p+Pb were compared to a √
s = 5.02 TeV pp reference constructed by extrapolating the √
s = 2.76 TeV pp fragmentation functions to the higher collision energy using Monte Carlo (MC) generators to model the collision energy dependence. The observable of interest is the ratio of the fragmentation functions inp+Pb collisions to ppcollisions at the same center of mass energy:
RD(z) ≡ D(z)pPb
D(z)p p (3)
This quantity is a measure of the modification of the fragmentation functions in p+Pb collisions with respect to ppcollisions. The measurement of the RD(z) is reported in six intervals ofpTjetbetween 45 and 260 GeV.
2 Experimental Setup
The measurements presented in this note were performed using the ATLAS calorimeter, inner detector, trigger, and data acquisition systems [9]. The calorimeter system consists of a sampling liquid argon (LAr) electromagnetic (EM) calorimeter with lead as the absorber covering|η| < 3.2, a steel–scintillator sampling hadronic calorimeter covering|η| < 1.7, a LAr hadronic calorimeter covering 1.5 < |η| <3.2, and two LAr forward calorimeters (FCal) covering 3.2 < |η| < 4.9. The hadronic calorimeter has three sampling layers longitudinal in shower depth and has a∆η ×∆φgranularity of 0.1×0.1 for |η| < 2.5 and 0.2×0.2 for 2.5 < |η| < 4.9.3 The EM calorimeters are segmented longitudinally in shower depth into three compartments with an additional pre-sampler layer. The EM calorimeter has a granularity that varies with layer and pseudorapidity, but which is generally much finer than that of the hadronic calorimeter. The middle sampling layer, which typically has the largest energy deposit in EM showers, has a granularity of 0.025×0.025 over|η| <2.5.
The inner detector measures charged particles within the pseudorapidity interval|η| <2.5 using a combi- nation of silicon pixel detectors, silicon microstrip detectors (SCT), and a straw-tube transition radiation tracker (TRT), all immersed in a 2 T axial magnetic field. All three detectors are composed of a barrel and two symmetrically placed end-cap sections. The pixel detector is composed of three layers of sensors with a nominal pixel size of 50µm× 400µm. The SCT barrel section contains 4 layers of modules with
2The rapidityy∗is defined asy∗ =1/2 lnEE−p+pz
z whereEandpz are the energy and the component of the momentum along the proton beam direction in the nucleon–nucleon centre-of-mass frame.
3An exception is the third sampling layer that has a segmentation of 0.2×0.1 up to|η|=1.4.
80 µm pitch sensors on both sides, while each end-cap consists of nine layers of double-sided modules with radial strips having a mean pitch of 80 µm. The two sides of each SCT layer in both the barrel and the end-caps have a relative stereo angle of 40 mrad. The TRT contains up to 73 (160) layers of staggered straws interleaved with fibres in the barrel (end-cap). Charged particles typically traverse 36 TRT straws.
3 Event Selection and Data Sets
Thep+Pb data presented here were recorded in early 2013. The LHC was configured with a 4 TeV proton beam and a 1.57 TeV per nucleon Pb beam that together produced collisions with √
sNN =5.02 TeV and a rapidity shift of the centre-of-mass frame,∆y =0.465 units, relative to the ATLAS rest frame. The run was split into two periods, with two distinct beam configurations. The first period provided approximately 55% of the integrated luminosity with the Pb beam travelling to positive rapidity and the proton beam to negative rapidity. The remaining data was taken with the beams of protons and Pb nuclei switched. The measurement of fragmentation functions forp+Pb collisions is performed iny∗jet = yjet−∆y values and forppcollisions in y∗jet = yjetvalues, which makes them directly comparable. The total p+Pb integrated luminosity after applying selection cuts described in this section is 28 nb−1. Approximately 4 pb−1 of
√s =2.76 TeV ppdata from 2013 was used. The luminosity conditions provided by the LHC result in an average number ofp+Pb interactions per bunch crossing (pile-up) of 0.03. Duringppdata taking, the pile-up varied from 0.3 to 0.6 collisions per crossing.
ATLAS has a three-level trigger system designed for the selection of potentially interesting events. The Level-1 is implemented with custom electronics. The Level-2 and Event Filter (EF, third-level) are software-based. Together, the Level-2 and EF are collectively called the high level trigger (HLT). Events used in this analysis were selected by a sequence of Level-1 and Level-2 minimum-bias triggers, and Level-1 jet triggers, and event filter (EF) jet triggers performing the final decision.
Level-1 minimum-bias triggers were based on the minimum-bias trigger scintillator (MBTS) counters [9].
The MBTS detects charged particles over 2.1< |η| < 3.9 using two counters placed atz =±3.6 m. Each counter is divided into 16 sections, each of which provides measurements of both the pulse heights and arrival times of ionization energy deposits. The trigger selecting minimum-bias events required hits in at least one counter in each side of the MBTS detector. The EF jet trigger, used both inp+Pb collisions andppcollisions, selected from events passing the minimum-bias trigger. It operated a jet reconstruction algorithm similar to that applied in the offline analysis. It selected events containing anR=0.4 jet with different thresholds on the transverse energy of the jet ranging from 20 GeV to 75 GeV.
The offlinep+Pb event selection requires a reconstructed vertex, at least one hit in each of the two MBTS detectors, and a difference between times measured on the two MBTS sides of less than 10 ns. Thepp events used in this analysis were required to have a reconstructed vertex; no requirement on signal MBTS detector was imposed.
The performance of the ATLAS detector and the measurement of fragmentation functions in p+Pb was evaluated using a sample of MC events obtained by overlaying simulated [10] PYTHIA 6 [11] hard- scattering events onto randomly selected minimum-bias p+Pb events, recorded by ATLAS during the same data-taking period as the data used in this analysis. PYTHIA version 6.423 with the AUET2B tune [12] and the CTEQ6L1 PDF set [13], with √
s = 5.02 TeV and a rapidity shift equivalent to that in the p+Pb collisions, was used. The detector response to the PYTHIA 6 events was simulated using
GEANT4 [14,15], and the simulated hits were combined with the data from the minimum-bias p+Pb events before performing the reconstruction. A separate MC sample of fully simulated 2.76 TeV PYTHIA 6pphard scattering events with the same tune and parton distribution function set was used to evaluate the performance in 2.76 TeVppcollisions.
Theppdijet events at √
s=2.76 TeV and events with the rapidity shift of 0.465 at √
s=5.02 TeV were generated using the HERWIG++ generator [16] to evaluate systematic uncertainties on the reference.
The fragmentation functions evaluated in √
s=2.76 TeV HERWIG++simulations were compared to the measurement inpp2.76 TeV collisions. HERWIG++version 2.5.2 MC with the UE-EE-3 tune [17] at 2.76 TeV and UE-EE-4 tune [17] at 5.02 TeV and the CTEQ6L1 PDF set is used. The UE-EE-4 tune is identical to the UE-EE-3, except for the parameters that describe the √
s-dependence of the multi-parton interactions. The fragmentation functions measured inpp2.76 TeV collisions are further compared to the fragmentation functions evaluated using the PYTHIA 8.165 MC [18] generator with the UE2 tune [19]
and CT10 PDF set [20].
4 Jet and Track Selection
Jets were reconstructed via the heavy ion jet reconstruction algorithm as described in Ref. [6]. A brief summary of the jet reconstruction procedure follows. The anti-kt algorithm [21] was first run in four- momentum recombination mode, on∆η×∆φ=0.1×0.1 logical calorimeter towers with the value of the anti-kt distance parameter R= 0.4. The towers were obtained by summing energies of calorimeter cells at electromagnetic-scale within the tower boundaries. Then, an iterative procedure was used to estimate a layer- andη-dependent underlying event (UE) energy density while excluding regions dominated by the presence of jets from that estimate. The UE energy was subtracted from each calorimeter cell within the towers included in the reconstructed jet and the four-momentum of the jet was updated accordingly.
The updated jet four-momenta in each iteration step were used to determine the new regions that are excluded from the estimate of the UE energy density. After the second iteration step, the final set of jets used in the analysis was determined by updating their kinematics according to the latest UE estimate.
Then, a jetη- andpT-dependent multiplicative calibration factor was applied to correct for the calorimeter response, with an additional small correction based onin situstudies of jets recoiling against objects with an independently calibrated energy scale such as photons, Z bosons, and jets.
Jets were selected with|yjet∗ | < 1.6, which is the largest overlap between the two collision systems for which there is full charged particle tracking coverage. To prevent neighbouring jets from distorting the measurement of the fragmentation functions, an isolation requirement that there should be no higherpT jet within a distance∆R < 1.0 was applied. All jets included in the analysis were required to match trigger jets in apjetT region where the jet trigger was fully efficient.
In the MC samples, the kinematics of the reference generator-level jets (hereafter called “truth jets”) were reconstructed from MC final-state particles4 with the anti-kt algorithm with radius R=0.4 using the same techniques as applied in pp analyses [22]. Truth jets were matched to reconstructed jets for the performance studies and for the unfolding. The angular matching criterion evaluated in performance studies of∆R=0.2 was used.
4Primary charged particles are defined as charged particles with a mean lifetimeτ >0.3−10s either directly produced inpp interactions or from subsequent decays of particles with a shorter lifetime.
Charged particle tracks were reconstructed in the ID using an algorithm optimised for ppevents [23].
Tracks used in this analysis were required to have at least one hit in the pixel detector and at least six hits in the SCT. In order to reject secondary particles, the distance of closest approach of each track to the primary vertex was required to be within 1.5 mm in both the transverse and longitudinal planes (0.2 mm in the transverse plane ifptrkT > 10 GeV). All tracks used in this analysis were required to have pTtrk >3.5 GeV.
The efficiency for reconstructing charged particles within jets separately inp+Pb andppcollisions was evaluated using PYTHIA 6 MC simulations. The accuracy of the description of the detector material in the simulation was studied [23]. Good agreement between data and MC simulations of basic track quan- tities was demonstrated. The charged particle reconstruction efficiencies as a function of the transverse momentum of the MC final-state particle (ptruthT ) in ppand p+Pb collisions, given the requirements de- scribed above, are shown in Fig.1. The efficiencies were evaluated based on matching the reconstructed tracks to MC final-state particles from the PYTHIA 6 event. The tracking efficiencies were determined in coarseηtrk selections as presented in Fig. 1. The pT dependence of the efficiencies were parameter- ized using a functional form that describes trends in the range of trackpT 3.5 to 250 GeV. A constant value of the efficiency is used for tracks with pT > 250 GeV. To account for the localized variations of the tracking efficiency with pseudorapidity, the parameterizations are multiplied by anη-dependent scale factor evaluated inη intervals of 0.1 units. The dependence of the efficiency onpTjetand on the distance from the jet axis was found to be negligible. The contribution of reconstructed tracks which were not associated to a PYTHIA 6 primary particle was evaluated and found to be negligible for the tracks used in this analysis.
[GeV]
truth
pT
10 102
Efficiency
0.6 0.7 0.8 0.9
1 ATLAS Simulation Preliminary
= 2.76 TeV s pp
< -1.0 ηtrk
-2.0 <
< 1.0 ηtrk
-1.0 <
< 2.0 ηtrk
1.0 <
[GeV]
truth
pT
10 102
Efficiency
0.6 0.7 0.8 0.9
1 ATLAS Simulation Preliminary
= 5.02 TeV sNN
+Pb p
< -2.0 ηtrk
-2.5 <
< -1.0 ηtrk
-2.0 <
< 1.0 ηtrk
-1.0 <
< 2.0 ηtrk
1.0 <
Figure 1: Tracking efficiency as a function ofpTtruthinppcollisions (left) and inp+Pb collisions (right). The different sets of points show theηtrkselections used to determine theptruthT dependence of the efficiency. The solid curves show the parameterizations of efficiencies.
5 Analysis Procedure
In this section the measurement and corrections for detector effects of the charged particle jet fragmen- tation functions inp+Pb and ppcollisions are discussed. Charged particles were associated with a jet if they fell within∆R<0.4 of the jet axis. For each of these tracks the longitudinal jet momentum fraction, z was calculated.
The measured fragmentation function is defined as:
D(z) ≡ 1 Njet
1 ε(ηtrk,pTtrk)
∆Nch(z)
∆z (4)
whereε(ηtrk,pTtrk) is the track reconstruction efficiency, andNjetrepresents the total number of measured jets in a given bin.∆Nch(z) represents the number of associated tracks within the givenzrange. The effi- ciency correction was applied on a particle-by-particle basis as a function of the measured track (η,pT).
The measuredD(z) distributions were corrected by means of a two-dimensional Bayesian unfolding pro- cedure [24] using the RooUnfold package [25]. Using the MC events, four-dimensional response matrices were created using the truth and reconstructedpTjetand the truth and reconstructed z. A single iteration of the Bayesian unfolding procedure was used in the results presented here. Separate unfolding matrices were constructed for thep+Pb andppdata. The stability of the unfolding was checked by varying the number of iterations. Further, the simulatedD(z) distributions and jet spectra were re-weighted to match the shapes in the data and new response matrices were constructed. This results in a difference in unfolded D(z) distributions of less than 0.5%. The analysis procedure was tested by dividing the MC events in half and using one half to generate the corrections which were applied to the other. Good recovery of the truth MC distributions was observed for the corrected half.
z
10-1 1
2.76 TeV)z / D( 5.02 TeV)zD(
0.6 0.8 1 1.2 1.4
< 60 GeV
jet
p T
45 <
|<1.6 *jet
y | pp
ATLAS Simulation Preliminary
PYTHIA 6 HERWIG++
z
10-1 1
2.76 TeV)z / D( 5.02 TeV)zD(
0.6 0.8 1 1.2 1.4
< 80 GeV
jet
p T
60 <
|<1.6 *jet
y | pp
ATLAS Simulation Preliminary
PYTHIA 6 HERWIG++
z
10-1 1
2.76 TeV)z / D( 5.02 TeV)zD(
0.6 0.8 1 1.2 1.4
< 110 GeV
jet
p T
80 <
|<1.6 *jet
y | pp
ATLAS Simulation Preliminary
PYTHIA 6 HERWIG++
z
10-1 1
2.76 TeV)z / D( 5.02 TeV)zD(
0.6 0.8 1 1.2 1.4
< 160 GeV
jet
p T
110 <
|<1.6 *jet
y | pp
ATLAS Simulation Preliminary
PYTHIA 6 HERWIG++
z
10-1 1
2.76 TeV)z / D( 5.02 TeV)zD(
0.6 0.8 1 1.2 1.4
< 210 GeV
jet
p T
160 <
|<1.6 *jet
y | pp
ATLAS Simulation Preliminary
PYTHIA 6 HERWIG++
z
10-1 1
2.76 TeV)z / D( 5.02 TeV)zD(
0.6 0.8 1 1.2 1.4
< 260 GeV
jet
p T
210 <
|<1.6 *jet
y | pp
ATLAS Simulation Preliminary
PYTHIA 6 HERWIG++
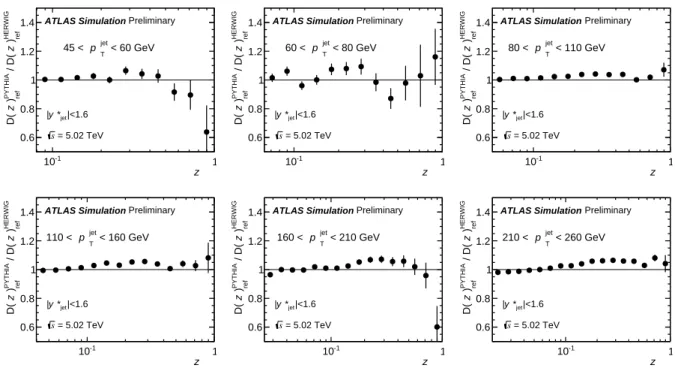
Figure 2: The comparison of theD(z)5.02TeV/D(z)2.76TeVratios of truth fragmentation functions inppcollisions evaluated using the PYTHIA 6 generator (closed points) and the HERWIG++generator (open points) in different jetpTbins.
In the absence of √
s = 5.02 TeVppdata, reference D(z) distributions were constructed from the data obtained at √
s=2.76 TeVppcollisions. The extrapolation to √
s=5.02 TeV was done using PYTHIA 6, with the assumption that the √
sdependence of the fragmentation functions were the same in PYTHIA 6 and data:
Dp p(z)5.02TeV = Dp p(z)2.76TeV× DPYTHIA6(z)5.02TeV
DPYTHIA6(z)2.76TeV (5)
The extrapolation was done separately for eachpjetT bin with both data and MC generator having the same
|yjet∗ | <1.6 selection.
Further, the √
s dependence of the fragmentation functions was studied using the HERWIG++simula- tions. The comparison of the D(z)5.02TeV/D(z)2.76TeV ratios of truth fragmentation functions evaluated using the two MC generators is shown in Fig.2. A qualitative agreement between the PYTHIA 6 and HERWIG++simulations is observed. Generally, the ratios evaluated using HERWIG++are higher at high z and lower at low z compared to the ratios in PYTHIA 6 simulations. The difference between references evaluated using the PYTHIA 6 and HERWIG++generators was included in the systematic uncertainties.
6 Systematic Uncertainties
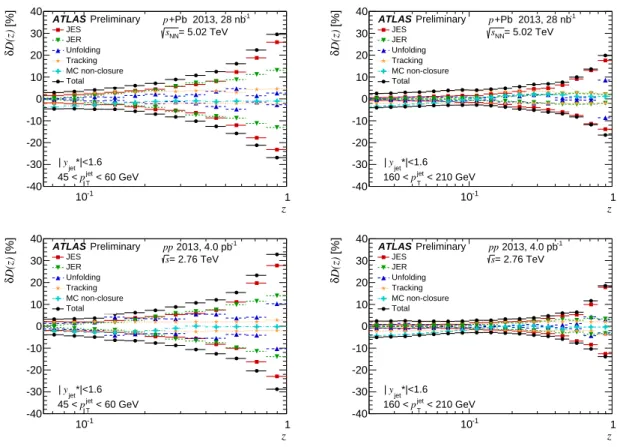
The systematic uncertainties in the measurement of the fragmentation functions and their ratios are de- scribed in this section. The following sources of systematic uncertainty were considered: the jet energy scale (JES), the jet energy resolution (JER), the track selection, the unfolding, the residual non-closure in the simulation, and the uncertainty inherent in the extrapolation of theppdata to √
s=5.02 TeV. The uncertainty from the extrapolation is associated only with theRD(z)ratios. Since both the numerator and denominator in the RD(z) ratios are affected to a similar degree by the variations accounting for these uncertainties from JES and JER, these uncertainties largely cancel.
The systematic uncertainties onD(z) inppandp+Pb collisions are summarized in Fig.3for two different jet pT bins. The systematic uncertainties from each source have been combined in quadrature to obtain the total systematic uncertainty. To avoid statistical fluctuations in the values of systematic uncertainties, the z dependence of the uncertainties from the non-closure and from the reference is smoothed by a third-order polynomial.
The JES uncertainty was determined fromin situstudies of the calorimeter response [22,26], and perfor- mance studies of the relative energy scale difference between the jet reconstruction procedure in heavy-ion collisions and the procedure used inppcollisions. The uncertainty from the JES was evaluated by shifting all reconstructed jet transverse momenta by±1 standard deviation of the JES uncertainty. The resulting uncertainties on the D(z) and RD(z) distributions were evaluated by repeating the unfolding procedure with modified response matrices. The magnitude of the systematic uncertainty on theD(z) distributions is a few percent at the lowestzand increases with increasingzat fixedpjetT and is approximately 28% for z ∼ 1 for 45 < pjetT < 60 GeV. The uncertainty decreases with increasingpjetT , and is approximately 18%
forz∼1 for 160< pjetT <210 GeV jets.
The uncertainty onD(z) because of JER was evaluated by repeating the unfolding procedure with mod- ified response matrices, where an additional modification to the resolution of the reconstructed jet pT was added with Gaussian smearing. The additional smearing factor was evaluated using anin situtech- nique involving studies of dijet energy balance [27, 28]. The systematic uncertainty on D(z) due to the JER is very small at low z and increases with increasing z and decreases with increasing pjetT . It reaches 14% for z ∼ 1 in the jet pT interval 45 < pTjet < 60 GeV and decreases to 4% in the interval 160< pjetT <210 GeV.
The uncertainty due to the track reconstruction was evaluated by repeating the analysis with modified tracking selection criteria. Alternate cuts were applied in both data and MC samples. The uncertainties
z
10-1 1
[%]D(z)δ
-40 -30 -20 -10 0 10 20 30 40
JES JER Unfolding Tracking MC non-closure Total
*|<1.6 yjet
|
ATLAS Preliminary
= 5.02 TeV sNN
+Pb 2013, 28 nb-1
p
< 60 GeV
jet
pT
45 <
z
10-1 1
[%]D(z)δ
-40 -30 -20 -10 0 10 20 30 40
JES JER Unfolding Tracking MC non-closure Total
*|<1.6 yjet
|
ATLAS Preliminary
= 5.02 TeV sNN
+Pb 2013, 28 nb-1
p
< 210 GeV
jet
pT
160 <
z
10-1 1
[%]D(z)δ
-40 -30 -20 -10 0 10 20 30 40
JES JER Unfolding Tracking MC non-closure Total
*|<1.6 yjet
|
ATLAS Preliminary
= 2.76 TeV s
2013, 4.0 pb-1
pp
< 60 GeV
jet
pT
45 <
z
10-1 1
[%]D(z)δ
-40 -30 -20 -10 0 10 20 30 40
JES JER Unfolding Tracking MC non-closure Total
*|<1.6 yjet
|
ATLAS Preliminary
= 2.76 TeV s
2013, 4.0 pb-1
pp
< 210 GeV
jet
pT
160 <
Figure 3: Summary of the systematic uncertainties on theD(z) distributions inp+Pb collisions (top) andppcol- lisions (bottom) for jets in the 45–60 GeV pT interval (left) and in the 160–210 GeV pT interval (right). The systematic uncertainties due to JES, JER, unfolding, tracking and MC non-closure are shown.
on the D(z) and RD(z) distributions were evaluated from their changed values when loose and tight track selection requirements were used. The size of the resulting systematic uncertainty is typically smaller than 2% with a mildz dependence. This uncertainty mostly cancels in theRD(z) distributions.
The uncertainty on the tracking efficiency related to the description of the inactive detector material was evaluated to be 2% in the trackpTrange used in the analysis. This systematic uncertainty cancels in the ratio. Further, a reconstructed track is categorized as a particle in MC simulations if it is associated to a MC final-state particle. The parameters of the track-to-particle association were varied and new response matrices and efficiency corrections were derived. The resulting systematic uncertainty on the D(z) and RD(z)distributions is less than 0.5%.
The systematic uncertainty associated with the Bayesian unfolding is due to the sensitivity of the un- folding procedure to the choice of a specific number of iterations. The uncertainty was estimated as the change in theD(z) and RD(z) distributions, evaluated with two iterations instead of one. The resulting uncertainty is less than 3% at lowzand increases at highzwhere it reaches up to 10%.
A presence of additional residual limitations in the unfolding was verified by evaluating the deviation from unity of the ratio of MC truth and reconstructed fully corrected MC distributions. The systematic uncertainty from the “MC non-closure” is less than 4%.
The extrapolation of the √
s = 2.76 TeV pp fragmentation functions to √
s = 5.02 TeV is sensitive to the centre-of-mass energy dependence of the fragmentation functions in the simulation. As discussed
z
10-1 1
HERWIG ref )z / D( PYTHIA ref )z D(
0.6 0.8 1 1.2 1.4
< 60 GeV
jet
p T
45 <
|<1.6 *jet
y
|
ATLAS Simulation
= 5.02 TeV s
Preliminary
z
10-1 1
HERWIG ref )z / D( PYTHIA ref )z D(
0.6 0.8 1 1.2 1.4
< 80 GeV
jet
p T
60 <
|<1.6 *jet
y
|
ATLAS Simulation
= 5.02 TeV s
Preliminary
z
10-1 1
HERWIG ref )z / D( PYTHIA ref )z D(
0.6 0.8 1 1.2 1.4
< 110 GeV
jet
p T
80 <
|<1.6 *jet
y
|
ATLAS Simulation
= 5.02 TeV s
Preliminary
z
10-1 1
HERWIG ref )z / D( PYTHIA ref )z D(
0.6 0.8 1 1.2 1.4
< 160 GeV
jet
p T
110 <
|<1.6 *jet
y
|
ATLAS Simulation
= 5.02 TeV s
Preliminary
z
10-1 1
HERWIG ref )z / D( PYTHIA ref )z D(
0.6 0.8 1 1.2 1.4
< 210 GeV
jet
p T
160 <
|<1.6 *jet
y
|
ATLAS Simulation
= 5.02 TeV s
Preliminary
z
10-1 1
HERWIG ref )z / D( PYTHIA ref )z D(
0.6 0.8 1 1.2 1.4
< 260 GeV
jet
p T
210 <
|<1.6 *jet
y
|
ATLAS Simulation
= 5.02 TeV s
Preliminary
Figure 4: Referenceppfragmentation functions constructed from a HERWIG-based extrapolation compared to that constructed from the PYTHIA 6-based extrapolation. In both cases, the √
s=2.76 TeVppdata is extrapolated to
√s=5.02 TeV.
z
10-1 1
[%]pPbRδ
-40 -30 -20 -10 0 10 20 30 40
JES JER Unfolding Tracking MC non-closure Reference Total
*|<1.6 yjet
|
ATLAS Preliminary
= 5.02 TeV sNN
+Pb 2013, 28 nb-1
p
< 60 GeV
jet
pT
45 <
z
10-1 1
[%]pPbRδ
-40 -30 -20 -10 0 10 20 30 40
JES JER Unfolding Tracking MC non-closure Reference Total
*|<1.6 yjet
|
ATLAS Preliminary
= 5.02 TeV sNN
+Pb 2013, 28 nb-1
p
< 210 GeV
jet
pT
160 <
Figure 5: Summary of the systematic uncertainties for RD(z) ratios, for jets in the 45–60 GeV pTinterval (left) and in the 160–210 GeVpTinterval (right). The systematic uncertainties due to JES, JER, unfolding, tracking, reference, and MC non-closure are shown.
above, PYTHIA 6 was used as the primary MC generator for the extrapolation of the D(z) measured in 2.76 TeV pp collisions. The systematic uncertainty of the generator dependent extrapolation was determined as the difference between references evaluated using PYTHIA 6 and HERWIG++generators, which have significantly different fragmentation models. Figure4shows the ratio of references obtained by the extrapolation of the √
s=2.76 TeVpp D(z) distributions with HERWIG++and PYTHIA 6. The uncertainty was taken to be symmetric around the central value.
The combined systematic uncertainties on theRD(z) distributions are shown in Fig.5.
z
10-1 1
) zD(
10-4
10-3
10-2
10-1
1 10 102
103
104
105
106
107
108 -1
= 2.76 TeV, 4 pb s
, pp
|<1.6
jet
* y
|
ATLAS Preliminary
z
10-1 1
< 60 GeV x 10 0 jet
p T
45 <
< 80 GeV x 10 1 jet
p T
60 <
< 110 GeV x 10 2 jet
p T
80 <
< 160 GeV x 10 3 jet
p T
110 <
< 210 GeV x 10 4 jet
p T
160 <
< 260 GeV x 10 5 jet
p T
210 <
= 5.02 TeV, 28 nb -1
sNN
+Pb, p
|<1.6
jet
* y
|
ATLAS Preliminary
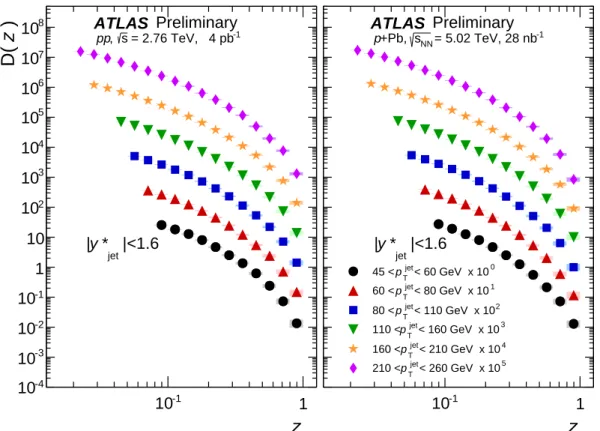
Figure 6: Fragmentation functions inpp(left) andp+Pb collisions (right) for thepTjetselections used in this analysis.
The fragmentation functions in both collision systems have been offset by multiplicative factors for clarity as noted in the legend. The statistical uncertainties are shown as error bars and the systematic uncertainties are shown as shaded boxes. In many cases the uncertainties are smaller than the marker size.
7 Results
In this section results are presented on the measurement of the D(z) distributions for different jet pT selections for both the √
sNN =5.02 TeV p+Pb collisions and the √
s =2.76 TeV ppcollisions and the ratioRD(z)as a function ofz. TheD(z) distributions of both collisions systems are shown in Fig.6. For eachpTjetinterval, the minimumzcorresponds to the minimumpTtrkof 3.5 GeV.
Figure 7 compares the D(z) distribution in pp collisions at 2.76 TeV to that in three generators:
PYTHIA 6, HERWIG++, and PYTHIA 8 for the six pjetT intervals. For all pTjet bins the PYTHIA 6 fragmentation functions are approximately 10% higher than those in the data at the lowestzbins shown and approximately 20% lower than the data atz =1. The comparison with HERWIG++shows an ap- proximately oppositezdependence. TheD(z) distribution evaluated using HERWIG++is lower than the data at lowz, and 20–30% higher than the data atz=0.5. It decreases with respect to the data at higher z and is approximately equal to the data atz =0.7. The D(z) distribution obtained using PYTHIA 8 is similar to PYTHIA 6, but has slightly better agreement with the data. The ability of these generators to describe the data is in qualitative agreement with the comparisons of fragmentation functions frompp
z
10-1 1
simulation / data
0.6 0.8 1 1.2 1.4
< 60 GeV
jet
p T
45 <
PYTHIA 6 PYTHIA 8 HERWIG++
| < 1.6
jet
* y
| ATLAS
4 pb -1
Preliminary
= 2.76 TeV pp s
z
10-1 1
simulation / data
0.6 0.8 1 1.2 1.4
< 80 GeV
jet
p T
60 <
PYTHIA 6 PYTHIA 8 HERWIG++
| < 1.6
jet
* y
| ATLAS
4 pb -1
Preliminary
= 2.76 TeV pp s
z
10-1 1
simulation / data
0.6 0.8 1 1.2 1.4
< 110 GeV
jet
p T
80 <
PYTHIA 6 PYTHIA 8 HERWIG++
| < 1.6
jet
* y
| ATLAS
4 pb -1
Preliminary
= 2.76 TeV pp s
z
10-1 1
simulation / data
0.6 0.8 1 1.2 1.4
< 160 GeV
jet
p T
110 <
PYTHIA 6 PYTHIA 8 HERWIG++
| < 1.6
jet
* y
| ATLAS
4 pb -1
Preliminary
= 2.76 TeV pp s
z
10-1 1
simulation / data
0.6 0.8 1 1.2 1.4
< 210 GeV
jet
p T
160 <
PYTHIA 6 PYTHIA 8 HERWIG++
| < 1.6
jet
* y
| ATLAS
4 pb -1
Preliminary
= 2.76 TeV pp s
z
10-1 1
simulation / data
0.6 0.8 1 1.2 1.4
< 260 GeV
jet
p T
210 <
PYTHIA 6 PYTHIA 8 HERWIG++
| < 1.6
jet
* y
| ATLAS
4 pb -1
Preliminary
= 2.76 TeV pp s
Figure 7: Ratios of the truth level fragmentation functions from PYTHIA 6, PYTHIA 8, and HERWIG++to the unfoldedppdata for the sixpjetT selections used in this analysis. The statistical uncertainties are shown as error bars and the systematic uncertainties are shown as the shaded region around unity.
data at 7 TeV [29].
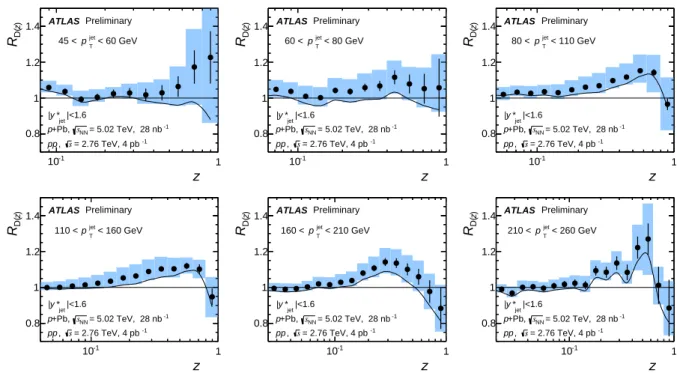
Figure8shows the measured fragmentation functions in p+Pb collisions compared to the extrapolated ppfragmentation functions forpjetT from 45 to 260 GeV. AtpjetT <80 GeV, the ratio of the fragmentation functions is largely consistent with unity. RD(z) distributions evaluated for jets with pTjet from 80 to 260 GeV show evidence for an excess of approximately 15% in thezrange 0.2–0.8. The significance of the excess is at most approximately 2.2 standard deviations. TheRD(z) distributions evaluated with the reference based on the HERWIG++extrapolation are also shown. This reference reduces the ratio by up to 10% though an excess is still observed. ThepTtrkof the particles which contribute to the observed excess is above approximately 15 GeV. This roughly corresponds to the momentum where the enhancement of the single particles inp+Pb is observed.
8 Summary
This note presents the jet charged particle fragmentation functions for|yjet∗ | <1.6 and forpjetT from 45 to 260 GeV in √
sNN=5.02 TeVp+Pb collisions and in √
s=2.76 TeVppcollisions. Theppfragmentation functions have been compared to the PYTHIA 6, PYTHIA 8 and HERWIG++generators. The generators show deviations from the data of up to approximately 30%, depending on thez and the generator.
Thep+Pb data was compared to appreference, constructed by extrapolating the measured fragmentation functions in 2.76 TeVppcollisions to 5.02 TeV. Using this reference, azdependent excess with a maximal magnitude of approximately 15% is observed in the p+Pb fragmentation functions for approximately
z
10-1 1
)zD(R
0.8 1 1.2 1.4
< 60 GeV
jet
p T
45 <
|<1.6
jet
* y
|
ATLAS Preliminary
= 5.02 TeV, 28 nb -1
sNN
+Pb, p
= 2.76 TeV, 4 pb -1
, s pp
z
10-1 1
)zD(R
0.8 1 1.2 1.4
< 80 GeV
jet
p T
60 <
|<1.6
jet
* y
|
ATLAS Preliminary
= 5.02 TeV, 28 nb -1
sNN
+Pb, p
= 2.76 TeV, 4 pb -1
, s pp
z
10-1 1
)zD(R
0.8 1 1.2 1.4
< 110 GeV
jet
p T
80 <
|<1.6
jet
* y
|
ATLAS Preliminary
= 5.02 TeV, 28 nb -1
sNN
+Pb, p
= 2.76 TeV, 4 pb -1
, s pp
z
10-1 1
)zD(R
0.8 1 1.2 1.4
< 160 GeV
jet
p T
110 <
|<1.6 *jet
y
|
ATLAS Preliminary
= 5.02 TeV, 28 nb -1
sNN
+Pb, p
= 2.76 TeV, 4 pb -1
s , pp
z
10-1 1
)zD(R
0.8 1 1.2 1.4
< 210 GeV
jet
p T
160 <
|<1.6 *jet
y
|
ATLAS Preliminary
= 5.02 TeV, 28 nb -1
sNN
+Pb, p
= 2.76 TeV, 4 pb -1
s , pp
z
10-1 1
)zD(R
0.8 1 1.2 1.4
< 260 GeV
jet
p T
210 <
|<1.6 *jet
y
|
ATLAS Preliminary
= 5.02 TeV, 28 nb -1
sNN
+Pb, p
= 2.76 TeV, 4 pb -1
s , pp
Figure 8: Ratios of fragmentation functions inp+Pb compared to those inppcollisions for the sixpjetTintervals. The statistical uncertainties are shown as error bars and the total systematic uncertainties are shown as shaded boxes.
The solid black lines show theRD(z)ratios evaluated with the reference based on the HERWIG++extrapolation.
0.2 < z < 0.8 in jets with pTjet > 80 GeV. Thez and pjetT ranges over which the RD(z) distributions are enhanced correspond to the same range in transverse momentum where the inclusive charged particle spectrum inp+Pb collisions is enhanced.
Acknowledgements
We thank CERN for the very successful operation of the LHC, as well as the support staff from our institutions without whom ATLAS could not be operated efficiently.
We acknowledge the support of ANPCyT, Argentina; YerPhI, Armenia; ARC, Australia; BMWFW and FWF, Austria; ANAS, Azerbaijan; SSTC, Belarus; CNPq and FAPESP, Brazil; NSERC, NRC and CFI, Canada; CERN; CONICYT, Chile; CAS, MOST and NSFC, China; COLCIENCIAS, Colombia; MSMT CR, MPO CR and VSC CR, Czech Republic; DNRF, DNSRC and Lundbeck Foundation, Denmark;
EPLANET, ERC and NSRF, European Union; IN2P3-CNRS, CEA-DSM/IRFU, France; GNSF, Geor- gia; BMBF, DFG, HGF, MPG and AvH Foundation, Germany; GSRT and NSRF, Greece; RGC, Hong Kong SAR, China; ISF, MINERVA, GIF, I-CORE and Benoziyo Center, Israel; INFN, Italy; MEXT and JSPS, Japan; CNRST, Morocco; FOM and NWO, Netherlands; BRF and RCN, Norway; MNiSW and NCN, Poland; GRICES and FCT, Portugal; MNE/IFA, Romania; MES of Russia and NRC KI, Rus- sian Federation; JINR; MSTD, Serbia; MSSR, Slovakia; ARRS and MIZŠ, Slovenia; DST/NRF, South Africa; MINECO, Spain; SRC and Wallenberg Foundation, Sweden; SER, SNSF and Cantons of Bern and Geneva, Switzerland; NSC, Taiwan; TAEK, Turkey; STFC, the Royal Society and Leverhulme Trust, United Kingdom; DOE and NSF, United States of America.
The crucial computing support from all WLCG partners is acknowledged gratefully, in particular from CERN and the ATLAS Tier-1 facilities at TRIUMF (Canada), NDGF (Denmark, Norway, Sweden), CC-IN2P3 (France), KIT/GridKA (Germany), INFN-CNAF (Italy), NL-T1 (Netherlands), PIC (Spain), ASGC (Taiwan), RAL (UK) and BNL (USA) and in the Tier-2 facilities worldwide.
References
[1] ATLAS Collaboration, Phys. Rev. Lett.114.7 (2015) 072302, arXiv:1411.2357 [hep-ex].
[2] ATLAS Collaboration, Phys. Lett.B739(2014) 320–342, arXiv:1406.2979 [hep-ex].
[3] CMS Collaboration, Phys. Rev.C90.2 (2014) 024908, arXiv:1406.0932 [nucl-ex].
[4] C. Salgado et al., J. Phys.G39(2012) 015010, arXiv:1105.3919 [hep-ph].
[5] K. Eskola, H. Paukkunen and C. Salgado, JHEP0904(2009) 065, arXiv:0902.4154 [hep-ph].
[6] ATLAS Collaboration, submitted to Phys. Lett. B (2014), arXiv:1412.4092 [hep-ex].
[7] CMS Collaboration, Eur. Phys. J.C75.5 (2015) 237, arXiv:1502.05387 [nucl-ex].
[8] ATLAS Collaboration (2014), ATLAS-CONF-2014-029, url:https://cds.cern.ch/record/1704978.
[9] ATLAS Collaboration, JINST3(2008) S08003.
[10] ATLAS Collaboration, Eur. Phys. J.C70(2010) 823–874, arXiv:1005.4568.
[11] T. Sjostrand, S. Mrenna and P. Z. Skands, JHEP0605(2006) 026, arXiv:hep-ph/0603175 [hep-ph].
[12] ATLAS Collaboration (2011), ATL-PHYS-PUB-2011-009, url:https://cds.cern.ch/record/1363300.
[13] J. Pumplin et al., JHEP0207(2002) 012, arXiv:hep-ph/0201195.
[14] GEANT4 Collaboration, S. Agostinelli et al., Nucl. Instrum. Meth.A506(2003) 250–303.
[15] ATLAS Collaboration, Eur. Phys. J.C70(2010) 823–874, arXiv:1005.4568 [physics.ins-det].
[16] M. Bahr et al., Eur. Phys. J.C58(2008) 639–707, arXiv:0803.0883 [hep-ph].
[17] S. Gieseke, C. Rohr and A. Siodmok, Eur. Phys. J.C72(2012) 2225, arXiv:1206.0041 [hep-ph].
[18] T. Sjostrand, S. Mrenna and P. Z. Skands, Comput. Phys. Commun.178(2008) 852–867, arXiv:0710.3820 [hep-ph].
[19] ATLAS Collaboration (2012), ATL-PHYS-PUB-2012-003, url:http://cds.cern.ch/record/1474107.
[20] H.-L. Lai et al., Phys.Rev.D82(2010) 074024, arXiv:1007.2241 [hep-ph].
[21] M. Cacciari, G. P. Salam and G. Soyez, JHEP0804(2008) 063, arXiv:0802.1189 [hep-ph].
[22] ATLAS Collaboration, Eur. Phys. J.C73(2013) 2304, arXiv:1112.6426.
[23] ATLAS Collaboration, New J. Phys.13(2011) 053033, arXiv:1012.5104 [hep-ex].
[24] G. D’Agostini, Nucl. Instrum. Meth.A362(1995) 487–498.
[25] T. Adye in CERN-2011-006 (2011),url:https://cds.cern.ch/record/1306523.
[26] ATLAS Collaboration (2015), ATLAS-CONF-2015-016, url:https://cds.cern.ch/record/2008677.
[27] ATLAS Collaboration, Eur.Phys.J.C73.3 (2013) 2306, arXiv:1210.6210 [hep-ex].
[28] ATLAS Collaboration (2015), ATLAS-CONF-2015-017, url:https://cds.cern.ch/record/2008678.
[29] ATLAS Collaboration, Eur. Phys. J.C71(2011) 1795, arXiv:1109.5816 [hep-ex].