ATLAS-CONF-2017-005 08February2017
ATLAS CONF Note
ATLAS-CONF-2017-005
Measurement of jet fragmentation in 5.02 TeV lead-lead and proton-proton collisions with the
ATLAS detector
The ATLAS Collaboration
6th February 2017
This note presents a measurement of charged particle jet fragmentation functions in Pb
+Pb collisions at
√sNN =
5.02 TeV. The data were collected in 2015 by the ATLAS detec- tor. These measurements are sensitive to the strength and mechanism for jet quenching in the medium created in ultra-relativistic nuclear collisions. The jet fragmentation functions are compared to those measured in
ppcollisions at the same collision energy. Fragmenta- tion functions are measured using charged particles with transverse momentum greater than 4 GeV and are reported as a function of the transverse momentum of the jet and the centrality of the collision. Jets are measured over the rapidity interval
|y| <2.1 and with transverse momentum range 126–501 GeV. In central Pb+Pb collisions there is a suppression of the charged particle yield compared to
ppcollisions by approximately 15% for charged parti- cles that have a longitudinal momentum fraction smaller than approximately 0.2; for charged particles with a higher longitudinal momentum fraction there is an enhancement of approx- imately 20%. The strength of the modification decreases with decreasing centrality. No significant dependence on the jet transverse momentum is observed in the measured range.
c
2017 CERN for the benefit of the ATLAS Collaboration.
Reproduction of this article or parts of it is allowed as specified in the CC-BY-4.0 license.
1 Introduction
Ultra-relativistic nuclear collisions at the LHC produce a hot dense matter; a recent review can be found in Ref. [1]. Hard scattering processes occurring in these collisions produce jets which traverse and interact with the matter. The rates of jet production are observed to be reduced in lead-lead (Pb+Pb) collisions at
√sNN =
2.76 TeV compared to expectations from the jet production cross sections measured in
ppinteractions scaled by the nuclear thickness function of Pb
+Pb collisions [2–4]. This reduction is termed
“jet-quenching" and is due to the constituents of the parton shower being scattered by the constituents of the matter. In order to further understand this process, modifications to the internal structure of jets are measured. Charged particle longitudinal fragmentation functions are observed to be modified in 2.76 TeV Pb
+Pb collisions compared to
ppcollisions [5–7]. Jets in Pb
+Pb collisions are found to have an excess of particles with transverse momentum (p
T) below 4 GeV and an excess of particles carrying a large fraction of the jet transverse momentum. In between these two excesses there is a suppression of the charged particle yield. A similar excess of low
pTparticles is observed for particles in a wide region around the jet cone [8]. These observations suggest that the energy lost by jets through the jet quenching process is being transferred to soft particles within and around the jet. A possible explanation of the enhancement of particles carrying a large fraction of the jet momentum is that it is due to the di
fferent expected energy loss from quark and gluon initiated jets [9].
In this note, the measurement of jet fragmentation functions in Pb
+Pb collisions is extended to collisions at
√sNN =
5.02 TeV using data collected in 2015. These data extend the previous measurements in two ways. First, an increase in the peak energy density of the medium is expected. Second, there is a large increase in the number of jets available. The luminosity of Pb
+Pb collisions at 5.02 TeV recorded by ATLAS is 0.49 nb
−1. This is 3.5 times the luminosity available at 2.76 TeV and the increase in the collision energy also increases the jet cross sections. This enables the possibility to measure the dependence of the jet fragmentation on the transverse momentum of the jet (p
Tjet) over a wider range than was possible previously.
Jets are reconstructed with the anti-k
talgorithm [10] using distance parameter
R=0.4. The association between tracks and jets is done via an angular matching
∆R<0.4, where
∆R= p∆η2+∆φ2
with
∆ηand
∆φ
defined as the distances between the jet axis and the charged particle direction in pseudorapidity and azimuth,1 respectively. Results are presented as a function of both charged particle transverse momentum with respect to the beam direction,
ptrkT, and longitudinal momentum fraction relative to the jet
z ≡ pTtrkcos
∆R/pTjetand are written as:
D(z) ≡
1
NjetdN
chdz
,(1)
and
D(pT
)
≡1
NjetdN
chdp
trkT ,(2)
where
Nchis the number of charged particles and
Njetis the number of jets under consideration.
1 ATLAS uses a right-handed coordinate system with its origin at the nominal interaction point (IP) in the centre of the detector and thez-axis along the beam pipe. Thex-axis points from the IP to the centre of the LHC ring, and theyaxis points upward.
Cylindrical coordinates (r, φ) are used in the transverse plane, φbeing the azimuthal angle around the beam pipe. The pseudorapidity is defined in terms of the polar angleθasη=−ln tan(θ/2). The rapidity is defined asy=0.5 lnE+pE−pz
z where Eandpzare the energy and the component of the momentum along the beam direction.
The fragmentation functions in Pb
+Pb collisions are compared to those in
ppcollisions at
√s=
5.02 TeV.
In order to quantify differences between Pb+Pb and
ppcollisions, the ratios of the fragmentation functions are measured:
RD
(z)
≡ D(z)PbPbD(z)p p
(3)
and
RD(pT
)
≡ D(pT)
PbPbD(pT
)
p p .(4)
2 Experimental Setup
The measurements presented here were performed using the ATLAS detector [11]. The primary com- ponents used in this measurement were the calorimeter systems and the inner detector. The calorimeter system consists of a sampling liquid argon (LAr) electromagnetic (EM) calorimeters covering
|η| <3.2, a steel–scintillator sampling hadronic calorimeter covering
|η| <1.7, LAr hadronic calorimeters covering 1.5
< |η| <3.2, and two LAr forward calorimeters (FCal) covering 3.1
< |η| <4.9. The EM calorime- ters are segmented longitudinally in shower depth into three layers with an additional pre-sampler layer.
They have segmentation that varies with layer and pseudorapidity. The hadronic calorimeters have three sampling layers longitudinal in shower depth with granularity that is generally much coarser than that of the EM calorimeters. The minimum-bias trigger scintillators (MBTS) detect charged particles over 2.1
< |η| <3.9 using two segmented counters placed at a distance from the detector center of
±3.6 m.
Each counter provides measurements of both the pulse heights and arrival times of ionization energy deposits.
The inner detector measures charged particles within the pseudorapidity interval
|η| <2.5 using a combi- nation of silicon pixel detectors, silicon microstrip detectors (SCT), and a straw-tube transition radiation tracker (TRT), all immersed in a 2 T axial magnetic field [11]. Each of the three detectors is composed of a barrel and two symmetric end-cap sections. The pixel detector is composed of four layers, the "in- sertable B-layer" (IBL) [12, 13] and three layers with a nominal pixel size of 50
µm ×400
µm. The SCTbarrel section contains four layers of modules with 80
µm pitch sensors on both sides, and each end-capconsists of nine layers of double-sided modules with radial strips having a mean pitch of 80
µm. The twosides of each SCT layer in both the barrel and the end-caps have a relative stereo angle of 40 mrad. The TRT contains up to 73 (160) layers of staggered straws interleaved with fibres in the barrel (end-cap).
A multi-level trigger system was used to select the Pb+Pb and
ppcollisions. The first, a hardware based trigger stage Level-1, is implemented with custom electronics. The next level is the software-based High Level Trigger (HLT). Jet events were selected by the HLT, seeded by Level-1 jet, minimum bias, and total energy triggers. A total energy trigger required a total transverse energy measured in the calorimeter system of greater than 5 GeV in
ppinteractions and 50 GeV in Pb
+Pb interactions. The HLT jet trigger used a jet reconstruction algorithm similar to that used in the o
ffline analysis. It selected events containing jets with a transverse energy thresholds of 75 GeV and 100 GeV in Pb+Pb collisions, and 85 GeV in
ppcollisions. In both
ppand Pb
+Pb collisions, the highest threshold jet trigger sampled the full delivered luminosity; the 75 GeV trigger threshold was pre-scaled
2in a small part of the Pb
+Pb data taking period and it sampled 99% of the total luminosity.
2The pre-scale indicates which fraction of events that passed the trigger selection were selected for recording by the DAQ.
3 Event Selection and Data Sets
The Pb+Pb and
ppdata used in this analysis were recorded in 2015. The data samples consist of 25 pb
−1of
√s=
5.02 TeV
ppdata and 0.49 nb
−1of
√sNN =
5.02 TeV Pb
+Pb data. In Pb
+Pb and
ppcollisions events are required to have a reconstructed vertex within 150 mm of the nominal interaction point along the beam axis.
In Pb
+Pb collisions, the event centrality reflects the overlap volume of the two colliding nuclei and it is characterized by
ΣEFCalT, the total transverse energy deposited in the FCal [14]. The centrality intervals used in this analysis were defined according to successive percentiles of the
ΣETFCaldistribution ordered from the most central (highest
ΣETFCal) to the most peripheral collisions (lowest
ΣETFCal): 0–10%, 10–20%, 20–30%, 30–40%, 40–60%, 60–80%.
The performance of the detector and analysis procedure is evaluated using 18
×106Monte Carlo (MC) events obtained by overlaying hard-scattering events generated with P
owheg+P
ythia8 [15, 16] using the A14 tune [17] and the NNPDF23LO PDF set [18] onto minimum-bias Pb+Pb data events. The detector response is simulated using GEANT4 [19, 20], and the simulated hits are combined with those from the data event. A separate sample of 26
×106simulated 5.02 TeV P
ythia8
pphard scattering events with the same tune and PDFs as for the Pb+Pb MC sample is used to evaluate the performance for measuring fragmentation functions in the
ppdata.
4 Jet and Track Selection
The jet reconstruction and underlying event (UE) determination and subtraction procedures closely follow those used by ATLAS for jet measurements in
ppand Pb+Pb collisions at
√sNN =
2.76 TeV [3, 21].
The anti-k
talgorithm is first run in four-momentum recombination mode, on
∆η × ∆φ =0.1
×0.1 calorimeter towers with the anti-k
tdistance parameter
Rset to 0.2. The energies in the towers were obtained by summing the energies of calorimeter cells at electromagnetic energy scale within the tower boundaries. Then, an iterative procedure is used to estimate the layer- and
η-dependent UE transverseenergy density, while excluding the regions populated by jets. The UE transverse energy is subtracted from each calorimeter cell within the towers included in the reconstructed jet and the four-momentum of the jet is updated accordingly. In the final step, jets are also reconstructed with
R =0.4. Then, a jet
η-and
pT-dependent correction factor to the
pTderived from the simulation samples is applied to correct for the calorimeter energy response. An additional correction based on
in situstudies of jets recoiling against photons, Z bosons, and jets in other regions of the calorimeter is applied [14, 22].
Jets are required to be within
|y| <2.1 such that all
R=0.4 jet cones are contained within the inner detector acceptance. To prevent neighbouring jets from distorting the measurement of the fragmentation functions, jets are rejected if there is another jet with higher
pTwithin a distance
∆R<1.0. To reduce the e
ffects of the broadening of the jet position measurement due to the UE, for
R=0.4 jets, the jet direction was taken from that of the closest matching
R=0.2 jet within
∆R =0.3 when such a matching jet was found. If no matching
R=0.2 jet is found the axis remains unchanged. All jets included in the analysis are required to have a
pjetTin the region where the jet trigger was fully e
fficient.
Tracks were reconstructed from hits in the inner detector using the track reconstruction algorithm with
settings optimized for the high hit density in heavy ion collisions. Tracks used in this analysis are required
to have at least 9 (11) total silicon hits for
|ηtrk| <1.65 (
|ηtrk| >1.65) including both the pixel layers and
the SCT. At least one hit is required in one of the two inner layers of the Pixel detector. If the track passed an active module in the innermost layer a hit in this layer is required. Further, a track has to have no more than two holes in the Pixel and SCT detectors together. A hole is defined by the absence of a hit predicted by the track trajectory. All tracks used in this analysis are required to have
ptrkT >4 GeV. In order to suppress a contribution of secondary particles, the distance of closest approach of the track to the primary vertex is required to be less than a value which varies from 0.45 mm at
ptrkT =4 GeV to 0.2 mm at
ptrkT =20 GeV in the transverse plane and less than 1.0 mm in the longitudinal direction.
[GeV]
truth
pT
1 10 102
Tracking Efficiency
0.4 0.5 0.6 0.7 0.8 0.9 1
1.1 ATLAS Simulation Preliminary
= 5.02 TeV s pp
< -2.0
truth
η -2.5 <
< -1.0
truth
η -2.0 <
< 1.0
truth
η -1.0 <
< 2.0
truth
η 1.0 <
< 2.5
truth
η 2.0 <
[GeV]
truth
pT
10 102
Tracking Efficiency
0.4 0.5 0.6 0.7 0.8 0.9 1
1.1 ATLAS Simulation Preliminary -1.0 < ηtruth < 1.0 = 5.02 TeV
sNN
Pb+Pb
0 - 10%
60 - 80%
Figure 1: Tracking efficiency as a function ofptruthT inppcollisions in five different pseudorapidity intervals (left) and in Pb+Pb collisions (right) for 0–10% and 60–80% centrality. In both plots the curves show the fits to the efficiencies. ForptruthT above 150 GeV inppcollisions and above 350 GeV in Pb+Pb collisions a constant value of the efficiency is used to avoid fluctuations due to limited MC statistics.
The e
fficiency for reconstructing charged particles within jets in Pb
+Pb and
ppcollisions is evaluated using MC samples described above based on matching the tracks to MC primary “truth” particles3. The charged particle reconstruction efficiencies as a function of the primary particle transverse momentum,
pTtruth, are shown in Figure 1 in
ppand Pb
+Pb collisions. The tracking e
fficiencies are determined in coarse
ηtrkintervals. The
ptruthTdependence of the efficiencies is parameterized using a functional form that describes trends in the range of particle
pTtruthfrom 4.0 to 150 GeV in
ppcollisions and to 350 GeV in Pb
+Pb collisions. A constant e
fficiency value is used for higher
ptrkTin both systems in order to smooth fluctuations in the e
fficiency due to the limited MC statistics. To account for the finer scale variations of the tracking efficiency with pseudorapidity, the parameterizations are multiplied by an
η-dependent scalefactor evaluated in
ηtrkintervals of 0.1 units in coarse
ptruthTintervals. Further, tracks in the core of high
pTjets are more likely to be lost than more isolated tracks [23]. This e
ffect introduces
pjetTdependent ine
fficiency of the charged particle reconstruction. This is corrected for by an additional rescaling of the efficiency in a given
pTjetbin. The correction reaches 20% for the highest
pTjets. Reconstructed tracks which cannot be associated to a generated primary particle in the MC samples produced without data overlay and the residual contribution of tracks associated to secondary particles are together called “fake”
tracks.
3Primary particles are defined as particles with a mean lifetimeτ >0.3×10⁻¹⁰s either directly produced inppinteractions or from subsequent decays of particles with a shorter lifetime. All other particles are considered to be secondary.
5 Analysis Procedure
Reconstructed charged tracks are associated with a reconstructed jet if they fall within
∆R <0.4 of the jet axis. For each of these particles the longitudinal momentum fraction,
z, is calculated. The measured fragmentation functions are constructed as:
D(z)mea s ≡
1
Njet1
ε(η
trk,ptrkT ,pjetT)
∆Nch
(z)
∆z
(5)
and
D(pT
)
mea s ≡1
Njet1
ε(ηtrk,ptrkT ,pjetT)
∆Nch
(
ptrkT)
∆ptrkT
(6)
where
ε(ηtrk,pTtrk,pTjet) is the track reconstruction efficiency, and
Njetis the total number of jets in a given bin. The quantities
∆Nch(z ) and
∆Nch(
ptrkT) are the number of associated tracks within the given
zor
ptrkTrange, respectively. The e
fficiency correction is applied on a track-by-track basis, assuming
pTtrk = ptruthT. While that assumption is not strictly valid, the efficiency varies sufficiently slowly with
ptruthTthat the error introduced by this assumption is less than 1%.
First, the measured distributions are corrected for the presence of fake tracks. The contribution from these tracks to the fragmentation functions is estimated in the MC samples and subtracted from the measured fragmentation functions in both
ppand Pb
+Pb collisions. The fake contribution was found to be smaller than 2% for tracks satisfying the previously defined selection requirements.
In Pb+Pb collisions, contributions to the fragmentation functions from the UE are subtracted. The UE is a function of
pTtrk,
ηtrk, and the event centrality. The UE contribution is determined using a grid of
R=0.4 cones spanning the full coverage of the inner detector and following the method introduced in Ref. [5]. The cones have a fixed distance between their centers chosen such that the coverage of the inner detector is maximized while avoiding overlaps. Any cone having a charged particle with
pT >10 GeV or overlapping with a reconstructed jet with
pT >90 GeV is assumed to be associated with a hard process and is excluded from the UE estimation.
The estimated contribution from the UE is further corrected to account for the di
fference in the average UE yield at a given
ptrkTbetween the
ηposition of the cone and
ηposition of the jet. Separately, a correction is applied to the charged particle UE estimate to account for the di
fference in the azimuthal particle density, due to elliptic flow, between the position of the cone and the position of the jet. This utilizes a parameterization of the elliptic flow coefficients,
v2, measured by ATLAS [24]. The UE contribution is further corrected for the correlation between the actual UE yield underneath the jet and the jet energy resolution. This e
ffect is corrected by multiplicative correction factors, depending on
ptrkT(track
z), pTjet, and centrality. The correction is estimated using the MC samples, as a ratio of UE distributions calculated from tracks within the area of a jet that do not have an associated truth particle and the UE distributions estimated by the cone method. The corrected UE distributions are then subtracted from the measured distributions. The maximum size of the UE contribution is 20% in the most central collisions for the lowest
ptrkTused in this measurement. No UE subtraction is performed for the
ppmeasurement.
To remove the e
ffects of the bin migration due to the jet energy and track momentum resolution, the mea-
sured fragmentation functions after the UE correction (in Pb+Pb collisions) and fake track subtraction are
corrected by using a two-dimensional Bayesian unfolding procedure [25] as implemented in the RooUn-
fold package [26]. The two dimensional unfolding is used because the jet energy response depends on the
fragmentation pattern of the jet. Using the MC samples, four-dimensional response matrices are created using the truth and reconstructed
pjetTand the truth and reconstructed track
z(or
pT). Separate unfolding matrices are constructed for
ppdata and each centrality in Pb
+Pb collisions. A separate one-dimensional Bayesian unfolding is used to correct the measured
pTjetspectra which are needed to normalize the un- folded fragmentation functions. To achieve better correspondence with the data, the simulated jet spectra and fragmentation functions are re-weighted to match the shapes in the reconstructed data. Four iterations are used for unfolding both the Pb
+Pb and
ppdata. This procedure is tested by dividing the MC events in half and using one half to generate response matrices with which the other half is unfolded. Good recovery of the truth MC distributions is observed for the unfolded events. The deviations from exact recovery of the truth MC distributions, the non-closure, are included in the systematic uncertainties.
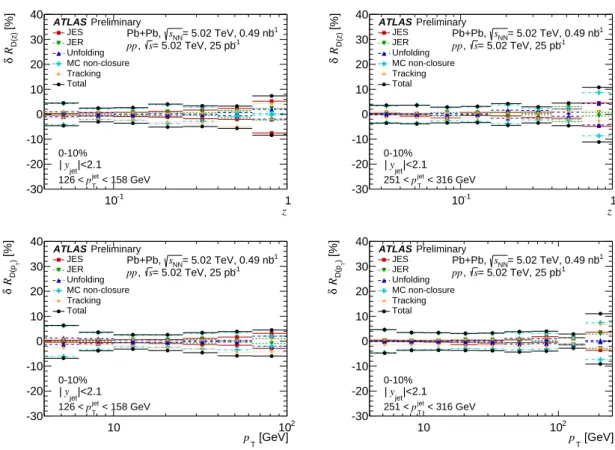
6 Systematic Uncertainties
The following sources of systematic uncertainty are considered: the jet energy scale (JES), the jet energy resolution (JER), the sensitivity of the unfolding to the prior, the residual non-closure of the analysis procedure, and tracking-related uncertainties. For each systematic variation the fragmentation functions and ratios of
D(z) and D(pT) distributions in Pb+Pb and
ppcollisions are re-evaluated. The difference between the varied and nominal distributions is used as an estimate of the uncertainty. The systematic uncertainties on the
D(z) andD(pT) measurements in both collision systems are summarized in Figures 2 and 3, respectively, for two different
pjetTbins. The systematic uncertainties from each source are assumed to be uncorrelated and are thus combined in quadrature to obtain the total systematic uncertainty.
The systematic uncertainty due to the JES in Pb
+Pb collisions is composed of two parts: an absolute, centrality-independent component, and a centrality-dependent component. Only the absolute component is used in
ppcollisions. The absolute component is determined from
in situstudies of the calorimeter response [27–29], and studies of the relative energy scale di
fference between the jet reconstruction proce- dure in heavy-ion collisions [28] and the procedure used in
ppcollisions [30]. The centrality dependent uncertainty reflects a modification of parton showers by the Pb
+Pb environment. It was evaluated by comparing calorimeter
pjetTand the sum of
pTof tracks within the jet in data and MC. The size of the centrality dependent uncertainty on the JES reaches 0.5% in the most central collisions. Each component that contributes to the JES uncertainty is varied separately by
±1 standard deviation for each interval in
pTjetand the response matrix is recomputed accordingly. The data are unfolded with these matrices. The resulting uncertainty from the JES increases with increasing
zand particle
pTat fixed
pTjet.
The uncertainty on the fragmentation functions due to the JER is evaluated by repeating the unfolding procedure with modified response matrices, where an additional increase to the resolution of the re- constructed
pTjetis added with a Gaussian smearing. The smearing factor is evaluated using an
in situtechnique involving studies of dijet energy balance [31, 32]. The systematic uncertainty due to the JER increases with increasing
zand particle
pTat fixed
pjetT.
The unfolding uncertainty is estimated by generating the response matrices from the MC distributions without re-weighting in
pjetTand
D(z). A separate uncertainty for residual limitations in the unfolding procedure was assigned by evaluating the non-closure of the unfolded distributions in simulations, as described in Sec. 5.
The uncertainties related to track reconstruction and selection originate from several sources. Uncer-
tainties related to the fake rate, the material description in simulation, and the track momentum were
z
10-1 1
[%]D(z)δ
-30 -20 -10 0 10 20 30 40
JES JER Unfolding MC non-closure Tracking Total
|<2.1 yjet
|
ATLAS Preliminary
= 5.02 TeV sNN
Pb+Pb 2015, 0.49 nb-1
< 158 GeV
jet
pT
126 <
0-10%
z
10-1 1
[%]D(z)δ
-30 -20 -10 0 10 20 30 40
JES JER Unfolding MC non-closure Tracking Total
|<2.1 yjet
|
ATLAS Preliminary
= 5.02 TeV sNN
Pb+Pb 2015, 0.49 nb-1
< 316 GeV
jet
pT
251 <
0-10%
z
10-1 1
[%]D(z)δ
-30 -20 -10 0 10 20 30 40
JES JER Unfolding MC non-closure Tracking Total
|<2.1 yjet
|
ATLAS Preliminary
= 5.02 TeV s
2015, 25 pb-1
pp
< 158 GeV
jet
pT
126 <
z
10-1 1
[%]D(z)δ
-30 -20 -10 0 10 20 30 40
JES JER Unfolding MC non-closure Tracking Total
|<2.1 yjet
|
ATLAS Preliminary
= 5.02 TeV s
2015, 25 pb-1
pp
< 316 GeV
jet
pT
251 <
Figure 2: Summary of the systematic uncertainties on theD(z) distributions in 0–10% central Pb+Pb collisions (top) andppcollisions (bottom) for jets in the 126–158 GeVpjetT interval (left) and in the 251–316 GeVpjetT interval (right). The systematic uncertainties due to JES, JER, unfolding, MC non-closure and tracking are shown along with the total systematic uncertainty from all sources.
obtained from studies in data and simulation described in Ref. [33]. The systematic uncertainty on the fake track rate is 30% in both collision systems [33]. The contamination of fake tracks is less than 2%
and the resulting uncertainty on the fragmentation functions is at most 0.5%. The sensitivity of the track- ing e
fficiency to the description of the inactive material in the MC samples is evaluated by varying the material description. This resulting uncertainty on the track reconstruction efficiency is between 0.5 and 2% in the track
pTrange used in the analysis. The uncertainty on the track momentum from the detector alignment is up 15% on the fragmentation functions at highest
zand
pjetT. An additional uncertainty on the tracking e
fficiency due to the high local track density in the core of jets is 0.4% [23] for all
pTjetse- lections in this analysis. The uncertainty due to the track selection is evaluated by repeating the analysis with an additional requirement on the significance of the distance of closest approach of the track to the primary vertex. This uncertainty a
ffects both the track reconstruction e
fficiencies and rate of fake tracks.
The resulting uncertainty typically varies from 1% at low track
pTto 5% at high track
pT. Additionally, there is a statistical uncertainty on the parameterization of the efficiency corrections. Finally, the track- to-particle association requirements are varied. This variation a
ffects the track reconstruction e
fficiency, track momentum resolution, and rate of fake tracks. New response matrices and efficiency corrections are derived and the resulting systematic uncertainty is less than 0.5% on the fragmentation functions.
Figures 2 and 3 present the total tracking uncertainty where all track-related systematic uncertainties are
added in quadrature.
[GeV]
pT
10 102
[%]) TD(pδ
-30 -20 -10 0 10 20 30 40
JES JER Unfolding MC non-closure Tracking Total
|<2.1 yjet
|
ATLAS Preliminary
= 5.02 TeV sNN
Pb+Pb 2015, 0.49 nb-1
< 158 GeV
jet
pT
126 <
0-10%
[GeV]
pT
10 102
[%]) TD(pδ
-30 -20 -10 0 10 20 30 40
JES JER Unfolding MC non-closure Tracking Total
|<2.1 yjet
|
ATLAS Preliminary
= 5.02 TeV sNN
Pb+Pb 2015, 0.49 nb-1
< 316 GeV
jet
pT
251 <
0-10%
[GeV]
pT
10 102
[%]) TD(pδ
-30 -20 -10 0 10 20 30 40
JES JER Unfolding MC non-closure Tracking Total
|<2.1 yjet
|
ATLAS Preliminary
= 5.02 TeV s
2015, 25 pb-1
pp
< 158 GeV
jet
pT
126 <
[GeV]
pT
10 102
[%]) TD(pδ
-30 -20 -10 0 10 20 30 40
JES JER Unfolding MC non-closure Tracking Total
|<2.1 yjet
|
ATLAS Preliminary
= 5.02 TeV s
2015, 25 pb-1
pp
< 316 GeV
jet
pT
251 <
Figure 3: Summary of the systematic uncertainties on theD(pT) distributions in 0–10% central Pb+Pb collisions (top) andppcollisions (bottom) for jets in the 126–158 GeVpjetT interval (left) and in the 251–316 GeVpjetT interval (right). The systematic uncertainties due to JES, JER, unfolding, MC non-closure and tracking are shown along with the total systematic uncertainty from all sources.
The correlations between the various systematic components are considered in taking the ratios of Pb
+Pb to
ppfragmentation functions. The unfolding, the MC non-closure and the uncertainty on the parameter- ization of the e
fficiency correction are each taken to be uncorrelated between the two collision systems.
All other uncertainties are taken to be correlated. The total systematic uncertainties on the
RD(z)and
RD(pT)distributions are shown in Figure 4 for two
pjetTintervals.
7 Results
In this section results of the measurement of the
D(z) and D(pT) distributions in the
√sNN =
5.02 TeV
Pb
+Pb and
ppcollisions are presented. The measurement is performed over the kinematic range of
jet transverse momentum 126
< pjetT <501 GeV with absolute jet rapidity
|y| <2.1 and for charged
particles with
pT >4 GeV. At the lowest
pjetTinterval the results are presented in six centrality selections
and in the most central 10% of Pb+Pb collisions and
ppcollisions for six logarithmically spaced jet
pTintervals: 126
< pTjet <158 GeV, 158
< pTjet <200 GeV, 200
< pjetT <251 GeV, 251
< pjetT <316
GeV, 316
< pjetT <398 GeV, and 398
< pjetT <501 GeV. The fragmentation functions all decrease with
increasing
pTand
z. The D(pT) and
D(z) distributions evaluated in six centrality classes for jets withz
10-1 1
[%]D(z)Rδ
-30 -20 -10 0 10 20 30 40
JES JER Unfolding MC non-closure Tracking Total
|<2.1 yjet
|
ATLAS Preliminary
= 5.02 TeV, 0.49 nb-1
sNN
Pb+Pb,
= 5.02 TeV, 25 pb-1
, s pp
< 158 GeV
jet
pT
126 <
0-10%
z
10-1 1
[%]D(z)Rδ
-30 -20 -10 0 10 20 30 40
JES JER Unfolding MC non-closure Tracking Total
|<2.1 yjet
|
ATLAS Preliminary
= 5.02 TeV, 0.49 nb-1
sNN
Pb+Pb,
= 5.02 TeV, 25 pb-1
, s pp
< 316 GeV
jet
pT
251 <
0-10%
[GeV]
pT
10 102
[%])TD(pRδ
-30 -20 -10 0 10 20 30 40
JES JER Unfolding MC non-closure Tracking Total
|<2.1 yjet
|
ATLAS Preliminary
= 5.02 TeV, 0.49 nb-1
sNN
Pb+Pb,
= 5.02 TeV, 25 pb-1
, s pp
< 158 GeV
jet
pT
126 <
0-10%
[GeV]
pT
10 102
[%])TD(pRδ
-30 -20 -10 0 10 20 30 40
JES JER Unfolding MC non-closure Tracking Total
|<2.1 yjet
|
ATLAS Preliminary
= 5.02 TeV, 0.49 nb-1
sNN
Pb+Pb,
= 5.02 TeV, 25 pb-1
, s pp
< 316 GeV
jet
pT
251 <
0-10%
Figure 4: Summary of the systematic uncertainties for 0–10% centralRD(z) (top) andRD(pT)(bottom) ratios, for jets in the 126–158 GeVpjetT interval (left) and in the 251-316 GeVpTjetinterval (right). The systematic uncertainties due to JES, JER, unfolding, MC non-closure and tracking are shown along with the total systematic uncertainty from all sources.
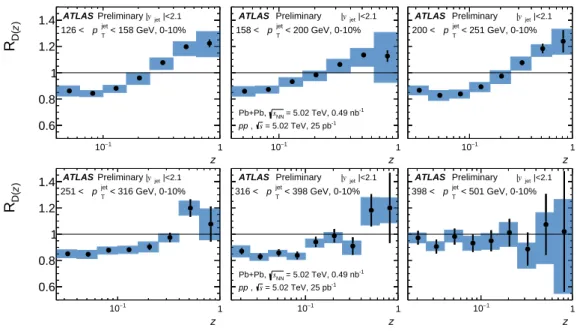
126
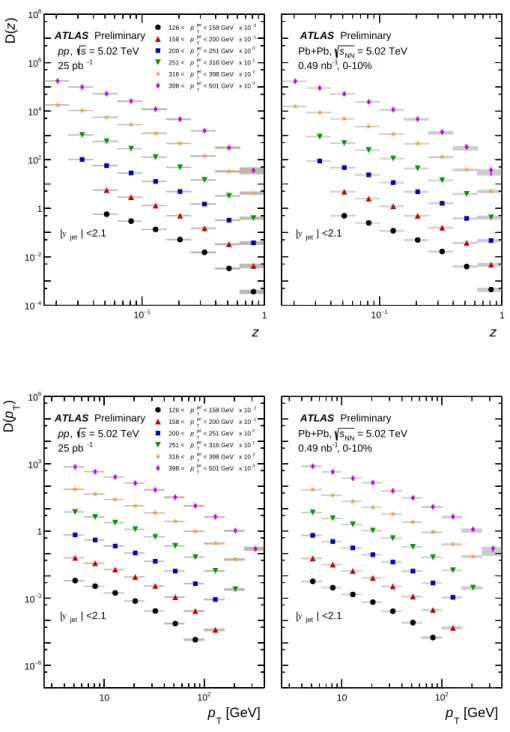
< pTjet <158 GeV are shown in Figure 5. Figure 6 presents the
D(pT) and
D(z) distributions inppcollisions and 0–10% central Pb+Pb collisions as a function of both
zand
pTfor six
pjetTselections from 126 GeV to 501 GeV. The shaded boxes indicate the total systematic uncertainty, the error bars represent the statistical uncertainties.
To quantify the difference between fragmentation functions in Pb+Pb and
ppcollisions the ratios of
D(pT) and
D(z) distributions measured in heavy ion collisions to those measured inppcollisions,
RD(pT)and
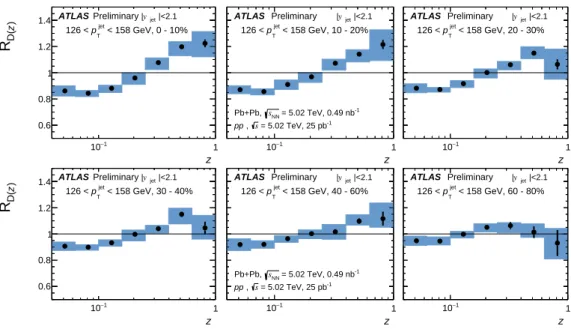
RD(z), were evaluated. The ratios of the fragmentation functions are shown in Figures 7 and 8 for the six centrality classes for jets with 126
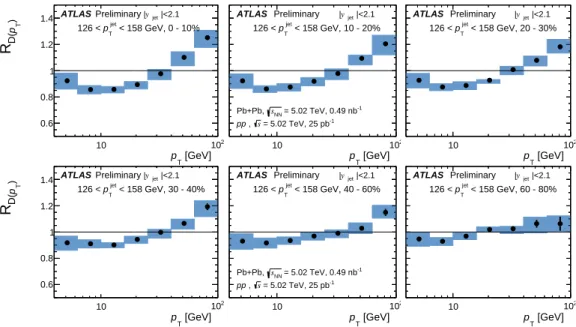
< pjetT <158 GeV.
The magnitude of the deviation of the ratios from unity in both cases decreases with decreasing collision
centrality. The shapes of the modifications are similar in all centralities with a suppression for
z(p
T) be-
low approximately 0.2 (20 GeV) and an enhancement at higher
z(p
T). In the 0–10% central collisions the
enhancement is approximately 20% at the highest
zand
pTvalues and the suppression is approximately
15% at the lowest
zand
pTvalues. This is qualitatively consistent with previous ATLAS measurements
at 2.76 TeV [5]. Due to the 4 GeV track
pTcut in this analysis, there is no sensitivity to the low
z(p
T)
enhancement seen at 2.76 TeV. For the 0–10% and 10–20% centralities an enhancement is observed for
z >0.3. For the 20–60% central collisions a high
zenhancement is still observed, but the systematic
uncertainties limit the sensitivity at the highest
zvalue. In the
RD(pT) ratios a high
pTenhancement and
z
−1
10 1
) zD(
−5
10
−3
10
−1
10 10 103
105
107
| <2.1 yjet
| ATLAS
= 5.02 TeV, 0.49 nb-1
sNN
Pb+Pb,
Preliminary
< 158 GeV
jet
pT
126 <
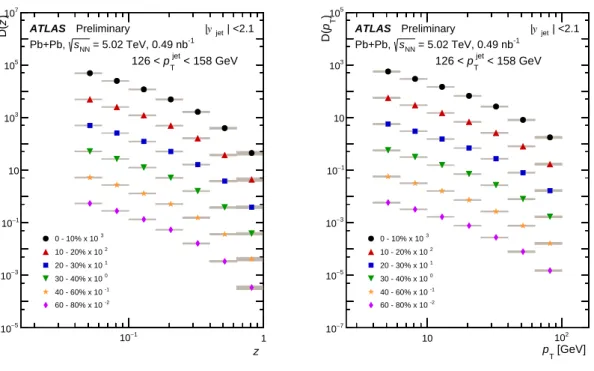
0 - 10% x 10 3 10 - 20% x 10 2 20 - 30% x 10 1 30 - 40% x 10 0 40 - 60% x 10 -1 60 - 80% x 10 -2
[GeV]
pT
10 102
) TpD(
−7
10
−5
10
−3
10
−1
10 10 103
105
| <2.1 yjet
| ATLAS
= 5.02 TeV, 0.49 nb-1
sNN
Pb+Pb,
Preliminary
< 158 GeV
jet
pT
126 <
0 - 10% x 10 3 10 - 20% x 10 2 20 - 30% x 10 1 30 - 40% x 10 0 40 - 60% x 10 -1 60 - 80% x 10 -2
Figure 5: Fragmentation functions in centrality classes asD(z) (left) andD(pT) (right) in Pb+Pb forpjetTof 126 to 158 GeV. The shaded boxes are systematic uncertainties. The statistical uncertainties are shown as bars which are smaller than the points. The centrality classes are offset by scale factors as indicated in the legend.
low
pTdepletion is observed for the 0–60% central collisions. In the 60–80% centrality interval
RD(z )
and
RD(p
T) show a slight depletion at low
zand
pTand no significant high
zand
pTenhancement.
z
−1
10 1
) zD(
−4
10
−2
10 1 102
104
106
108
| <2.1 yjet
| ATLAS
= 5.02 TeV s
, pp 25 pb -1
Preliminary
< 158 GeV x 10 -2 jet
p T 126 <
< 200 GeV x 10 -1 jet
p T 158 <
< 251 GeV x 10 0 jet
p T 200 <
< 316 GeV x 10 1 jet
p T 251 <
< 398 GeV x 10 2 jet
p T 316 <
< 501 GeV x 10 3 jet
p T 398 <
z
−1
10 1
) TpD(
| <2.1 yjet
| ATLAS
= 5.02 TeV sNN
Pb+Pb, , 0-10%
0.49 nb-1
Preliminary
[GeV]
pT
10 102
) TpD(
−6
10
−3
10 1 103
106
| <2.1 yjet
| ATLAS
= 5.02 TeV s
, pp 25 pb -1
Preliminary
< 158 GeV x 10 -2 jet
p T 126 <
< 200 GeV x 10 -1 jet
p T 158 <
< 251 GeV x 10 0 jet
p T 200 <
< 316 GeV x 10 1 jet
p T 251 <
< 398 GeV x 10 2 jet
p T 316 <
< 501 GeV x 10 3 jet
p T 398 <
[GeV]
pT
10 102
) TpD(
| <2.1 yjet
| ATLAS
= 5.02 TeV sNN
Pb+Pb, , 0-10%
0.49 nb-1
Preliminary
Figure 6:D(z) (top) and D(pT) (bottom) distributions in ppcollisions (left) and 0-10% central Pb+Pb collisions (right) for the sixpjetT selections used in this analysis. The shaded boxes are systematic uncertainties. The statistical uncertainties are shown as bars which are in many cases smaller than the points. ThepjetT intervals are offset by scale factors as indicated in the legend.
Figures 9 and 10 show the ratios of fragmentation functions, as a function of
zand
pT, respectively, in central Pb+Pb collisions to those in
ppcollisions for jets with 126
< pjetT <501 GeV. A similar shape to the modifications of the fragmentation functions is seen in all
pjetTselections except in the 398–
501 GeV jets where the
RD(z ) has limited statistical precision. The
RD(p
T) distributions show a similar shape but the
pTwhere the ratio crosses unity varies as a function of
pTjet. This is expected because the
RD(z) enhancement shows no significant
zdependence and the track
pTwhich contributes to a given
zrange varies with
pjetT. For tracks with
pT =100 GeV there is an approximately 20% enhancement for 126–158 GeV jets whereas for jets with
pjetTbetween 251–501 GeV the same track
pThas an
RD(pT) consistent with unity. The lack of
pjetTdependence to the
RD(z) distributions is illustrated in the leftpanel of Figure 11 which overlays the fragmentation functions for jets in the ranges 126–158 GeV, 200–
251 GeV and 316–398 GeV. No significant di
fference is observed. The
RD(z) distributions for 126–158 GeV at 5.02 TeV are compared to those previously measured [34] at
√sNN =
2.76 TeV in the right panel of Figure 11. The
RD(z ) is found to be consistent at the two collision energies in the
zregion where the measurements overlap. For
z <0.04
RD(z ) in 2.76 TeV collisions increases sharply, however the measurement at 5.02 TeV does not include these
zvalues.
z
−1
10 1
)zD(R
0.6 0.8 1 1.2
1.4 ATLAS Preliminary|yjet |<2.1 < 158 GeV, 0 - 10%
jet
pT
126 <
z
−1
10 1
)zD(R
|<2.1 yjet
| ATLAS Preliminary
= 5.02 TeV, 0.49 nb-1
sNN
Pb+Pb,
= 5.02 TeV, 25 pb-1
s , pp
< 158 GeV, 10 - 20%
jet
pT
126 <
z
−1
10 1
)zD(R
|<2.1 yjet
| ATLAS Preliminary
< 158 GeV, 20 - 30%
jet
pT
126 <
z
−1
10 1
)zD(R
0.6 0.8 1 1.2
1.4 ATLAS Preliminary|yjet |<2.1 < 158 GeV, 30 - 40%
jet
pT
126 <
z
−1
10 1
)zD(R
|<2.1 yjet
| ATLAS Preliminary
= 5.02 TeV, 0.49 nb-1
sNN
Pb+Pb,
= 5.02 TeV, 25 pb-1
, s pp
< 158 GeV, 40 - 60%
jet
pT
126 <
z
−1
10 1
)zD(R
|<2.1 yjet
| ATLAS Preliminary
< 158 GeV, 60 - 80%
jet
pT
126 <
Figure 7: Centrality dependence of the ratios ofD(z) in Pb+Pb collisions to those inppcollisions forpjetTof 126 to 158 GeV. The statistical uncertainties are shown as bars and the systematic uncertainties are shown as shaded areas.
8 Summary
This note presents measurements of jet charged particle fragmentation functions and distributions of charged particle transverse momenta within
R=0.4 anti-k
tjets with
|yjet| <2.1 and in the interval of pTjetfrom 126 to 501 GeV in Pb
+Pb and
ppcollisions at 5.02 TeV. The measurement is performed as a function of event centrality and jet
pT, and uses charged particles with
pT >4 GeV.
A centrality dependent modification to these fragmentation functions when compared to those measured
[GeV]
pT
10 102
)TpD(R
0.6 0.8 1 1.2
1.4 ATLAS Preliminary|yjet |<2.1 < 158 GeV, 0 - 10%
jet
pT
126 <
[GeV]
pT
10 102
)TpD(R
|<2.1 yjet
ATLAS Preliminary |
= 5.02 TeV, 0.49 nb-1
sNN
Pb+Pb,
= 5.02 TeV, 25 pb-1
, s pp
< 158 GeV, 10 - 20%
jet
pT
126 <
[GeV]
pT
10 102
)TpD(R
|<2.1 yjet
ATLAS Preliminary |
< 158 GeV, 20 - 30%
jet
pT
126 <
[GeV]
pT
10 102
)TpD(R
0.6 0.8 1 1.2
1.4 ATLAS Preliminary|yjet |<2.1 < 158 GeV, 30 - 40%
jet
pT
126 <
[GeV]
pT
10 102
)TpD(R
|<2.1 yjet
ATLAS Preliminary |
= 5.02 TeV, 0.49 nb-1
sNN
Pb+Pb,
= 5.02 TeV, 25 pb-1
s , pp
< 158 GeV, 40 - 60%
jet
pT
126 <
[GeV]
pT
10 102
)TpD(R
|<2.1 yjet
ATLAS Preliminary |
< 158 GeV, 60 - 80%
jet
pT
126 <
Figure 8: Centrality dependence of the ratios ofD(pT) in Pb+Pb collisions to those inppcollisions forpjetTof 126 to 158 GeV. The statistical uncertainties are shown as bars and the systematic uncertainties are shown as shaded areas.
in
ppcollisions is observed. In the most central collisions, this modification has no significant jet trans- verse momentum dependence over the kinematic range accessible in the measurement. The
RD(z ) values are found to be consistent with those previously measured at
√sNN =