A TLAS-CONF-2017-012 08 Febr uary 2017
ATLAS NOTE
ATLAS-CONF-2017-012
6th February 2017
Measurement of the nuclear modification factor R AA in Pb + Pb collisions at √
s NN = 5.02 TeV with the ATLAS detector at the LHC
The ATLAS Collaboration
Abstract
Measurements of charged hadron spectra and the nuclear modification factor in Pb+Pb colli- sions at √
s
NN= 5.02 TeV with the ATLAS detector at the LHC are presented. The measure- ments are performed using data with an integrated luminosity of 0.49 nb −1 in Pb + Pb colli- sions and 25 pb −1 in pp collisions, obtained in the 2015 LHC physics run. Charged hadron Pb+Pb spectra measured in several centrality intervals are divided by pp spectrum to form the nuclear modification factor, R AA , which provides insight into the e ff ects of jet quenching in nuclear collisions. The behavior of R AA is studied as a function of transverse momentum up to 300 GeV in different centralities. The values of R AA measured at √
s
NN= 5.02 TeV are found to be consistent with the previous measurements at √
s
NN= 2.76 TeV published by the ATLAS experiment.
c
2017 CERN for the benefit of the ATLAS Collaboration.
Reproduction of this article or parts of it is allowed as specified in the CC-BY-4.0 license.
1 Introduction
Measurements of charged particle spectra provide insight into the properties of the hot and dense medium in ultra-relativistic heavy ion collisions [1]. Charged particle spectra, jet fragmentation and jet yields are three of the most important, and complementary, observables used to understand the mechanism of jet energy loss. Transverse momentum distributions of charged particles measured in the presence of hot and dense matter formed in interactions of heavy ions can be compared with the analogous measurement in pp collisions. This is done using the nuclear modification factor R AA , defined as the ratio of normalized yields in Pb+Pb and pp collision systems:
R AA (p T ) = 1 hT AA i
1/N evt d 2 N Pb+Pb /dηdp T
d 2 σ pp /dηdp T , (1)
where (1/N evt )d 2 N Pb + Pb /dηd p T is the double differential distribution of the yield of charged hadrons per event measured in Pb+Pb collisions as a function of transverse momentum (p T ) and pseudorapidity (η) 1 , and d 2 σ pp /dηd p T is the double di ff erential cross section in the pp system. The nuclear thickness function, T AA , is e ff ectively a “per collision luminosity”. It is fully defined by the collision geometry of the overlapping nuclei. Head-on collisions where the nuclei have significant overlap (i.e. small impact parameter) are called “central”, while collisions with small overlap (i.e. large impact parameter) are called
“peripheral”. The value of hT AA i is evaluated for each Pb + Pb collision centrality class which is defined by percentiles of the inclusive sample of inelastic Pb+Pb collisions. Centrality of 0–1% would represent the 1% of all events with largest overlap while 99–100% centrality class would represent the 1% of all events with the lowest overlap. If nucleon–nucleon collisions were completely independent, R AA would be unity.
The centrality is determined by measuring the total multiplicity or transverse energy deposited in a refer- ence detector, whose acceptance typically does not overlap with acceptance region of the measurement, and categorizing the events into percentile classes based on these observables. Depending on the particu- lar triggers used, the most peripheral events may not be recorded.
The CMS collaboration performed a measurement of the inclusive charged particle production in Pb+Pb and pp collisions at √
s
NN= 5.02 TeV [2] that shows an increase of R AA for p T & 9 GeV, which continues up to the highest p T measured and approaches unity at p T ≈ 200 GeV. The R AA measured are broadly similar to those measured at √
s
NN= 2.76 TeV by ATLAS [3], CMS [4] and ALICE [5].
2 The ATLAS detector
The measurements presented in this note are performed using the ATLAS inner detector (ID), calorimeter system, muon spectrometers, trigger system and data acquisition system [6]. The ID measures the trajec- tories of charged particles with a combination of a silicon pixel detector (Pixel), including the innermost
“insertable B-layer”, which was installed after 2013 data taking, a silicon micro-strip detector (SCT), and a straw-tube transition radiation tracker (TRT), all of which are immersed in a 2 T axial magnetic field. A
1
ATLAS uses a right-handed coordinate system with its origin at the nominal interaction point (IP) in the centre of the detector and the z-axis along the beam pipe. The x-axis points from the IP to the centre of the LHC ring, and the y-axis points upwards. Cylindrical coordinates (r, φ) are used in the transverse plane, φ being the azimuthal angle around the z-axis.
The pseudorapidity is defined in terms of the polar angle θ as η = −ln tan(θ/2). Angular distance is measured in units of
∆ R ≡ p
( ∆η)
2+ ( ∆φ)
2.
particle with p T > 1 GeV emerging from the IP within |η| < 2 typically crosses at least 4 pixel layers, 4 double sided micro-strip layers and 36 straw tubes.
The calorimeter system consists of a liquid argon (LAr) electromagnetic (EM) calorimeter covering |η| <
3.2, a steel-scintillator sampling hadronic calorimeter covering |η| < 1.7, a LAr hadronic calorimeter covering 1.5 < |η| < 3.2, and two LAr forward calorimeters (FCal) covering 3.2 < |η| < 4.9. The EM calorimeters are longitudinally segmented into three layers with an additional pre-sampler layer. Together, they typically provide around 10 nuclear interaction lengths of material. The zero degree calorimeter (ZDC) consists of two arms, each positioned at z ± 140 m from the centre of the detector, and detects neutral, unbent, particles with |η| > 8.3.
The muon spectrometer covers |η| < 2.7. It uses monitored drift tubes, cathode strip chambers, resistive plate chambers and thin gap chambers. The first two systems provide a high-precision measurement of p T and the latter two systems are used also for triggering.
Data are recorded with a multi-stage trigger system [7]. Events are selected using hardware-based Level-1 triggers (L1) and then processed by a high-level trigger (HLT) to provide additional rejection and purity.
3 Centrality of Pb + Pb collisions
The centrality of Pb + Pb collisions is characterized using the total transverse energy measured on both sides of the FCal, Σ E T . A study based on the Glauber model [8] estimated the fraction of inelastic collisions that deposited Σ E T > 40 GeV to be 85 ± 1% [9, 10]. The Σ E T distribution in Pb + Pb collisions is taken to be a multiple convolution of the Σ E T distribution in pp collisions with itself. A two-component model [11] is used to estimate the average level of particle production. Table 1 provides values of hT AA i and hN part i in di ff erent centrality intervals that are used in this analysis, where N part is the number of participating nucleons.
Centrality hN part i hT AA i [mb −1 ] Centrality hN part i hT AA i [mb −1 ] 0–5% 384.5 ± 1.9 26.23 ± 0.22 30–40% 131.4 ± 2.6 4.95 ± 0.15 5–10% 333.1 ± 2.7 20.47 ± 0.20 40–50% 87.0 ± 2.4 2.63 ± 0.11 10–20% 264.1 ± 2.9 14.33 ± 0.18 50–60% 53.9 ± 2.0 1.28 ± 0.07 20–30% 189.2 ± 2.8 8.64 ± 0.17 60–80% 23.0 ± 1.3 0.394 ± 0.032 Table 1: Mean values of N
partand T
AAfor centrality intervals used in the analysis as well as their systematic uncertainties.
4 Data samples and event selection
The Pb+Pb data sample, with an integrated luminosity of 0.49 nb −1 , was obtained during the LHC physics run at √
s
NN= 5.02 TeV in 2015. Events were recorded with two minimum bias (MB) triggers and
with four jet triggers. The MB triggers required either 50 GeV transverse energy recorded in the whole
calorimeter system or the presence of at least one neutron on both sides of the ZDC and a track identified
by the HLT.
The jet triggers used the anti-k t algorithm [12] with a radius parameter of R = 0.4 and p jet T thresholds of 50 GeV, 60 GeV, 75 GeV and 100 GeV, calibrated to the hadronic level. At least 20 GeV of total transverse energy in the calorimeter was required at L1 for the lowest jet threshold. For the other jet thresholds, the requirement was raised to 50 GeV. Events selected for analysis were required to have a reconstructed primary vertex no further than 150 mm from the centre of the detector along the beam axis. In order to suppress events with pile-up, events are also required to have deposited energy in the FCal less than 5 TeV.
To study the e ff ects of the detector response, Monte Carlo (MC) simulations were produced using the P ythia 8.2 [13] and H ijing [14] event generators. P ythia uses the A14 tune [15] and NNPDF2.3 PDF set [16]. Hard scattering pp events generated by Pythia were overlaid on Pb+Pb events generated by H ijing in order to obtain a realistic occupancy conditions corresponding to the environment of the heavy ion collisions. The detector response was then simulated by G eant 4 [17, 18] and reconstructed in the same way as the data.
The 25 nb −1 of pp data, also obtained by the ATLAS detector at √
s = 5.02 TeV in 2015, is discussed in detail in Ref. [19]. Data taking conditions and analysis were similar to Pb + Pb. The MB trigger required a track to be reconstructed in the ID system. The jet triggers also used the anti-k t algorithm with a radius parameter of R = 0.4, and with eight thresholds. The corresponding MC simulations used the P ythia 8.2 event generator and G eant 4.
5 Track selection and corrections to the charged particle spectra
Tracks are reconstructed using the ID system in the pseudorapidity region |η| < 2.5 and over the full azimuthal region. At least one hit is required in one of the two innermost layers of the Pixel detector if the reconstructed track passed through an active sensor. A track is allowed to have no more than two missing hits in the Pixel and SCT detectors if such hits are anticipated by the track trajectory. In addition, a track with |η| < 1.65 is required to have at least 9 hits in the Pixel and in the SCT detectors combined, and at least 11 hits if it has |η| > 1.65. No missing hits are allowed for tracks with less than 10 hits in the Pixel and SCT detectors combined. To ensure a good matching to the primary vertex, a p T - dependent requirement on the distance of the closest approach of the track to the event vertex is imposed on tracks. The significances d 0 /σ d
0and z 0 sin θ/σ z
0sin θ may not exceed 3, where d 0 and z 0 are transverse and longitudinal distances to the primary vertex, respectively.
Due to the large number of relatively low-p T tracks that can be misreconstructed as high-p T tracks in the high track density environment of heavy ion collisions, several steps are taken to reject them. Tracks in events recorded by jet triggers are required to be matched to a jet, reconstructed offline with the anti-k t
algorithm using a radius parameter of R = 0.4, within an angular distance ∆ R < 0.4. A track p T may not be much higher than p jet T to which it is matched. However, finite jet energy resolution must be taken into account. A momentum balance requirement p T < 1.3 × p jet T has to be satisfied by each track–jet pair, otherwise the track is rejected from the analysis. Tracks are only matched to jets firing triggers in the region of full trigger efficiency. In Pb+Pb collisions the jet trigger with the lowest transverse energy threshold of 50 GeV becomes fully e ffi cient at p jet T = 70 GeV.
Below this value, track–jet pairs are selected from the MB event sample. The lowest jet transverse energy to which tracks are matched is 30 GeV, defined by the jet reconstruction e ffi ciency. Tracks with p T <
1.3 × 30 = 39 GeV in the MB event sample are not required to be matched to jets.
Since the main observables in this analysis are the charged hadron spectra, leptons arising from the decays of heavy vector bosons are excluded from the measured spectra. Tracks forming part of reconstructed muons are identified and the contribution from stable leptons is subtracted twice from the measured spectra, assuming that electrons contribute the same as muons.
Apart from the specific features of the 2015 data taking, such as the additional pixel layer and jet energy thresholds in the jet triggers, this analysis closely follows previous ATLAS studies [3, 19] where more analysis details can be found.
The measured charged particle spectra are corrected for several e ff ects. All corrections are estimated from MC simulations. The first correction is for secondary and fake tracks. These are tracks matching to secondary particles 2 or they are spurious combinations of hits not associated with a single particle. This correction is estimated as a function of track p T and η. It is as much as 3% at p T . 2 GeV and |η| & 2.
The second correction is for the p T resolution. Iterative Bayesian unfolding [20] is used to correct for possible p T mismeasurement and bin-to-bin migration. The unfolding introduces a change of about 20%
for p T & 100 GeV, while its e ff ect at lower p T is much smaller. The third correction is for the track
reconstruction e ffi ciency, and corrects for generated particles which do not result in reconstructed and selected tracks. This correction is also estimated as a function of |η| and p T . The efficiency is around 80%
at low p T ( p T < 5 GeV), mid-rapidity (|η| . 1) and in peripheral collisions. Efficiencies at higher |η| are reduced by no more than 25% (in absolute scale). An additional reduction of no more than 5% (also in absolute scale) is obtained in the most central collisions.
6 Systematic uncertainties
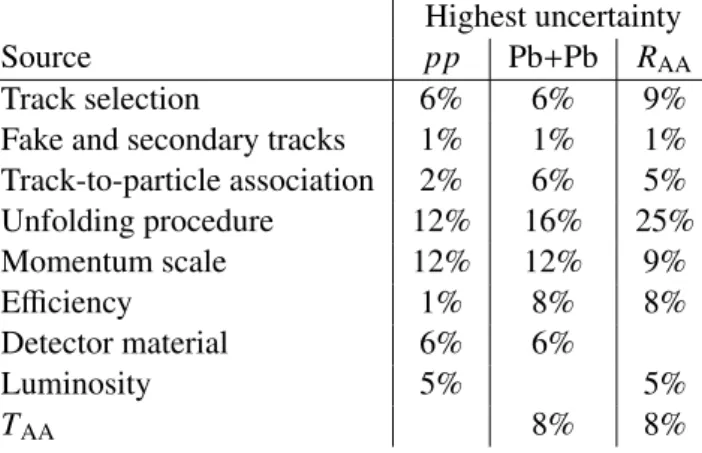
Systematic uncertainties in the measurement arise from several sources. They are evaluated by vary- ing individual sources and comparing the results to the results of the default analysis. The correlated components are taken into account to estimate the uncertainty on R AA . The overview of all systematic uncertainties is summarized in table 2. The following sources are considered:
• Track selection requirements. This uncertainty reflects possible differences in performance of the track reconstruction in data and MC. The requirements mentioned in Sec. 5 were tightened by requiring one more hit in Pixel and SCT detectors combined and more strict requirement on d 0 and z 0 , or loosened by requiring one hit less, allowing a presence of one hole in the Pixel detector and less strict requirement on d 0 and z 0 . The same changes were applied to data and MC simulation.
This results in an uncertainty on the cross section of 1% at p T ≈ 1 GeV and up to 6% at p T ≈ 300 GeV.
• Fake and secondary tracks. The uncertainty was estimated as 30% of the secondary and fake rate [21]. The systematic uncertainty is thus around 1% for the whole p T range measured.
• Track-to-particle association. The e ffi ciency, secondary and fake rate, and track momentum res- olution rely on a matching of the reconstructed tracks and generated particles. To account for ambiguities in the matching procedure, the matching probability is varied to assess a systematic uncertainty. The uncertainty is less than 2% at low p T , decreases at intermediate p T and rises up to 6% at the highest measured p T .
2
Particles with a lifetime longer than 0.3 × 10
−10s produced in nucleon–nucleon interactions or in decays of particles with
shorter lifetimes are considered to be primary; this includes strange baryons. All other particles are considered to be secondary.
• Unfolding procedure. This uncertainty has been estimated by introducing statistical fluctuations according to the MC statistical uncertainties in the migration matrices and comparing the resulting spectra to those obtained by the default matrices. The di ff erence is typically around 1% at low p T , however it reaches up to 14% at the highest p T . To reduce fluctuations introduced by the unfolding, bins with fewer than 10 entries in the migration matrices were ignored. This introduces another systematic uncertainty of up to 12%.
• Transverse momentum scale. At the time of this preliminary analysis, the differences in p T scale for muons measured in the ID and the muon spectrometer independently are not the same in data and MC simulation. The di ff erence is around 2% up to 25 GeV and then rises linearly in log p T up to around 6% at 300 GeV. The effect of the p T scale uncertainty in the ID has been estimated by changing the track p T by the difference between the measurements in the two ATLAS systems.
The resulting spectra change by up to 12%, which is taken as an uncertainty.
• Track reconstruction efficiency. Due to limited statistics in the MC sample, the extracted efficien- cies have been parametrized with a 2 nd -order polynomial in log(p T ). The di ff erence between the fit and actual value of the e ffi ciency is assigned as the uncertainty of the track reconstruction e ffi - ciency. It is up to 8% at the highest p T . The track reconstruction efficiency also depends on the description of the inactive material. This inactive material was varied in the MC simulations. The resulting uncertainty is between 1% at low |η| and 6% at high |η|.
• Integrated luminosity of the pp sample. Similar systematic uncertainties to those examined in Ref. [22] were studied in order to assess the systematic uncertainties for the pp data. The uncer- tainty is 5.4%.
• Centrality-related geometric parameters, hT AA i and hN part i. The uncertainties are largest in the peripheral centrality interval where they are 8% and 6%, respectively [10]. In the most central interval, they are less than 1%.
Highest uncertainty
Source pp Pb+Pb R AA
Track selection 6% 6% 9%
Fake and secondary tracks 1% 1% 1%
Track-to-particle association 2% 6% 5%
Unfolding procedure 12% 16% 25%
Momentum scale 12% 12% 9%
E ffi ciency 1% 8% 8%
Detector material 6% 6%
Luminosity 5% 5%
T AA 8% 8%
Table 2: Maximum values of systematic uncertainties for charged particle spectra and the nuclear modification factor R
AA.
7 Results
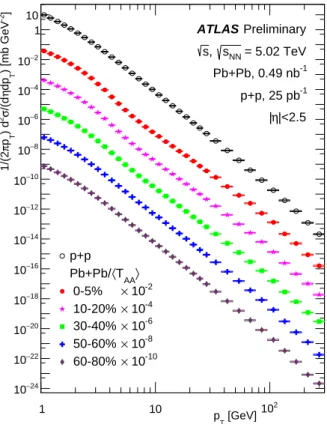
Charged hadron spectra measured in Pb + Pb collisions at √
s
NN= 5.02 TeV over the full |η| < 2.5 range are
shown in Fig. 1 with filled markers as a function of transverse momentum up to p T = 300 GeV. Results
shown for several intervals of collision centrality are divided by the corresponding hT AA i from Table 1 and also by constant scale factors applied for visual clarity. The pp differential cross section measured at the same energy √
s = 5.02 TeV is also plotted in the figure. The results of the pp analysis are taken from Ref. [19]. By comparing the pp results and the Pb + Pb results in the 0–5% centrality interval one can see a deficit in the number of particles in the Pb+Pb cross section at p T ∼ 7 GeV.
[GeV]
p
T1 10 10
2]
-2) [mb GeV
Tdp η /(d σ
2) d
Tp π 1/(2
−24
10
−22
10
−20
10
−18
10
−16
10
−14
10
−12
10
−10
10
−8
10
−6
10
−4
10
−2
10 1 10
Preliminary ATLAS
= 5.02 TeV s
NN, s
Pb+Pb, 0.49 nb
-1p+p, 25 pb
-1|<2.5 η
|
p+p
AA
〉
〈 T Pb+Pb/
0-5%
10-20%
30-40%
50-60%
60-80%
10
-2×
10
-4×
10
-6×
10
-8×
10
-10×
Figure 1: Charged hadron production cross sections as a function of p
Tmeasured in Pb + Pb collisions at √ s
NN= 5.02 TeV for five centrality intervals: 0–5%, 10–20%, 30–40%, 50–60% and 60–80%. Cross section measured in pp collisions is shown as well. The statistical uncertainties are smaller than the marker size, and the boxes represent systematic uncertainties. Curves are scaled down by constant factors for clarity of the plot.
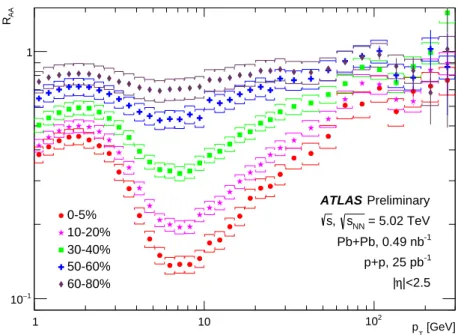
The deficit is present in all centrality intervals and is better seen in the R AA , constructed according to Eq. 1 and shown in Fig. 2. The figure shows the nuclear modification factor R AA as a function of p T in five centrality intervals: 0–5%, 10–20%, 30–40%, 50–60% and 60–80%. The R AA measured as a function of p T shows a characteristic non-flat p T shape which becomes more pronounced for more central collisions. It first increases with increasing p T reaching a maximum at p T ≈ 2 GeV, a feature commonly associated with the Cronin effect [23, 24], i.e. hardening of p T spectrum in heavy ion collisions relative to pp collisions, often understood to be due to multiple scattering of partons. At higher p T , the R AA values decrease reaching a minimum at p T ≈ 7 GeV, where the charged-particle suppression is strongest.
The rate of charged particles is noticeably suppressed even in the 60–80% centrality interval but the suppression is strongest in the most central 0–5% collisions. Above this p T , R AA generally increases with increasing p T up to ≈ 60 GeV after which the slope changes. This behavior is consistent with the analogous measurements made by the ATLAS experiment at √
s
NN= 2.76 [3].
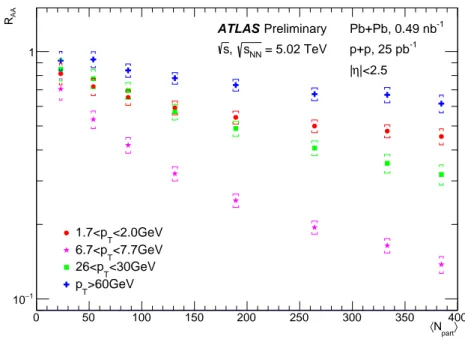
Figure 3 shows R AA as a function of the mean number of participating nucleons, N part , in four momentum
intervals: the local maximum of R AA 1.7 < p T < 2.0 GeV, the local minimum of R AA 6.7 < p T < 7.7 GeV;
[GeV]
p
T1 10 10
2AA
R
−1
10 1
Preliminary ATLAS
= 5.02 TeV s
NN, s
Pb+Pb, 0.49 nb
-1p+p, 25 pb
-1|<2.5 η
| 0-5%
10-20%
30-40%
50-60%
60-80%
Figure 2: Nuclear modification factor R
AAas a function of p
Tfor charged hadrons measured in Pb + Pb collisions at √
s
NN= 5.02 TeV for five centrality intervals: 0–5%, 10–20%, 30–40%, 50–60% and 60–80%. The statistical uncertainties are shown with the bars and the brackets represent systematic uncertainties.
the high-p T region p T > 60 GeV; and an intermediate region 26 < p T < 30 GeV. In all four momentum intervals R AA decreases with hN part i, however the decrease is strongest for the minimum interval and is weakest in the high-p T region.
8 Conclusions
The ATLAS experiment has measured charged hadron spectra and the nuclear modification factor, R AA , in Pb+Pb data at the highest LHC per nucleon–nucleon pair collisions energy of √
s
NN= 5.02 TeV. The values of R AA show the strongest suppression in the momentum region around p T = 7 GeV, and the suppression weakens at higher p T . The behavior is consistent with the earlier ATLAS measurement at
√ s
NN=2.76 TeV.
part
〉
〈 N
0 50 100 150 200 250 300 350 400
AA
R
−1