ATLAS-CONF-2013-020 08March2013
ATLAS NOTE
ATLAS-CONF-2013-020
March 6, 2013
Measurement of the total ZZ production cross section in proton-proton collisions at √
s = 8 TeV in 20 fb
−1with the ATLAS detector
ATLAS Collaboration
Abstract
TheZZproduction cross section has been measured by the ATLAS experiment using the four-lepton decay channel, where the term lepton implies electrons and muons. A data sam- ple of 20.3±0.6 fb−1collected in ppcollisions at √
s =8 TeV at the LHC in 2012 is used.
Events are selected by requiring four leptons, forming two opposite-sign same-flavour lepton pairs each with an invariant mass between 66 GeV and 116 GeV. We observe 305 candidate events with a background expectation of 20.4±2.9(stat)±5.0(syst.). TheZZ → `−`+`0−`0+ production cross section is measured to be 20.7+−1.21.3(stat.)±0.8(syst.)±0.6(lumi.) fb in a fiducial phase-space corresponding closely to the acceptance region. After correcting for theZZ→`−`+`0−`0+branching fraction and the fiducial acceptance, the totalZZproduction cross section is measured to be 7.1+−0.40.5(stat.)±0.3(syst.)±0.2(lumi.) pb, where the total cross section is defined by requiring bothZbosons to have an invariant mass between 66 GeV and 116 GeV. This result is consistent with the Standard Model expectation of 7.2+−0.20.3pb.
c
Copyright 2013 CERN for the benefit of the ATLAS Collaboration.
Reproduction of this article or parts of it is allowed as specified in the CC-BY-3.0 license.
1 Introduction
The production ofZ-boson pairs at the Large Hadron Collider (LHC) is of great interest since it provides an excellent opportunity to test the predictions of the electroweak sector of the Standard Model (SM) at the TeV energy scale. Deviations from SM expectations for the total or differentialZZproduction cross sections could be indicative of the production of new resonances decaying toZbosons or other non-SM contributions.
In the Standard Model,ZZ production proceeds via quark-antiquark t-channel annihilation, with a small contribution from gluon fusion, calculated using MCFM [1] to be 5.9% in ppcollisions at 8 TeV.
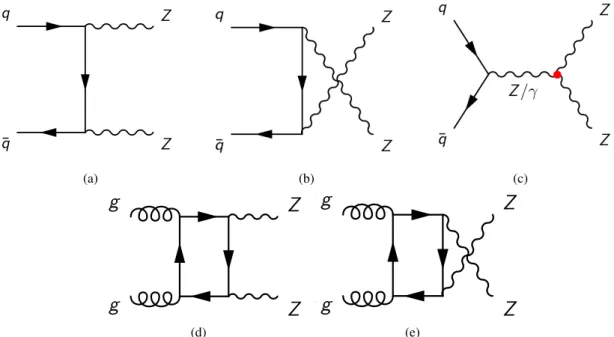
Figure 1 shows the corresponding Feynman diagrams for ZZ production. The ZZZ and ZZγ neutral triple gauge boson couplings (nTGCs) are zero in the Standard Model, hence there is no contribution froms-channelqq¯ annihilation at tree level. At the one-loop level, the contribution isO(10−4) [2]. Many models of physics beyond the Standard Model predict values of nTGCs at the level of 10−4to 10−3[3].
Those non-zero nTGCs can increase theZZcross section especially for highZZinvariant mass and high transverse momentum of theZbosons [4].
t -Channel Diagram
¯ q q
Z Z
(a) (b) (c)
Quark and Gluon Diboson Production Diagrams
¯ q q
Z Z
¯ q q
Z Z
Z/γ
¯ q q
Z Z
g Z
g Z
g Z
g Z
g Z
g Z
(d)
Quark and Gluon Diboson Production Diagrams
¯ q q
Z Z
¯ q q
Z Z
Z/γ
¯ q q
Z Z
g Z
g Z
g Z
g Z
g Z
g Z
(e)
Figure 1: Leading order Feynman diagrams for ZZ production through the qq¯ andgg initial state at hadron colliders. Thes-channel diagram, (c), contains theZZZandZZγneutral TGC vertices which do not exist in the SM.
Recently, the ATLAS [5] and CMS [6] collaborations have measured theZZproduction cross section in proton-proton collisions at √
s = 7 TeV. There are also results from ATLAS [7] and CMS [8] at a centre-of-mass energy of √
s = 8 TeV using part of the data collected during 2012. The results shown here supercede the previous ATLAS result at √
s= 8 TeV.ZZproduction has also been studied ine+e− collisions at LEP [9–13] and in proton-antiproton collisions at the Tevatron [14, 15]. No deviation of the measured cross section from the Standard Model expectation has been observed, allowing limits on non-zero (anomalous) nTGCs to be set. The production cross section at the LHC for a centre-of-mass energy of 8 TeV is predicted to be about 5.5 times larger than at the Tevatron, and about 1.2 times larger than in 7 TeV collisions at the LHC.
In this note we present the measurement of the cross section forZZproduction (throughout this note
Zshould be taken to meanZ/γ∗) in proton-proton collisions at a centre-of-mass energy of 8 TeV, using a data sample corresponding to an integrated luminosity of 20.3±0.6 fb−1collected by the ATLAS detector at the LHC during 2012. The cross section forZZproduction, requiring bothZ bosons to have masses between 66 GeV and 116 GeV, calculated at next-to-leading order (NLO) in QCD using MCFM with the CT10 [16] NLO parton distribution function (PDF) set and using the natural width of the Zboson, is found to be 7.2+0.3−0.2pb. The quoted theoretical uncertainties result from varying the factorization and renormalization scales (which are by default equal to half the mass of the diboson system) simultaneously by a factor of two whilst using the full CT10 PDF error set. The cross section calculated using the on- shell (zero-width) approximation is 5% higher.
CandidateZZ events are reconstructed in the ZZ → `−`+`0−`0+ decay channel, where`can be an electron or a muon. Although this channel constitutes only 0.45% of the totalZZcross section, its branch- ing fractions are known precisely and the experimental signature of four high transverse-momentum isolated leptons is very distinctive and benefits from extremely small backgrounds.
We first measure the cross section in a fiducial phase-space that closely matches the experimental acceptance, thus reducing the theory-dependent systematic uncertainties of the measurement; we refer to this as the ‘fiducial cross section’. A fiducial phase-space common to all three decay channels (e+e−e+e−, µ+µ−µ+µ−ande+e−µ+µ−) is defined by requiring four leptons to be within the pseudorapidity range1|η|<
2.7, to have transverse momentum (pT) greater than 7 GeV, and to have∆R≡ p
∆φ2+ ∆η2>0.2 for any two leptons. The invariant mass of both opposite-sign same-flavour lepton pairs is required to be between 66 and 116 GeV. The fiducial cross section is obtained from the reconstructed number of events (after background subtraction) using a reconstruction correction factor given by the number of simulated ZZ events which satisfy the full event selection divided by the number ofZZevents generated in the fiducial region (CZZ). The reconstruction acceptance factors are different for each of the three decay channels, reflecting not only the different efficiencies, but also the slightly different event selections amongst the three channels. In calculating the invariant masses of the lepton pairs at generator level, photons within
∆R = 0.1 of a lepton are included in the lepton four-momentum to minimize the dependence on the generator modelling of collinear radiation.
The totalZZcross section is calculated using theZZfiducial cross section, theZ →`+`−branching ratio [17], and a fiducial acceptance factor (AZZ) which is given by the fraction ofZZ events with Z bosons in the Z mass window that fall into the fiducial region. The fiducial acceptance factor AZZ is calculated from the NLO Standard Model prediction using MCFM. The total cross section is defined with bothZbosons having masses between 66 GeV and 116 GeV.
The main background arises fromZ+jets events, from other diboson (W+W−/W±Z) final states and from top-quark events (t¯tand single top) where the t → Wbdecay is followed by a leptonicW boson decay and a semi-leptonicb-quark decay. Additional backgrounds arise from the irreducible sourcest¯tZ andZZZ/ZWW, which can produce four leptons. The background fromZZ → `+`−τ+τ− andZZ → τ+τ−τ+τ−, where theτleptons decay to electrons or muons, is estimated from simulation to contribute 0.30%±0.02% of selectedZZevents after applying the full event selection described below. We correct for this contamination in the reconstruction acceptance factor defined above, which translates from the reconstructed event count to the number of trueZZ→`−`+`0−`0+decays within the fiducial phase-space.
The ATLAS detector has been described in detail elsewhere [18]. Since we only use electrons and muons in this measurement, the important components for this analysis are the inner tracking detector, the electromagnetic calorimeter and the muon spectrometer.
This note is organized as follows. Section 2 briefly describes the data sample used in this analysis and
1ATLAS uses a right-handed coordinate system with its origin at the nominal interaction point in the centre of the detector and thez-axis along the beam direction. Thex-axis points from the interaction point to the centre of the LHC ring, and the y-axis points upwards. Cylindrical coordinates (r,φ) are used in the transverse plane,φbeing the azimuthal angle around the beam direction. The pseudorapidityηis defined in terms of the polar angleθasη=−ln tan(θ/2).
the Monte Carlo simulation used to estimate the signal expectation and to cross-check the background estimation. The event selection and signal efficiency are discussed in Section 3, details on the signal acceptance are given in Section 4 and the background estimation is described in Section 5. The cross section results are presented in Section 6. Conclusions are given in Section 7.
2 Dataset and Monte Carlo Simulation
Events were selected using single-lepton triggers with thresholds on the transverse momentum of the triggering lepton of 24 GeV both for electrons and muons. Data flagged with quality problems that affect the lepton reconstruction are removed. After data quality cuts, the total integrated luminosity used in the analysis is 20.3±0.6 fb−1. The uncertainty on the integrated luminosity is±2.8%. It is derived, following the same methodology as that detailed in Ref. [19], from a preliminary calibration of the luminosity scale derived from beam-separation scans performed in November 2012.
The reconstruction correction factors are determined from a detailed Monte Carlo simulation. The NLO generator PowhegBox[20–23] with NLO PDF set CT10 is used to modelqq→ZZ →`+`−`0+`0−
events, where`includes electrons, muons andτleptons. The PowhegBoxcalculation does not include the next-to-next-to-leading order (NNLO) gluon-gluon diagrams. We simulate this contribution to the cross section using thegg2zz[24] generator, also using the CT10 PDF set. The simulations include the interference terms between theZandγ∗diagrams.
The contributions from background processes are estimated from the data and are validated with predictions from Monte Carlo simulations. MC@NLO [25] is used to model t¯tand single top-quark events, and MadGraph [26] is used for the t¯t+W±/Z, ZZZ andZWW final states. W± orZ bosons produced in association with jets, as well as the the diboson processesW+W− andW±Z, are simulated with PowhegBox. Events with heavy flavour dijets are modelled with PythiaB [27]. The underlying event, parton shower, hadronization andτlepton decays in the PowhegBoxand MadGraphsamples are modelled using Pythia8 [28]. The underlying event ingg2zzand MC@NLO samples is modelled using Jimmy [29], while the parton shower and hadronization are modelled using Herwig[30], and theτlepton decays are modelled using Tauola[31]. In all samples, the final-state radiation of photons is modelled using Photos[32].
The detector response is simulated [33] with a program based on GEANT4 [34]. The mean number ofppcollisions per bunch crossing (referred to as ‘pile-up’) is between 5 and 40 for the 2012 data con- sidered in this analysis. Additional inelastic ppevents are included in the simulation, and the generated events are re-weighted so as to reproduce the observed distribution of average number of collisions per bunch-crossing in the data. An additional contribution to the pile-up comes from the ongoing detector response to interactions in the preceding bunch crossings; this is also modelled in the simulation.
3 Event Selection
Signal events are characterized by four high-pT, isolated electrons or muons. To ensure that they originate from the primary vertex, lepton candidates are required to have the absolute value of the product of the longitudinal impact parameter (distance of closest approach) with respect to the primary vertex times the sine of the polar angleθto be less than 0.5 mm. The primary vertex is defined as the vertex whose constituent tracks have the largest sum of p2T. To reject heavy flavour background, muons must have an impact parameter significance (the transverse impact parameter,d0, divided by its error) less than 3 while the electrons must have an impact parameter significance less than 6.
Muons are identified by tracks (or track segments) reconstructed in the muon spectrometer matched to tracks reconstructed in the inner detector, and are required to have pT > 7 GeV and |η| < 2.5.
Their momentum is calculated by statistically combining the information from the two subsystems and correcting for parameterized energy loss in the calorimeter. In order to reject muons from the decay of heavy quarks, it is required that isolated muons be selected by restricting the scalar sum of the transverse momenta (P
pT) of other tracks inside a cone of∆R=0.2 around the muon to be no more than 15% of the muon pT.
In the region |η| < 0.1 (where there is a limited geometric coverage in the muon spectrometer) calorimeter-tagged muons are considered in addition. They are reconstructed from calorimeter energy deposits consistent with a muon which are matched to an inner detector track withpT >20 GeV and are required to satisfy the same impact parameter and isolation criteria as for the combined muons. Muons with 2.5 < |η| < 2.7 (in a region outside the nominal coverage of the inner detector) are taken into account as well. They are required to have a full track that is reconstructed in the muon spectrometer. If these forward spectrometer muons are also measured in the inner detector, their momentum is measured using the combined information; otherwise, only the muon spectrometer information is used. In either case, such muons are required to have pT > 10 GeV. Instead of the above-mentionedP
pT isolation criteria, theP
ET of calorimeter energy deposits inside a cone of size∆R= 0.2 around these muons is required to be no more than 15% of theirpT. The same impact parameter requirements as for the muons with|η| < 2.5 are imposed for the forward muons measured in the inner detector; no such requirement is imposed on those measured in the muon spectrometer only. The number of calorimeter-tagged muons and muons with 2.5 < |η| < 2.7 per event is limited to a maximum of one per type and it is also required that they be paired with muons which are neither calorimeter-tagged nor in the forward region, 2.5<|η|<2.7. The inclusion of these two types of muons increases the expected event yield by 10%.
Electrons are reconstructed from energy deposits in the electromagnetic calorimeter matched to a track in the inner detector. For the 2012 LHC data taking, the electron reconstruction algorithm has been improved with respect to 2011. The ATLAS track pattern recognition and global χ2 fit were modified to account for energy losses. Candidate electrons were fitted using a Gaussian-sum filter [35, 36] to account for bremsstrahlung energy losses. The track-to-cluster matching algorithm was then modified to benefit from these improvements. Electron candidates are required to have pT > 7 GeV and|η|< 2.47.
They must be isolated, using the same criteria as for muons within|η|=2.5, but calculatingP
pTaround the electron track. Electron candidates within ∆R = 0.1 of any selected muon are rejected, and if two electron candidates overlap within ∆R = 0.1 the electron with the lower pT is rejected. The electron identification algorithm was chosen to maximimize efficiency at the cost of electron-like jet rejection and is relaxed compared to the identification algorithm used in the ATLAS H → ZZ∗ → `+`−`0+`0−
analysis [37].
Events are required to have exactly four leptons selected as above, and to have passed a single-muon or single-electron trigger. To ensure that selected events have well measured trigger efficiency, at least one of these leptons must have pT > 25 GeV and match to a muon or electron reconstructed by the trigger algorithm with∆R<0.1 for a muon or∆R<0.15 for an electron. The matched lepton must be within the triggerableηvolume (|η|<2.5 for electrons and|η|<2.4 for muons) and pass more stringent identification requirements than those in the trigger. The efficiency for triggering an event passing all of the other selection requirements is 99.0±0.1%, estimated using signal Monte Carlo simulation corrected by scale factors measured in data using a large number of dilepton events.
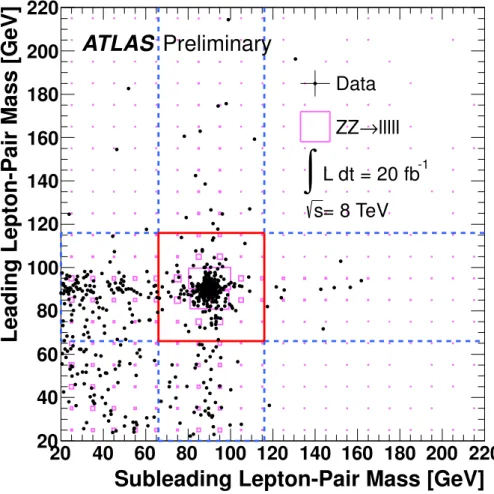
Same-flavour, oppositely-charged lepton pairs are combined to formZ candidates. An event must contain two such pairs. In thee+e−e+e−andµ+µ−µ+µ−final states there is an ambiguity in pairing the leptons intoZbosons. It is resolved by choosing the pairing which results in the smaller value of the sum of the two|m`+`−−mZ|values, wherem`+`−is the invariant mass of a lepton pair andmZ is the mass of theZboson [17]. However, if any same-flavour, oppositely-charged lepton pairing results in an invariant mass below 5 GeV, the event is rejected to reduce backgrounds including J/ψmesons. Figure 2 shows a scatter plot of the invariant mass of the leading (higher pT) lepton pair against that of the subleading
Subleading Lepton-Pair Mass [GeV]
20 40 60 80 100 120 140 160 180 200 220
Leading Lepton-Pair Mass [GeV]
20 40 60 80 100 120 140 160 180 200 220
Data lllll ZZ→
L dt = 20 fb-1
∫
= 8 TeV s
Preliminary ATLAS
Figure 2: Invariant mass of the leadingZcandidate versus the invariant mass of the subleadingZcandidate. The events observed in the data are shown as solid circles and the signal prediction from simulation as pink boxes.
The red box indicates the region defined by theZZfiducial cuts on theZcandidate masses. The blue dashed lines indicate the regions where one of the leptons pairs is in the mass window 66<mll<116 GeV. Contributions from events with one or bothZbosons outside of this mass window are also seen.
(lower pT) lepton pair. Events are required to contain twoZcandidates with invariant masses satisfying 66<m`+`−<116 GeV, resulting in 305 observed events.
4 Signal Acceptance
TheZZselection requirements described above are applied to Monte Carlo simulation (PowhegBoxand gg2zz), and corrections are applied to account for differences in lepton reconstruction and identification efficiency, lepton energy scale and resolution, and trigger efficiencies between data and simulation. The corrections are measured in data using samples of single Z → `+`−events, supplemented by samples ofJ/ψ→e+e−events for electron efficiency measurements at low pT. The overall efficiency correction factor is 0.92±0.06 for thee+e−e+e− channel, 0.97±0.03 for theµ+µ−µ+µ−channel and 0.94±0.03 for thee+e−µ+µ−channel, where the errors are systematic. A smearing and scale correction is added to the muon pTin the simulation [38] so that theZ →µ+µ−invariant mass distribution in data is reproduced.
Similarly, corrections are applied to the electron calorimeter energy resolution in the simulation and to the electron calorimeter energy scale in the data [39]. A correction parameterized by the number of
primary vertices in the event is applied to the calorimetric isolation of muons above|η|=2.5 to account for the effects of pile-up.
The reconstruction acceptance factors,CZZ, used to correct from the observed events to the number of events in theZZfiducial phase-space, taking into account the experimental selection efficiencies and small contamination fromZZ decays involvingτleptons, are 0.55±0.04,0.83±0.03 and 0.66±0.03 for thee+e−e+e−,µ+µ−µ+µ−ande+e−µ+µ−channel, respectively, where the errors are the combined statis- tical and systematic uncertainties. The lower signal efficiency in thee+e−e+e−channel compared with the µ+µ−µ+µ− channel reflects the lower electron identification efficiency. In all channels, the recon- struction acceptance has increased significantly with respect to a similar analysis on 7 TeV data collected in 2011, owing to improvements in the reconstruction algorithms. The dominant systematic uncertain- ties arise from the lepton identification and reconstruction efficiency and the efficiency of the isolation and impact parameter requirements. Uncertainties on the trigger efficiency, the lepton energy scale and resolution, and theoretical uncertainties from the PDFs and the choice of the renormalization and factor- ization scales, are small. The uncertainties are estimated by varying the data-driven correction factors applied to simulation by their systematic and statistical uncertainties. The theoretical uncertainties from the PDF, the factorization and renormalization scales and the MC generator are evaluated by taking the difference inCZZ obtained when using the CT10 and MSTW2008 PDF sets [40], when varying the fac- torization and renormalization scale by a factor of two, and when using Sherpa[41] as the MC generator, respectively.
The fiducial acceptance factor AZZ, used to correct from the number of observed events in theZZ fiducial phase-space to the number of events in the total phase space, is calculated at NLO using MCFM version 6.3 with the CT10 PDF set and is determined to be 0.64±0.01. The error is due to the theoreti- cal and statistical uncertainties. The theoretical uncertainties include the PDF uncertainty, evaluated by taking the difference between theAZZ obtained using the CT10 and MSTW2008 PDF sets and by deter- mining the variation using the 52 CT10 error sets, and uncertainties in the factorization and renormaliza- tion scales, evaluated by moving each scale up and down by a factor of two. An additional uncertainty due to ISR, FSR and underlying event modelling is evaluated by comparing the acceptance in MCFM (where the effects of ISR, FSR and underlying event are not modelled) and PowhegBox(where they are).
The total systematic uncertainty of the fiducial-to-total phase-space acceptance correction is found to be 1.3%. A summary of the systematic uncertainties onCZZandAZZis shown in Table 1.
5 Background Estimation
The main background to theZZsignal originates from events with aZ(orW±) boson decaying to leptons plus additional jets or photons (referred to as W±/Z+ X). Events with a top-quark pair, a single-top and other diboson processes (W+W−, W±Z) also contribute. Jets may be misidentified as electrons or contain electrons and muons from in-flight decays of light mesons or heavy-flavoured hadrons which satisfy the electron or muon object selection. Photons may be misidentified as electrons. Leptons from heavy-flavour decays tend to be rejected by the impact parameter significance requirement. Leptons from misidentified jets or decays of light mesons tend to be spatially correlated with jets and many are rejected by the isolation requirement. Photons tend to be rejected due to hit requirements in the inner detector used in the electron identification. Since Monte Carlo simulations may not adequately describe the jet fragmentation in the tails of the isolation distributions, the background is estimated directly from the data.
To estimate the background contribution from four-lepton events in which at least one lepton candi- date originates from a jet or a photon rather than from the decay of aZboson, a control sample of events containing three leptons passing all selection criteria plus one lepton-like jet and two leptons passing all selection criteria plus twolepton-like jetsare identified and denoted```jand``j jrespectively. For
Source e+e−e+e− µ+µ−µ+µ− e+e−µ+µ− `+`−`0+`0−
Reconstruction Uncertainties
Lepton identification and reconstruction 6.2% 1.2% 3.1% 2.8%
Lepton energy/momentum 0.4% <0.1% 0.2% 0.1%
Lepton isolation and impact parameter 1.8% 2.6% 1.5% 1.6%
Trigger efficiency <0.1% 0.2% 0.1% 0.1%
Total Reconstruction Uncertainty (CZZ) 6.4% 2.8% 3.4% 3.3%
Theoretical Uncertainties
PDF & Scale (CZZ) 0.1% 0.1% <0.1% <0.1%
MC Generator Difference (CZZ) 1.7% 0.9% 1.8% 1.5%
PDF & Scale (AZZ) 1.0%
MC Generator Difference (AZZ) 0.8%
Total forCZZ 6.6% 3.0% 3.9% 3.6%
Total forAZZ 1.3%
Luminosity 2.8%
Table 1: Summary of systematic uncertainties, as relative percentages of the correction factorCZZor the acceptance of the fiducial regionAZZ. Sums in quadrature of the weighted average of the three channels and a combined lllluncertainty are shown for the reconstruction uncertainties. The assignment of the various uncertainties to the two correction factors (CZZ) and (AZZ) are shown in parenthesis next to the description of the uncertainty source.
Selected leptons Lepton-like jets
Muons track isolation<15% (d0-significance>3.0 and track isolation<15%) d0-significance<3.0 or (d0-significance<3.0 and track isolation>15%) Electrons track isolation<15% (fails identification algorithm and track isolation<15%)
andpasses identification algorithm or (passes identification algorithmand track isolation>15%)
Table 2: Summary of requirements for selected leptons and lepton-like jets. The full selection for elec- trons and muons is applied to the selected leptons and lepton-like jets with the exception of those listed in the table.
muons, the lepton-like jets are muon candidates that either fail the track isolation requirement but pass thed0significance requirement or fail thed0significance requirement but pass the track isolation require- ment. For muons with|η|>2.5, calorimetric isolation is used instead of track isolation. For electrons, the lepton-like jets are energy deposits in the electromagnetic calorimeter matched to inner detector tracks that either fail the electron identification requirement [39] but pass the track isolation requirement, or fail the track isolation requirement but pass the electron identification requirement. The events are otherwise required to pass the full event selection, treating the lepton-like jet as if it were an identified lepton. The definitions of lepton-like jets are summarized in Table 2.
Since the selected leptons are spatially separated in∆Rbecause of the isolation requirements, we require that the lepton-like jets do not overlap with another lepton-like jet or selected lepton within a cone of∆R=0.2. This ensures that the control sample has similar kinematic characteristics to the signal sample. This event sample is dominated byZ+Xevents for thee+e−e+e−channel andZ+Xandt¯tevents for thee+e−µ+µ−andµ+µ−µ+µ−channels.
The background is then estimated by scaling the control sample by a measured ‘fake factor’ f (ηandpTdependent, treated as uncorrelated in the two variables) which is the ratio of the probabil- ity for ‘background’ leptons to satisfy the lepton criteria to the probability to satisfy the lepton-like jet criteria, where ‘background’ leptons are leptons from jets or photons as described above. The back- ground in which two of the selected leptons originate from a jet or photon is treated similarly, using the
``j jsample. A correction is necessary to account for the number ofZZ signal events which decay to four leptons where three leptons pass the selected lepton requirements and one passes the lepton-like jet requirements (NZZ```j), or two leptons pass the selected lepton requirements and two pass the lepton-like jet requirements (NZZ``j j). This is estimated using signal Monte Carlo expectation. The background from events with misidentified (fake) leptons is calculated as:
N4`fake= N(```j)× f−N(``j j)× f2−NZZCorrection (1) where NZZCorrection = NZZ```j × f − NZZ``j j × f2. The factor f is measured in a sample of data selected by requiring a reconstructed opposite-sign same-flavour lepton pair which has an invariant mass within 20 GeV of the Zmass and classifying any additional identified leptons in the event as selected leptons or lepton-like jets. It is assumed that all of these additional leptons are ‘fakes’, either from light jets misidentified as real leptons, bremsstrahlung photons converting to electrons, or from real leptons from decays in heavy flavour jets. Contributions to f fromW±Z andZZprocesses, which contain additional real leptons, are subtracted from the data using simulation, normalized using the SM cross sections.
The systematic uncertainty is determined by comparing the nominal data-driven background estimation using the parameterized fake factor (inηand pT) and the estimation using the average fake factor (total
`divided by total j) for each type of lepton. The difference is the systematic quoted in Table 3.
Ingredients in Eq.1 e+e−e+e− µ+µ−µ+µ− e+e−µ+µ− `+`−`0+`0−
N(```j) 164 7 117 288
(+)N(```j)× f 21.7±1.7 3.3±1.3 20.1±2.0 45.1±2.8
N(``j j) 646 9 453 1108
(−)N(``j j)× f2 11.0±0.4 1.0±0.4 8.4±0.4 20.5±0.6
(−)NCorrectionZZ 1.1±0.1 1.7±0.4 3.1±0.4 5.9±0.5
Background,Nfake4` 9.6±1.8±1.4 0.6±1.4±0.5 8.5±2.1±3.1 18.7±2.9±5.0
MC, irreducible 0.4±0.1 0.5±0.1 0.7±0.1 1.6±0.1
Total background 10.0±1.8±1.4 1.1±1.4±0.5 9.3±2.1±3.1 20.4±2.9±5.0
Table 3: Components of theZZbackground estimate. The first row gives the number of observed events with three selected leptons and one lepton-like jet. The second row gives this number multiplied by the factor f. Similarly the third row gives the number of observed events with two selected leptons and two lepton-like jets, and the fourth gives this number multiplied by the factor f2. The fifth row gives the correction due toZZ events. Only statistical errors are given for these quantities. Lines two, four and five are combined using Equation 1 to give the background estimate from fake sources, which is shown in the sixth row. The irreducible backgrounds estimated from Monte Carlo are shown in the seventh row while the total background estimate is shown in the last row. The first uncertainty is statistical while the second is systematic.
Sources of irreducible background such ast¯tZ, ZZZ and ZWW must also be taken into consider- ation when calculating the background estimation. The contribution from these sources is estimated from Monte Carlo and added to the data-driven estimation to give the total background expectation.
Table 3 shows the observed values for the components of Equation 1, as well as the final background estimate. The statistical uncertainty on the background estimate is the combination of N(```j),N(``j j) and theNZZCorrection, while the systematic uncertainty comes from the data-driven background systematic described above.
6 Cross Section Measurement
The numbers of expected and observed events after applying all selection criteria are shown in Table 4, along with the reconstruction acceptance factors used to correct back to the number of events in the fiducial phase-space, taking into account the contribution from events where at least one of the Z bosons decays to τleptons. We observe 305 candidates passing theZZ selection in data, with a background expectation of 20.4±2.9(stat)±5.0(syst.).
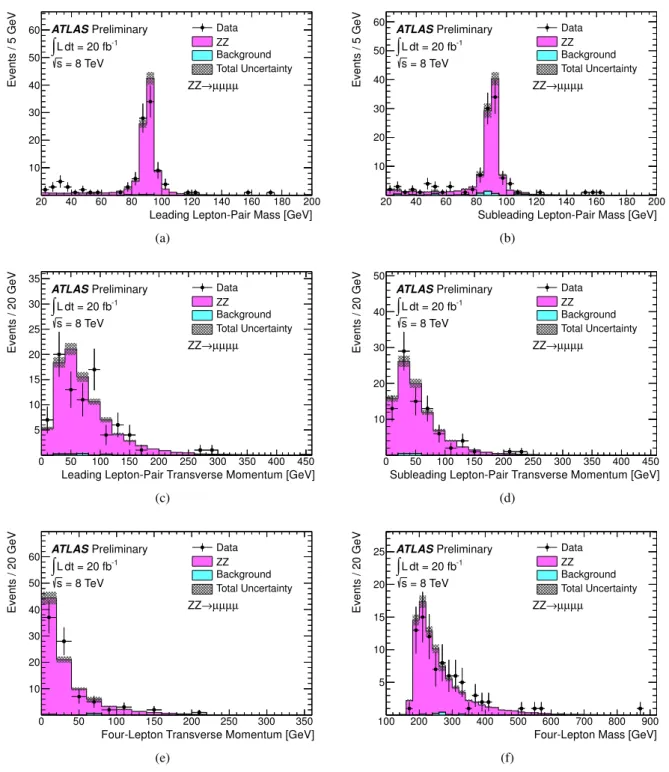
Figure 3 shows the invariant mass distributions for the leading and subleading lepton pairs after all selection requirements are applied, the transverse momentum distributions of the lepton pairs and the four-lepton system, and the invariant mass of the four-lepton system. The distributions for each decay channel can be found in Appendix A, Figures 5, 6 and 7. No significant discrepancy is observed between the data and the expectations.
TheZZcross sections are determined using a likelihood fit with the systematic uncertainties included as nuisance parameters. The final result for the fiducial cross section corresponding to the phase-space
Leading Lepton-Pair Mass [GeV]
20 40 60 80 100 120 140 160 180 200
Events / 5 GeV
20 40 60 80 100 120 140 160 180
200 Data
ZZ Background Total Uncertainty Preliminary
ATLAS = 20 fb-1
dt
∫L = 8 TeV s
→llll ZZ
(a)
Subleading Lepton-Pair Mass [GeV]
20 40 60 80 100 120 140 160 180 200
Events / 5 GeV
20 40 60 80 100 120 140 160
180 Data
ZZ Background Total Uncertainty Preliminary
ATLAS = 20 fb-1
dt
∫L = 8 TeV s
→llll ZZ
(b)
Leading Lepton-Pair Transverse Momentum [GeV]
0 50 100 150 200 250 300 350 400 450
Events / 20 GeV
20 40 60 80
100 Data
ZZ Background Total Uncertainty Preliminary
ATLAS = 20 fb-1
dt
∫L = 8 TeV s
→llll ZZ
(c)
Subleading Lepton-Pair Transverse Momentum [GeV]
0 50 100 150 200 250 300 350 400 450
Events / 20 GeV
20 40 60 80 100 120
140 Data
ZZ Background Total Uncertainty Preliminary
ATLAS = 20 fb-1
dt
∫L = 8 TeV s
→llll ZZ
(d)
Four-Lepton Transverse Momentum [GeV]
0 50 100 150 200 250 300 350
Events / 20 GeV
20 40 60 80 100 120 140 160 180 200 220 240
Data ZZ Background Total Uncertainty Preliminary
ATLAS = 20 fb-1
dt
∫L = 8 TeV s
→llll ZZ
(e)
Four-Lepton Mass [GeV]
100 200 300 400 500 600 700 800 900
Events / 20 GeV
10 20 30 40 50 60 70 80
90 Data
ZZ Background Total Uncertainty Preliminary
ATLAS = 20 fb-1
dt
∫L = 8 TeV s
→llll ZZ
(f)
Figure 3: Kinematic distributions forZZcandidates in all four-lepton channels. The dilepton mass dis- tribution is shown in (a) for the leading pair and (b) for the subleading pair. The full event selection criteria are applied except for the dilepton mass requirement on the distribution being plotted. For the plots shown in (c), (d), (e) and (f), the full event selection is applied. The dilepton transverse momentum is shown in (c) for the leading pair and (d) for the subleading pair. Finally the four-lepton transverse mo- mentum and invariant mass distributions are shown in (e) and (f), respectively. In all figures, the points are data and the stacked histograms show the signal and background predictions from simulation. The signal is normalized to the integrated luminosity of the data. The background distributions are normal- ized to the total background estimate. The grey band indicates the combined statistical and systematic uncertainty on the signal and background predictions.
Final state e+e−e+e− µ+µ−µ+µ− e+e−µ+µ− `+`−`0+`0−
Observed 62 85 158 305
Signal (MC) 59.5±4.0 90.2±2.7 142.7±5.6 292.5±10.6 Background 10.0±1.8±1.4 1.1±1.4±0.5 9.3±2.1±3.1 20.4±2.9±5.0
CZZ 0.55±0.04 0.83±0.03 0.66±0.03 0.68±0.02
Table 4: Summary of observed events, expected signal and background contributions, and reconstruction acceptance factor in all four-lepton channels, after applying theZZselection. The signal expectation is derived from Monte Carlo and is shown with the combined statistical and systematic uncertainty. The luminosity uncertainty on the signal expectation is 2.8%. The background predictions are obtained as discussed in Sec. 5. The first error is statistical while the second is systematic. The reconstruction acceptance factor, CZZ, is estimated from Monte Carlo as discussed in Sec. 4 and is shown with its combined statistical and systematic uncertainty.
defined in Section 1 is:
σfidZZ→`−`+`0−`0+ = 20.7+−1.21.3(stat.)±0.8(syst.)±0.6(lumi.) fb
where`+`−`0+`0− refers to the sum of thee+e−e+e−,µ+µ−µ+µ− ande+e−µ+µ−final states. This result is consistent with the Standard Model prediction of 21.1+−0.70.9fb, calculated at NLO using MCFM, where the error reflects the uncertainty on the PDFs and on the scales, as described below. The fiducial cross sections in each decay channel are shown in Table 5.
Channel Measuredσf id[fb] Theoreticalσf id [fb]
ZZ→e+e−e+e− 4.6+−0.70.8(stat.)+−0.40.4(syst.)+−0.10.1(lumi.) 5.3+−0.20.2 ZZ→µ+µ−µ+µ− 5.0+0.6−0.5(stat.)+0.2−0.2(syst.)+0.2−0.2(lumi.) 5.3+0.2−0.2 ZZ→e+e−µ+µ− 11.1+−0.91.0(stat.)+−0.50.5(syst.)+−0.30.3(lumi.) 10.5+−0.40.4
Table 5: Fiducial cross sections per channel. The measured value is compared to the theoretical predic- tion from MCFM.
The total cross section is determined by extrapolating theZZfiducial cross section to the full phase- space, correcting for theZ→`+`−branching ratio and the acceptance of the fiducial cuts. The measured value of the totalZZcross section is:
σtotZZ = 7.1+−0.40.5(stat.)±0.3(syst.)±0.2(lumi.) pb.
This result is consistent with the Standard Model prediction of 7.2+−0.20.3pb, calculated at NLO using MCFM and the CT10 PDF set.
Figure 4 shows measurements of the totalZZ production cross section as a function of centre-of- mass energy, showing results from the ATLAS [5] and CMS [6, 8] experiments at the LHC, and from the CDF [14] and D0 [15] experiments at the Tevatron, as well as the theoretical predictions.
[TeV]
s
0 2 4 6 8 10 12 14
[pb]
ZZtotalσ
1 10
<116 GeV) ) (66<mll
p ZZ (p
<116 GeV) ZZ (pp) (66<mll
=8 TeV) s LHC Data 2012 (
=7 TeV) s LHC Data 2011 (
=1.96 TeV) s
Tevatron (
<116 GeV) L=20 fb-1
llll (66<mll
→ ATLAS ZZ
<120 GeV) L=5.3 fb-1
llll (60<mll
→ CMS ZZ
<116 GeV) L=4.6 fb-1
) (66<mll
ν ν ll(ll/
→ ATLAS ZZ
<120 GeV) L=5.0 fb-1
llll (60<mll
→ CMS ZZ
<120 GeV) L=8.6 fb-1
) (60<mll
ν ν ll(ll/
→ D0 ZZ
) (on-shell) L=6.0 fb-1
ν ν ll(ll/
→ CDF ZZ
Preliminary
ATLAS NLO QCD (MCFM, CT10.0)
Figure 4: Comparison of experimental measurements and theoretical predictions of the totalZZproduc- tion cross section as a function of centre-of-mass energy √
s. Shown are experimental measurements from CDF [14] and D0 [15] in pp¯ collisions at the Tevatron at √
s = 1.96 TeV, and experimental mea- surements from ATLAS [5] and CMS [6, 8] inppcollisions at the LHC at √
s=7 TeV and √
s=8 TeV.
The blue dashed line shows the theoretical prediction for theZZproduction cross section inpp¯collisions, calculated at NLO in QCD using MCFM with PDF set CT10. The solid red line shows the theoretical prediction for theZZ production cross section in ppcollisions, calculated in the same way. The theo- retical curves are calculated using the natural width of theZ boson in the mass range 66 to 116 GeV.
At √
s = 8 TeV, the theoretical prediction using the zero-width approximation is 5% higher than the prediction using the natural width, restricted to the mass range 66 to 116 GeV.