A TLAS-CONF-2015-070 15 December 2015
ATLAS NOTE
ATLAS-CONF-2015-070
14th December 2015
Search for new phenomena in the dilepton final state using proton-proton collisions at √
s = 13 TeV with the ATLAS detector
The ATLAS Collaboration
Abstract
A search is conducted for both resonant and non-resonant new phenomena in dielectron and dimuon final states. The LHC 2015 proton–proton collision dataset recorded by the ATLAS detector is used, corresponding to 3.2 fb
−1at √
s = 13 TeV. The dilepton invariant mass spectrum is the discriminating variable in both searches. No significant deviations from the Standard Model expectation are observed. Lower limits are set on the signal parameters of interest at 95% credibility level, using a Bayesian interpretation. Limits on the Z
SSM0are set in the combined dilepton channel for masses lower than 3.40 TeV, as well as for the Z
0E
6models, such as Z
0χand Z
ψ0below 3.08 TeV and 2.79 TeV, respectively. Limits on the ``qq contact interaction scale Λ are set between 16.4 TeV and 23.1 TeV.
c
2015 CERN for the benefit of the ATLAS Collaboration.
Reproduction of this article or parts of it is allowed as specified in the CC-BY-3.0 license.
1 Introduction
The dilepton (ee or µµ) final state signature is a key search channel for a host of different new phenomena expected in theories that go beyond the Standard Model (SM). This search channel benefits from high signal selection efficiencies and relatively small, well understood backgrounds.
Models with extended gauge groups often feature additional U (1) symmetries with corresponding heavy spin-1 Z
0bosons whose decay would manifest itself as a narrow resonance in the dilepton mass spectrum.
Grand Unified Theories (GUT) have inspired models based on the E
6gauge group [1, 2], which, for a particular choice of symmetry breaking pattern, includes two neutral gauge bosons that mix with an angle θ
E6. This yields a physical state defined by Z
0(θ
E6) = Z
ψ0cos θ
E6+ Z
0χsin θ
E6, where the gauge fields Z
ψ0and Z
χ0are associated with two separate U (1) groups resulting from the breaking of the E
6symmetry. All Z
0signals in this model are defined by specific values of θ
E6ranging from 0 to π, and the six commonly motivated cases are investigated in this search, namely: Z
ψ0, Z
η0, Z
N0, Z
I0, Z
S0, and Z
0χ. In addition to the GUT-inspired E
6models, the Sequential Standard Model (SSM) [2] provides a common benchmark model that includes a Z
SSM0boson with couplings to fermions identical to those in the SM. A series of models that are motivated by the large hierarchy between the electroweak and Planck scales also predict the presence of narrow dilepton resonances. These include the Randall–Sundrum model [3] with a warped extra dimension giving rise to spin-2 graviton excitations, the quantum black hole model [4], the Z
∗model [5], and the minimal walking technicolor model [6].
Some models of physics beyond the SM result in non-resonant deviations in the dilepton mass spectrum.
Compositeness models motivated by the repeated pattern of quark and lepton generations predict new interactions involving their constituents. These interactions may be represented as a contact interaction (CI) between initial-state quarks and final-state leptons. Other models producing non-resonant effects are models with large extra dimensions [7] motivated by the hierarchy problem. The following four-fermion CI Lagrangian [8, 9] is used to describe a new interaction or compositeness in the process qq → `
+`
−:
L = g
2Λ
2[η
LL(q
Lγ
µq
L) (`
Lγ
µ`
L) + η
RR(q
Rγ
µq
R) (`
Rγ
µ`
R) (1) + η
LR(q
Lγ
µq
L) (`
Rγ
µ`
R) + η
RL(q
Rγ
µq
R) (`
Lγ
µ`
L)] ,
where g is a coupling constant set to be √
4π by convention, Λ is the CI scale, and q
L,Rand `
L,Rare left- handed and right-handed quark and lepton fields, respectively. The parameters η
i j, where i and j are L or R (left or right), define the chiral structure of the new interaction. Di ff erent chiral structures are invest- igated here, with the left-right (right-left) model obtained by setting η
LR= ±1 (η
RL= ±1) and all other parameters to 0. Likewise, the left-left and right-right models are obtained by setting the corresponding parameters to ±1, and the others to zero. The sign of η
i jdetermines whether the interference between the SM Drell–Yan (DY) qq → Z/γ
∗→ `
+`
−process and the CI process is constructive (η
i j= −1) or destructive (η
i j= + 1).
The most sensitive previous Z
0searches were carried out by the ATLAS and CMS Collaborations [10, 11]. Using 20 fb
−1of pp collision data at √
s = 8 TeV, ATLAS set a lower limit at 95% credibility level
(C.L.) on the Z
SSM0pole mass of 2.90 TeV for the combined ee and µµ channels. Similar limits were
set by CMS. The most stringent constraints on CI searches are also provided by the CMS and ATLAS
Collaborations [11, 12]. The strongest lower limits on the ``qq CI scale are Λ > 21.6 TeV and Λ >
17.2 TeV at 95% C.L. for constructive and destructive interference, respectively, in the case of left-left interactions and given a uniform positive prior in 1/ Λ
2.
In this note, a search for both resonant and non-resonant new phenomena is presented using the observed ee and µµ mass spectra extracted from pp collisions at the Large Hadron Collider (LHC) operating at
√ s = 13 TeV, corresponding to an integrated luminosity of 3.2 fb
−1. The analysis and interpretation of these spectra rely primarily on simulated samples of signal and background processes. The Z mass peak region is used to normalize the background contribution and perform cross checks of the simulated samples. The interpretation is then performed taking into account the expected shape of different signals in the dilepton mass distribution.
2 ATLAS detector
The ATLAS experiment [13, 14] at the LHC is a multi-purpose particle detector with a forward-backward symmetric cylindrical geometry and a near 4π coverage in solid angle.1 It consists of an inner tracking detector surrounded by a thin superconducting solenoid providing a 2 T axial magnetic field, electromag- netic and hadronic calorimeters, and a muon spectrometer. The inner tracking detector (ID) covers the pseudorapidity range |η | < 2.5. It consists of silicon pixel, silicon micro-strip, and transition radiation tracking (TRT) detectors. Lead / liquid-argon (LAr) sampling calorimeters provide electromagnetic (EM) energy measurements with high granularity. A hadronic (steel / scintillator-tile) calorimeter covers the central pseudorapidity range (|η| < 1.7). The end-cap and forward regions are instrumented with LAr calorimeters for both EM and hadronic energy measurements up to |η | = 4.9. The muon spectrometer (MS) surrounds the calorimeters and is based on three large superconducting air-core toroids with eight coils each. Its bending power is in the range from 2.0 to 7.5 T m. It includes a system of precision track- ing chambers and fast detectors for triggering. A dedicated trigger system is used to select events. The first-level trigger is implemented in hardware and uses the calorimeter and muon detectors to reduce the accepted rate to 100 kHz. This is followed by a software-based trigger that reduces the accepted event rate to 1 kHz on average.
3 Data and Monte Carlo samples
The data sample used in this analysis was collected during the 2015 LHC run with pp collisions at √ s = 13 TeV. After selecting periods with stable beams and requiring that relevant detector systems be functional, the total integrated luminosity retained for analysis amounts to 3.2 fb
−1.
Modelling of the various background sources primarily relies on Monte Carlo (MC) simulation. The dominant background contribution arises from the Drell-Yan (DY) process. Other background sources originate from top-quark and diboson (W W , W Z, Z Z) production. In the case of the dielectron channel, multi-jet and W + jets processes also contribute due to the misidentification of jets as electrons. A data- driven method is used to estimate this background, see Section 5.
1
ATLAS uses a right-handed coordinate system with its origin at the nominal interaction point (IP) in the centre of the detector and the
z-axis along the beam pipe. The x-axis points from the IP to the centre of the LHC ring, and the y-axis pointsupwards. Cylindrical coordinates (r, φ) are used in the transverse plane,
φbeing the azimuthal angle around the
z-axis.The pseudorapidity is defined in terms of the polar angle
θas
η =−ln tan(θ/2). Angular distance is measured in units of
∆R≡p
(∆η)
2+(∆φ)
2.
Drell-Yan events are generated with P owheg - box v2 [15] at next-to-leading order (NLO) in QCD using the CT10 parton distribution function (PDF) set [16] and Pythia 8.186 for parton showering and hadron- ization [17]. The AZNLO tune [18] is used with the CTEQ6L1 PDF set [19] to model non-perturbative e ff ects and QED emissions are produced with P hotos++ 3.52 [20]. A mass-dependent K-factor is applied on an event-by-event basis to account for next-to-next-to-leading (NNLO) QCD corrections computed with VRAP [21] and the CT14NNLO PDF set [22]. Mass-dependent Electroweak (EW) corrections are computed at next-to-leading (NLO) order with mcsanc [23] using CT14 PDF set. Those include photon- induced contributions (γγ → `` via t- and u-channel processes) computed with the MRST2004QED PDF set [24].
Diboson events are generated using Sherpa 2.1.1 [25] at NLO with the CT10 PDF set. Top-quark back- grounds include t t ¯ production and single-top production with an associated W boson generated with P owheg - box v1 and v2, respectively, using the CT10 PDF set. The parton shower, fragmentation, and the underlying event are simulated using P ythia 6.428 [26] with the CTEQ6L1 PDF set and the correspond- ing Perugia 2012 tune [27]. The top-quark mass is set to 172.5 GeV. Higher-order corrections to both t¯ t and single-top cross sections are computed with Top ++ 2.0 [28]. These incorporate NNLO corrections in QCD, including resummation of next-to-next-to-leading logarithmic soft gluon terms.
Resonant and non-resonant signal processes are produced at LO using P ythia 8.186 with the NNPDF23LO PDF set [29] for event generation, parton showering and hadronization. In the case of Z
0production, in- terference effects are not included. However, for the production of non-resonant signal events, both DY and CI samples are generated to account for the significant interference effects between those two processes. Higher-order QCD corrections are computed as for the DY background and applied to both resonant and non-resonant MC samples. EW corrections are not applied to the resonant MC samples due to the high model dependence. However, these corrections are applied to the non-resonant MC samples as they involve interference between the DY and CI processes. Moreover, including the EW corrections leads to a more conservative estimate of the search sensitivity.
For all MC samples, except the diboson samples produced with S herpa , charm- and bottom-hadron decays are handled by E vt G en 1.2.0 [30]. The detector response is simulated with G eant 4 [31, 32] and the events are processed with the same reconstruction software as used for the data. Furthermore, the simulation includes the appropriate number of additional pp collisions (pileup) to reproduce running conditions.
4 Event selection
Electron reconstruction [33] in the central region of the ATLAS detector (|η | < 2.47) covered by the tracking detectors starts by electromagnetic seed cluster finding. A sliding window algorithm is applied to the grid of calorimeter towers (EM calorimeter divisions spanning ∆η × ∆φ regions of EM calori- meter, corresponding to the granularity of the middle calorimeter layer). Electron track reconstruction is optimised to account for possible high bremsstrahlung energy losses. Seed clusters that have at least one matching track are re-built using a larger window and their energies calibrated using a multi-variate technique followed by a final correction from a Z → ee sample. The electron energy is measured by its associated EM cluster whereas the direction is determined by the track associated with this cluster.
A likelihood discriminant is built to discriminate against electron candidates resulting from hadronic jets,
photon conversions, Dalitz decays and semileptonic heavy flavor hadron decays. The likelihood dis-
criminant utilizes lateral and longitudinal shower shape, tracking and cluster-track matching quantities.
Probability density functions are combined in a product to give a global probability function for signal electrons and for background. The discriminant value is then taken as a ratio of the signal probabil- ity density function to the sum of signal and background probability functions. Three operating points are defined for the likelihood discrimination: Loose, Medium and Tight each with progressively higher threshold on the discriminant. The variables used in building the discriminant and the discriminant cut value are also varied based on the candidate electron transverse energy E
Tand η. The likelihoods are tuned for 13 TeV pileup conditions and detector performance in 2015 [34]. In this analysis, the Medium working point is used in the search and the Loose working point is used in the data-driven background estimation (see Sec. 5). In addition to the likelihood discriminator, selection criteria based on track qual- ity are applied. The transition region between the central and forward regions of the calorimeters, in the range 1.37 ≤ | η | ≤ 1.52, exhibits degraded energy resolution and is therefore excluded. To suppress background from misidentified jets as well as from light- and heavy-flavour hadron decays inside of jets, electrons are required to pass both calorimeter-based and track-based isolation criteria with a fixed ef- ficiency of 99% over the full range of electron momentum. The calorimeter-based isolation relies on the ratio between the total transverse energy deposited in a cone of size ∆R = p
( ∆ η)
2+ ( ∆ φ)
2= 0.2 centered around the electron track and the electron E
T. Likewise, the track-based isolation relies on the ratio between the scalar sum of transverse momenta of tracks within a cone of radius ∆R = 10 GeV/p
T(restricted to a maximum of ∆R = 0.3) and the electron track transverse momentum p
T, where the tracks are required to have p
T> 1 GeV and |η | < 2.5.
Candidate muon tracks are, at first, reconstructed independently in the ID and the MS [35]. The two tracks are then used as input to a combined fit which takes into account the energy loss in the calorimeter and multiple scattering e ff ects. The ID track used for the combined fit is required to be within the ID acceptance, |η | < 2.5, and have a minimum number of hits in each ID sub-system. Muon candidates in the overlap of MS barrel and endcap region (1.01 < |η | < 1.10) are rejected due to potential for p
Tmismeasurement resulting from relative barrel-endcap misalignment. On-going improvements in the re- construction aim to allow analyses to use this region in the future. In order to reduce the background from light and heavy hadron decays inside of jets, muons are required to fulfil relative track-based isolation requirements with a fixed e ffi ciency of 99%, as defined above for electron candidates. The selected muon candidates must also pass within 10 mm of the primary interaction point in the z coordinate to suppress cosmic-ray background.
To improve momentum resolution and ensure a reliable measurement at very high momenta, muon tracks are required to have at least three hits in each of three precision chambers in the MS. Tracks which are traversing precision chambers with poor alignment are rejected. Finally, the q/p measurements performed independently in the ID and MS must agree within seven standard deviations of the sum in quadrature of the ID and MS momentum uncertainties.
In the dielectron channel, the presence of a two-electron trigger based on the Loose identification criteria with E
Tthreshold of 17 GeV is required. Events in the dimuon channel are required to pass at least one of two single-muon triggers with p
Tthresholds of 26 GeV and 50 GeV, with the former also requiring the muon to be isolated. Electron (muon) candidates are required to have E
T(p
T) greater than 30 GeV and have a transverse impact parameter consistent with the beam-line. Events are required to have at least one reconstructed primary vertex and at least one pair of same-flavour leptons.
Only the electron (muon) pair with the highest scalar sum E
T(p
T) is retained in each event and an opposite
charge requirement is applied in the dimuon case. The opposite charge requirement is not applied in the
dielectron channel due to higher chance of charge mis-identification for high-E
Telectrons, as the electron
candidate charge is assigned based on ID information only.
5 Background estimation
The backgrounds from processes producing two real leptons are modelled using MC simulated samples as described in Section 3. The processes for which MC simulation is used are: Drell-Yan, t t ¯ and single top as well as diboson production (W W , W Z, and Z Z). Energy (momentum) calibration and resolu- tion smearing is applied to electron (muon) candidates in the simulated samples to match performance observed in data. Event-level reweighting is applied in the simulated samples to match the trigger, recon- struction and isolation e ffi ciencies. The simulated samples for the top-quark (single and pair) production as well as diboson production are not simulated with sufficient statistics for modelling the dilepton mass distribution above several hundred GeV. Therefore, fits to smoothly decaying functions are used to extra- polate these background processes above dilepton masses (m
``) of 400 GeV. Variations of the functional form used as well as variations of the fit ranges contribute to the systematic uncertainty in the estimate of these background sources.
In the dimuon channel, contributions from W +jets and multi-jet production are negligible. However, the W +jets, multi-jet and other production processes where at most one real electron is produced contribute to the selected ee sample due to having one or more hadronic jets satisfying the electron selection criteria–
so called “fakes”. The contribution from these processes is estimated simultaneously with a data-driven technique, the matrix method, described in Ref. [10]. With this technique, exclusive samples are defined by loosening the selection criteria on one or both electron candidates. A matrix relationship is defined between counts of events in these sub-samples and sub-samples of events with zero, one or two true electrons and zero, one or two true jets. In this matrix, probabilities of electron identification from MC simulated samples and jet misidentification as an electron from dedicated data samples are used. The matrix is then inverted to obtain the contribution of events where one or both electron candidates result from jet fakes. The estimate is extrapolated using a smooth function fit to the m
eedistribution between 150 and 600 GeV to mitigate e ff ects of limited statistics in the high mass region. The uncertainties in this background estimate are evaluated by considering di ff erences in the estimates for same-charge and opposite-charge reconstructed electron pairs as well as by varying the measured rates for real electrons and changing the parameters of the extrapolation.
As a final step, the sums of backgrounds estimated using MC samples are rescaled independently in both channels so that the estimated count of events matches the data in the normalisation region 80 GeV < m
``< 120 GeV.
6 Systematic uncertainties
As a result of the background yield normalisation described above, the analysis is protected against the
luminosity uncertainty as well as any other mass-independent effect. A uniform uncertainty of 4% due to
the uncertainty in the Z/γ
∗cross-section in the normalisation region is applied to signal due to this pro-
cedure. This uncertainty was obtained using a calculation based on VRAP at NNLO evaluating variations
in PDF, scale and α
S. Mass-dependent systematic uncertainties, on the other hand, are considered as
nuisance parameters in the statistical interpretation and include both theoretical and experimental e ff ects
on the background and experimental e ff ects on the signal. Theoretical uncertainties in the background
prediction arise from the choice of the PDF set, the variations among different PDF eigenvector sets, the
PDF α
Sscale and higher-order EW corrections. The uncertainties in the DY background associated to
the PDF scale and α
Sare derived using VRAP with the former obtained by varying the renormalisation
and factorisation scales of the nominal CT14NNLO PDF up and down simultaneously by a factor of two.
The PDF variation systematic uncertainty is obtained using the CT14NNLO error set and by following the procedure described in Ref. [10]. It is treated as a single nuisance paramenter in the statistical ana- lysis of the results. An additional uncertainty is derived due to the choice of the nominal PDF set, by comparing the central values of CT14NNLO with those from other PDF sets, namely MMHT14 [36], NNPDF3.0 [37], ABM12 [38], and JR14 [39]. The maximum absolute deviation from the envelope of these comparisons is used symmetrically as the PDF choice uncertainty.
The following sources of experimental uncertainties are accounted for: lepton trigger efficiency, recon- struction and isolation e ffi ciency, lepton energy scale and resolution, and MC statistics. E ffi ciencies are evaluated using events from the Z → `` peak and then extrapolated to high energies. To estimate the systematic uncertainty due to this extrapolation in the electron channel, differences in the electron shower shapes between data and Monte Carlo simulation in the Z → ee peak are propagated to the high-E
Telectron sample. The e ff ect on the electron ID e ffi ciency was found to be 2.0% and is independent of E
Tfor electrons with E
Tabove 150 GeV. The uncertainty in the muon reconstruction efficiency includes the uncertainty obtained from Z → µµ data studies as well as a high-p
Textrapolation uncertainty corres- ponding to the magnitude of the drop in the muon reconstruction and selection e ffi ciency with increasing p
Tthat is predicted by the MC simulation. Mismodelling of the muon momentum resolution due to re- sidual misalignments in the MS can alter the steeply falling background shape at high dilepton mass and can significantly modify the width of the signal line shape. This uncertainty is obtained by studying ded- icated data-taking periods with no magnetic field in the MS. For the dielectron channel, the systematic uncertainty includes a contribution from the multi-jet and W + jets data-driven estimation that is obtained by varying both the overall normalisation and the extrapolation methodology as explained in Section 5.
Systematic uncertainties used in the statistical analysis of the results are summarised in Table 1 at dilepton mass values of 2 TeV and 3 TeV.
7 Event yields
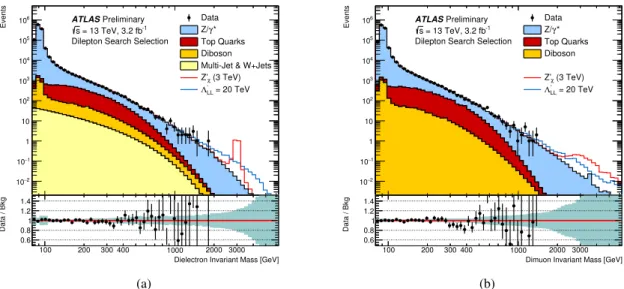
Expected and observed event yields are shown in Table 2 in bins of invariant mass, for both the dielectron (top) and the dimuon channel (bottom). Expected events are split into the different background sources and the numbers for two signal scenarios are also given. Distributions of m
``in the dielectron and dimuon channels are shown in Fig. 1. No significant excess is observed as discussed in Section 8.
8 Statistical analysis
A search for a resonant signal is performed using the m
``distribution in the dielectron and dimuon
channels utilizing the log likelihood ratio test (LLR). For a given signal hypothesis a likelihood function
L (n|Θ ,θ) is constructed where n is a vector of event counts in the bins of the m
``histogram, Θ is the
parameter of interest, here set to the signal strength µ, and θ is a vector of nuisance parameters modelling
systematic uncertainties. The likelihood is a product over all bins of the m
``histogram of individual
bin likelihoods. The product is taken over the bins of m
``histograms in the ee and µµ channels for the
individual channel tests and over all bins of both m
``histograms for the combined test. The likelihood for
bin i is the Poisson probability to observe a number of events n
i, given the expected number of events in
that bin n
i,exp. The quantity n
i,expis a function of the parameter of interest Θ and the nuisance parameters
Table 1: Summary of the systematic uncertainties in the expected number of events at a dilepton mass of 2 TeV (3 TeV). For the background the values quoted represent relative shift in the m
``histogram bin spanning the given reconstructed m
``mass of 2 TeV (3 TeV). For the signal uncertainties the values were computed using a Z
0χsignal model with a pole mass of 2 TeV (3 TeV) by comparing yields in the core of the mass peak (within the full width at half maximum) between the distribution varied under a given uncertainty and the nominal distribution.
Uncertainties due to high-p
Textrapolation are included in the e ffi ciency uncertainty. N / A represents cases where the uncertainty is not applicable.
Source Dielectron Dimuon
Signal Background Signal Background
Normalisation 4.0% (4.0%) N / A 4.0% (4.0%) N / A
PDF Choice N / A 9.1% (17%) N / A 5.3% (7.4%)
PDF Variation N/A 5.3% (11%) N/A 4.4% (6.5%)
PDF Scale N / A 1.8% (2.3%) N / A 1.7% (1.9%)
Photon-induced corrections N / A 3.4% (5.4%) N / A 3.2% (3.8%)
Efficiency 5.1% (5.0%) 5.1% (5.0%) 13% (19%) 13% (19%)
Scale & Resolution <1.0% (<1.0%) 7.8% (9.1%) 20% (26%) 20% (46%) Multi-jet & W + jets N / A <1.0% (<1.0%) N / A N / A MC Statistics <1.0% (<1.0%) <1.0% (<1.0%) <1.0% (<1.0%) <1.0% (<1.0%)
Total 6.5% (6.4%) 15% (24%) 25% (32%) 26% (51%)
Table 2: Expected and observed event yields in the dielectron (top) and dimuon (bottom) channels in di ff erent dilepton mass intervals. The quoted errors correspond to the combined statistical and systematic uncertainties.
mee[GeV] 500-700 700-900 900-1200 1200-1800 1800-3000 3000-6000
Drell–Yan 145±30 38±6 16±4 5.6±1.6 0.87±0.26 0.026±0.012
Top Quarks 43.8±2.9 5.4±1.2 0.9±0.5 0.09±0.11 0.002±0.006 <0.001 Diboson 7.7±1.1 1.4±0.5 0.39±0.26 0.08±0.12 0.005±0.030 <0.001 Multi-Jet & W+Jets 4±4 1.1±0.8 0.40±0.16 0.089±0.019 0.0042±0.0014 <0.001
Total SM 201±31 46±7 17±4 5.8±1.6 0.88±0.26 0.026±0.012
Data 202 44 17 9 0 0
SM+Z0(mZ0=3 TeV) 201±31 46±7 17±4 5.9±1.6 2.6±1.1 1.44±0.34 SM+CI (ΛLL− =25 TeV) 207±31 49±7 20±4 8.0±1.6 2.11±0.27 0.251±0.019
mµ µ[GeV] 500-700 700-900 900-1200 1200-1800 1800-3000 3000-6000
Drell–Yan 110±7 27.5±2.2 11.8±1.1 4.5±0.7 0.70±0.08 0.079±0.023 Top Quarks 39.5±0.8 6.7±0.4 0.89±0.15 0.046±0.032 <0.001 <0.001 Diboson 3.98±0.32 0.65±0.11 0.229±0.028 0.022±0.006 0.00104±0.00034 <0.001 Total SM 151±7 35.5±2.3 14.2±1.1 4.6±0.7 0.71±0.08 0.079±0.024
Data 169 28 13 4 0 0
SM+Z0(mZ0=3 TeV) 151±7 35.5±2.3 14.2±1.1 4.6±0.7 2.13±0.26 0.8±0.4 SM+CI (ΛLL− =25 TeV) 162±8 38.1±2.4 15.3±1.2 5.5±0.8 0.87±0.09 0.099±0.035
θ. Signal acceptance varying as a function of signal pole mass and decay channel is taken into account
in the computation of n
i,exp. The nuisance parameters are assumed to be Gaussian-distributed. The test
Events
2 10−
−1 10
1 10 102 103 104 105
106 Data
* γ Z/
Top Quarks Diboson Multi-Jet & W+Jets
(3 TeV) Z’χ
= 20 TeV
-
ΛLL
Preliminary ATLAS
= 13 TeV, 3.2 fb-1
s
Dilepton Search Selection
Dielectron Invariant Mass [GeV]
90100 200 300 400 1000 2000 3000
Data / Bkg
0.6 0.8 1 1.2 1.4
100
(a)
Events
2 10−
−1 10
1 10 102 103 104 105
106 Data
* γ Z/
Top Quarks Diboson
(3 TeV) Z’χ
= 20 TeV
-
ΛLL
Preliminary ATLAS
= 13 TeV, 3.2 fb-1
s
Dilepton Search Selection
Dimuon Invariant Mass [GeV]
90100 200 300 400 1000 2000 3000
Data / Bkg
0.6 0.8 1 1.2 1.4
100
(b)
Figure 1: Dielectron (a) and dimuon (b) reconstructed mass distributions after selection, for data and the SM back- ground estimates as well as their ratio. Two selected signals are overlaid, resonant Z
0χwith pole mass of 3 TeV and non-resonant CI with LL constructive interference and Λ
−LL
= 20 TeV. The bin width of the distributions is constant in log(m
``) and the green band in the lower panel illustrates the total systematic uncertainty, as explained in Section 6.
statistic q
0is defined as:
q
0= 0,± ln
"
L (n | 0, θ ˆ
0) L (n | Θ, ˆ θ) ˆ
#
, (2)
where ˆ Θ and ˆ θ denote the values of the strength parameter and the nuisance parameters for which L is maximized and ˆ θ
0denotes the values of the nuisance parameters that maximize L when the strength parameter is held at 0. The negative sign is selected for ˆ µ > 0. For ˆ µ < 0, the positive sign is chosen for test signal masses below 900 GeV (where substantial SM background is expected) to quantify the significance of potential deficits in the data, otherwise q
0is set to 0. In the presence of background only, q
0is distributed as a χ
2for one degree of freedom and therefore the p-value for finding a more signal-like excess than observed is computed analytically [40, 41]. Multiple mass hypotheses are tested using Z
0χas a signal in pole mass steps corresponding to the histogram bin width to compute the local p-values - that is p-values corresponding to specific signal mass hypotheses. The bin width of the m
``histogram is chosen to correspond to the resolution in the specific dilepton channel varying from 5 GeV (25 GeV) at m
ee(m
µ µ) of 500 GeV to 15 GeV (180 GeV) at m
ee(m
µ µ) of 2 TeV. Pseudo-experiments are used to estimate the distribution of the lowest local p-value in the absence of any signal. The p-value to find anywhere in the m
``distribution an excess more significant than the one in the data (global p-value) is then computed.
The test does not reveal any signal-like excess in the data. In addition, a test for any excess anywhere in the m
``histogram following the B ump H unter methodology [42] confirms compatibility of the data with the SM prediction.
Upper limits are set on the Z
0production cross section times branching ratio to the dilepton final state (σ B) and lower limits are set on the CI scale Λ in a variety of interference and chiral coupling scenarios.
In both cases, the likelihood functions L(n|Θ, θ) for individual channels and for the full dataset are
constructed as above. For constraining the Z
0(CI) models, the parameter of interest is σB ( Λ ). The
logarithmic m
``histogram binning shown in Fig. 1 is chosen for setting limits on resonant signals using
Z
0χsignal templates as in the search phase. For setting the limits on the CI interaction scale Λ, the m
``mass distribution above 400 GeV is used with bin widths varying from 100 to 500 GeV. The Bayes Theorem is applied and nuisance parameters are marginalised to obtain the posterior probability density function P(Θ|n). The prior probability P(Θ) is chosen to be uniform and positive in either the cross section for the Z
0search and 1/Λ
2or 1/Λ
4for the CI search. For the CI search, these choices of the prior are selected to study the cases where dilepton production cross section is dominated by the interference terms and when it is dominated by the pure contact interaction term. The upper (lower) 95% percentile of P( Θ|n) is then quoted as the upper (lower) 95% credibility level limit on σB ( Λ ). The above calculations have been performed with the Bayesian Analysis Toolkit (BAT) [43], which uses a Markov Chain Monte Carlo technique to integrate over the nuisance parameters. Limit values obtained using the experimental data are quoted as observed limits, while median values of the limits from a large number of pseudo- experiments, where only SM background is present, are quoted as the expected limits. The upper limits on the Z
0σB are interpreted as lower limits on the Z
0pole mass using the relationship between the pole mass and the theoretical Z
0cross section.
9 Results
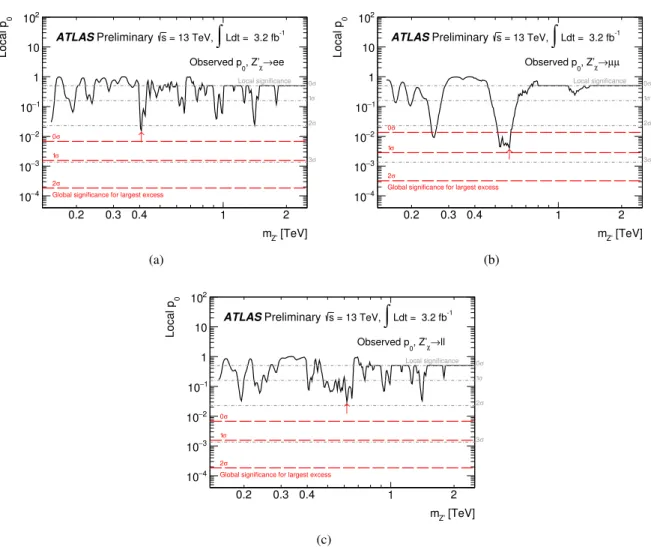
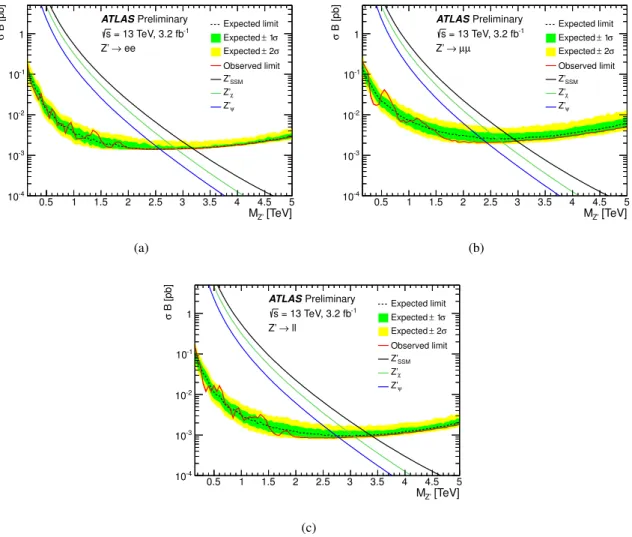
The statistical tests described in the previous section do not reveal presence of a signal. The B ump H unter tests find SM p-values of 70% and 75% in the dielectron and dimuon channels, respectively. The results of the LLR tests are shown in Fig. 2, which show the local p-value distributions and the global p-value for the most significant excess in the dielectron, dimuon and combined channels. The largest deviations correspond to global SM p-values of 73%, 24% and 92% in the dielectron and dimuon channels, as well as for both channels combined, respectively. Upper limits on σB for Z
0production and decay in the dielectron, dimuon and combined channels are shown in Fig. 3. The observed and expected lower pole mass limits for various Z
0scenarios are summarised in Table 3. The lower limits on the CI interaction scale Λ where a prior uniform and positive in 1 / Λ
2is used are summarised in Fig. 4. Table 4 gives an overview of Λ lower limits for all considered chiral coupling and interference scenarios as well as both choices of the prior Λ probability.
Table 3: Observed and expected 95% C.L. lower mass limits for various Z
0gauge boson models.
Model Width [%] ee [TeV] µµ [TeV] `` [TeV]
Exp Obs Exp Obs Exp Obs
Z
SSM03.0 3.17 3.18 2.91 2.98 3.37 3.40
Z
0χ1.2 2.87 2.88 2.64 2.71 3.05 3.08
Z
S01.2 2.83 2.84 2.59 2.67 3.00 3.03
Z
I01.1 2.78 2.78 2.53 2.62 2.95 2.98
Z
N00.6 2.64 2.64 2.38 2.48 2.81 2.85
Z
η00.6 2.64 2.65 2.38 2.48 2.81 2.85
Z
ψ00.5 2.58 2.58 2.32 2.42 2.74 2.79
[TeV]
mZ’
0.2 0.3 0.4 1 2
0Local p
−4
10
−3
10
−2
10
−1
10 1 10 102
σ Local significance 0
σ 1
σ 2
σ 3 σ
0
σ 1
σ 2
Global significance for largest excess
↑
ATLASPreliminary s = 13 TeV,
∫
Ldt = 3.2 fb-1→ee , Z’χ
Observed p0
(a)
[TeV]
mZ’
0.2 0.3 0.4 1 2
0Local p
−4
10
−3
10
−2
10
−1
10 1 10 102
σ Local significance 0
σ 1
σ 2
σ 3 σ
0
σ 1
σ 2
Global significance for largest excess
↑
ATLASPreliminary s = 13 TeV,
∫
Ldt = 3.2 fb-1 µ µχ→
0, Z’
Observed p
(b)
[TeV]
mZ’
0.2 0.3 0.4 1 2
0Local p
−4
10
−3
10
−2
10
−1
10 1 10 102
σ Local significance 0
σ 1
σ 2
σ 3 σ
0
σ 1
σ 2
Global significance for largest excess
↑
ATLASPreliminary s = 13 TeV,
∫
Ldt = 3.2 fb-1→ll , Z’χ
Observed p0
(c)
Figure 2: Distributions of local p-value for (a) dielectron, (b) dimuon and (c) combined channels derived for ideal
Z
0χsignals with pole mass between 0.15 and 2.5 TeV. Also indicated are local and global significance levels shown
as dashed lines. Global significance level is computed for the most significant excess.
[TeV]
MZ’
0.5 1 1.5 2 2.5 3 3.5 4 4.5 5
B [pb]σ
10-4
10-3
10-2
10-1
1
Expected limit 1σ Expected ±
σ 2
± Expected Observed limit Z’SSM
Z’χ
Z’ψ
Preliminary ATLAS
ee Z’ →
= 13 TeV, 3.2 fb-1
s
(a)
[TeV]
MZ’
0.5 1 1.5 2 2.5 3 3.5 4 4.5 5
B [pb]σ
10-4
10-3
10-2
10-1
1
Expected limit 1σ Expected ±
σ 2
± Expected Observed limit Z’SSM
Z’χ
Z’ψ
Preliminary ATLAS
µ µ Z’ →
= 13 TeV, 3.2 fb-1
s
(b)
[TeV]
MZ’
0.5 1 1.5 2 2.5 3 3.5 4 4.5 5
B [pb]σ
10-4
10-3
10-2
10-1
1
Expected limit 1σ Expected ±
2σ Expected ± Observed limit Z’SSM
Z’χ
Z’ψ
Preliminary ATLAS
ll Z’ →
= 13 TeV, 3.2 fb-1
s
(c)
Figure 3: Upper 95% C.L. limits on the Z
0production cross section times branching ratio to two leptons. Shown are
results for the (a) dielectron channel, (b) dimuon channel and (c) combined channels
Chiral Structure
LL Const LL Dest LR Const LR Dest RL Const RL Dest RR Const RR Dest
[TeV]Λ
15 20 25 30 35 40
Observed Expected
1 σ Expected ±
2 σ Expected ±
= 8 TeV, 20 fb-1
s Preliminary
ATLAS
= 13 TeV, 3.2 fb-1
s Λ2
Prior: 1/