ATLAS-CONF-2012-148 12November2012
ATLAS NOTE
ATLAS-CONF-2012-148
November 9, 2012
Search for New Phenomena in the Dijet Mass Distribution updated using 13 fb
−1of pp Collisions at √
s = 8 TeV collected by the ATLAS Detector
The ATLAS Collaboration
Abstract
The dijet mass distribution produced in LHC proton-proton collisions at a centre-of-mass energy
√s =
8 TeV has been studied with the ATLAS detector using 2012 data with an integrated luminosity of 13 fb
−1, reaching dijet masses up to
∼4.69 TeV. This note updates the results of ATLAS-CONF-2012-088. No resonance-like features have been observed in the dijet mass spectrum. A new 95% C.L. lower limit on the mass of excited quarks has been set at 3.84 TeV. Extended limits on the
σ× A, the product of production cross section and acceptance for hypothetical narrow particles, have also been produced using simplified Gaussian models.
c Copyright 2012 CERN for the benefit of the ATLAS Collaboration.
Reproduction of this article or parts of it is allowed as specified in the CC-BY-3.0 license.
1 Introduction
A search for new resonances and interactions in two-jet (dijet) final states, using the dijet mass distribution, was presented in Ref. [1], with 5.8 fb
−1of 8 TeV proton-proton collision data collected by the ATLAS detector in 2012. In that study, a 95% credibility-level (C.L.) exclusion limit on the mass of excited quarks, q
∗, was set at 3.66 TeV. In the same time period, the CMS Collaboration set a q
∗limit of 3.19 TeV, based on 4.0 fb
−1of pp collision data at 8 TeV [2]. As an additional comparison, the ATLAS Collaboration has recently submitted an analysis of the full 4.8 fb
−12011 data set at 7 TeV [3] to the Journal of High Energy Physics, setting a q
∗limit of 2.83 TeV.
Here we present an update of the ATLAS 2012 analysis presented in Ref. [1], using a 2012 data sample that has been extended to an integrated luminosity of 13.0 fb
−1. The analysis strategy remains unchanged; in the following we summarise the essential elements of the previous analysis, and then describe the changes that have been made since.
Jets are reconstructed using the anti-k
tjet clustering algorithm [4, 5] with the distance parameter, R, of 0.6. Jets are calibrated accounting for the shift in the calorimeter response caused by the presence of multiple events in each bunch crossing, and their energy is restored to the hadronic scale [6]. Events are selected where the two highest- p
Tjets satisfy the rapidity requirement
|y|<2.8 along with the dijet CM rapidity requirement
|y∗|<0.6
1and the dijet mass criterion m
j j >1000 GeV. The event trigger consists of the logical OR of two central (
|η| <3.2), single-jet triggers, used to select events having at least one large transverse energy deposition in the calorimeter. This combined trigger avoids the inefficiencies due to splitting and merging of jets, as described in Ref. [1]. The kinematic criteria restrict jets in the analysis to have a minimum p
Tjof 150 GeV. The maximum jet p
Tobserved is 2.34 TeV, while the highest invariant mass event has a dijet mass of 4.69 TeV.
The current study is based on the analysis of the dijet invariant mass distribution for the selected events. The background is estimated using the observed dijet mass spectrum by fitting a smooth four- parameter function to the data:
f (x)
=p
1(1
−x)
p2x
p3+p4lnx.(1) The fitting function has been used by ATLAS and other experiments [7–10]. This treatment of the background greatly reduces the effects of jet energy scale uncertainties, and the luminosity uncertainty.
The search for new phenomena in the dijet mass distribution reduces to the search for significant local excesses (“bumps” or “resonances”) above this parameterised background.
In 2012 the LHC has delivered increased instantaneous luminosity as well as a significant number of in-time pile-up events (multiple pp collisions in the same bunch crossing) and out-of-time pile-up events (multiple pp collisions in nearby bunch crossings). In the previous analysis the effects of this pile-up were seen to be small for high- p
Tjets, such as those considered in this analysis; and the in-time and out-of-time pile-up conditions at the LHC were rather similar throughout 2012.
The understanding of the jet energy scale and its uncertainties improved over the course of the 2012 data taking, but no substantial changes were made in the jet calibration procedure. Jet performance and identification criteria were checked with the larger dataset used for this updated study, both globally and as a function of data taking period.
2 Changes made in the current analysis
The analysis strategy was described in detail in the documentation of the previous version with 5.8 fb
−1[1]. In the current study, none of the selection criteria have been changed, but there have been improvements in the search and limit-setting phases of the analysis.
•
In the search phase, which looks for significant local excesses, the fitting procedure was formerly based on the
χ2test, under the assumption that the bin populations were Gaussianly distributed.
1In a given event,y∗=±12(y1−y2), where the rapidities of the highestpTjets are denoted byy1andy2.
This has been replaced by a maximum-likelihood fit that assumes Poisson distributed statistical populations, giving more stability in the low-statistics bins at high dijet mass. The revised fitting procedure has been tested using the 5.8 fb
−1dataset and does not significantly change the results.
•
The limit-setting phase is based as before on a Bayesian analysis of
σ× A, the product of the production cross section and acceptance for a hypothetical new particle decaying into dijets. In this iteration of the analysis, the background for each mass point is determined using a fit to the data of the four-parameter function as in Eq. 1, augmented by the fully simulated dijet mass distribution signal template. The latter is scaled by a multiplicative constant to be determined in the fit. This accounts for the presence of a possible signal component that could influence the background estimate.
The dominant source of uncertainty in the limit setting phase is that associated with the jet energy scale. The first estimate of the jet energy scale uncertainty was derived in 2010 [6]. It was improved in 2011 based on studies of flavour and topology uncertainties, and was extended to the forward region em- ploying
ηintercalibration studies in dijet events [11]. Pile-up produces an additional source of systematic uncertainty depending on the number of primary vertices, and on the average number of interactions per bunch crossing. The first estimate of the effect of pile-up on the jet energy scale uncertainty was devel- oped in 2011 [12], and subsequently validated with in situ momentum balance techniques in studies of the 2012 data.
The jet energy scale at high p
Twas re-adjusted since the previous iteration of the analysis, leading to an increase of
∼2% in the energy scale above 1 TeV and to a reduction of the jet energy scale uncertainty of roughly 1%. The p
Tand
ηdependent jet energy scale uncertainty for calibrated jets is as low as 4%
in the central detector region.
Numerous studies of event selections and jet corrections were performed to check the stability of the established procedures and the improvements. The trigger efficiency as a function of dijet mass was compared for the first and second halves of the data sample, and found to agree within statistical uncertainties. Jet quality selections from the previous analysis were validated with the entire dataset and used here. As in the case of the previous analysis, an additional correction was applied to jets affected by dead calorimeter cells and modules. A study of events with one of the two leading jets entering the dead region was used to assess the effect on the jet energy scale exploiting transverse momentum balance in dijet events. In all cases, the studies showed that uncertainties arising from all corrections were well within the jet energy scale uncertainties considered in the analysis. The effect of the jet energy resolution uncertainty was tested both on the templates and on the background estimation and found to be negligible.
3 Updated results
3.1 Background determination and search for dijet mass resonances
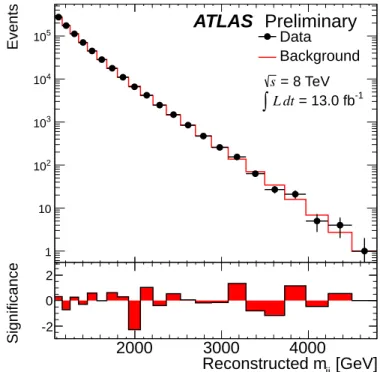
Fig. 1 shows the updated mass spectrum and the resulting background fit obtained using the smooth
four-parameter function. The lower panel of Fig. 1 shows the significance, in number of Gaussian stan-
dard deviations, of the difference between the data and the fit in each bin. The significance is purely
statistical, and based on Poisson distributions. The contents of a given bin is used to determine the p-
value, the probability of the background fluctuating higher than the observed excess or lower than the
observed deficit. The p-value is transformed into a significance in terms of an equivalent number of
Gaussian standard deviations (the z-value) [13]. Where there is an excess (deficit) in data in a given bin,
the significance is plotted as positive (negative). In certain cases, the significance for individual bins is not plotted.
22000 3000 4000
1 10 102
103
104
105 Data
Background
[GeV]
Reconstructed mjj
2000 3000 4000
EventsSignificance -2
0 2
ATLAS Preliminary
= 13.0 fb-1
dt L
∫
= 8 TeVs
Figure 1: The reconstructed dijet mass distribution with statistical uncertainties (filled points with error bars) fitted with a smooth functional form (solid line). The bin-by-bin significance of the data-fit differ- ence in Gaussian standard deviations is shown in the lower panel, using positive values for excesses and negative values for deficits. If a p-value greater than 50% is found the corresponding significance is not shown (see text).
The choice of dijet mass binning was motivated by the absolute resolution of the signal in the dijet mass distribution. The m
j jresolution was evaluated using Monte Carlo as described in Ref. [3] and it was found to improve from 7% at 1 TeV to less than 4% at 3 TeV. The analysis of the mass spectrum begins with this distribution normalised to events per bin. The maximum-likelihood fit to determine the four parameters of the smooth function is intended to be applied to a distribution in events per GeV, while retaining integer bin contents to account for Poisson statistics. The bin-width correction required to bridge these units is performed within the fitting procedure.
To test the degree of global consistency between the data and the fitted background, the p-value of the fit is determined by calculating the
χ2-value from the data and comparing this result to the
χ2distri- bution obtained from pseudo-experiments drawn from the background fit, as described in the previous publication [1]. In the current analysis, the
χ2/NDF =15.5/18
=0.86, corresponding to a p-value of 0.61, showing that there is good agreement between the data and the fit.
The B
umpH
unteralgorithm [14, 15] is used to establish the presence or absence of a localised res- onance in the dijet mass spectrum, assuming Poisson statistics, and taking proper account of the “look- elsewhere effect” [16], as described in greater detail in previous publications [10, 17]. Furthermore, to prevent any new physics signal from biasing the background estimate, the region corresponding to the
2In mass bins with a small expected number of events, where the observed number of events is similar to the expectation, the Poisson probability of a fluctuation at least as high (low) as the observed excess (deficit) can be greater than 50%, as a result of the asymmetry of the Poisson distribution. When the significance is below zero in a bin, it is not meaningful, and the bar is not drawn in this case.
most significant local excess is excluded if the p-value of the fit is below 0.01 and a new background fit is performed. For the current dataset, no such exclusion is needed and no significant excess has been found.
3.2 Limits on excited quark production
In the absence of any observed significant discrepancy with the zero-signal hypothesis, the Bayesian method documented in the original study [1] is used to set 95% C.L. upper limits on
σ× A, for a hypothetical narrow new particle decaying into dijets. As in the original study, MC samples at 8 TeV have been generated for a set of discrete q
∗masses ranging from 1000 to 6000 GeV with P
ythia8 [18]
using the MC12 AU2 tune [19] with the CT10 PDFs [20]. The acceptance includes reconstruction and trigger efficiencies, which are typically near 100%. For q
∗, the acceptance
Aranges from 11% to 54%
for m
q∗varying from 1 TeV to 4.25 TeV, and is never lower than 48% for masses above 2 TeV. The main impact on the acceptance comes from the rapidity selection criteria.
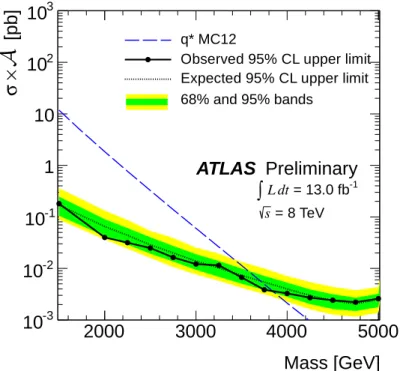
The summary plot from the limit-setting analysis is shown in Fig. 2. The observed (expected) lower limit on the mass of excited quarks is 3.84 TeV (3.70 TeV). The worsening of the limit at the 5 TeV mass point can be explained by the change in shape of the simulated q
∗signal, due to the rapidly decreasing parton luminosities as the dijet mass approaches the kinematic limit.
Mass [GeV]
2000 3000 4000 5000
[pb] xA × σ
10
-310
-210
-11 10 10
210
3q* MC12
Observed 95% CL upper limit Expected 95% CL upper limit 68% and 95% bands
ATLAS Preliminary
= 13.0 fb-1
dt L
∫
= 8 TeV s
Figure 2: The 95% C.L. upper limit on
σ× Aas a function of dijet resonance mass (black filled circles).
The black dotted curve shows the expected 95% C.L. upper limit and the green (darker) and yellow (lighter) bands represent the 68% and 95% contours of the expected limit, respectively. The blue dashed curve represents the excited-quark
σ× Aprediction.
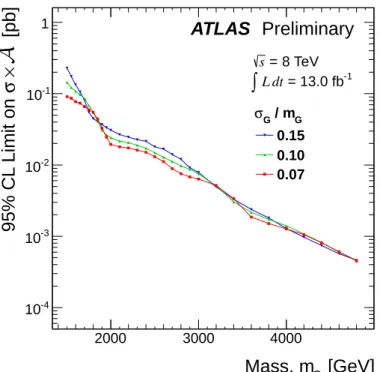
3.3 Limits on simplified Gaussian models
As in Ref. [1] we also set limits on simplified Gaussian models, to facilitate comparisons with other
new physics (NP) models beyond those considered in the current studies. Gaussian distributions of
reconstructed dijet mass are added to the background estimation, for various means and widths. Upper
95% C.L. limits on
σ×Aare set taking into account systematic uncertainties. The behaviour of the limits
for the different widths is driven by the increased sensitivity to single-bin fluctuations for the narrower (7%) signals.
[GeV]
Mass, m
G2000 3000 4000
[pb] xA × σ 9 5 % C L L im it o n
10-4
10-3
10-2
10-1
1
/ mG
σG
0.15 0.10 0.07
ATLAS Preliminary
= 13.0 fb-1
dt L
∫
= 8 TeV s
Figure 3: The 95% C.L. upper limits on
σ× Afor a simple Gaussian resonance decaying to dijets as a function of the mean mass, m
G, for three values of
σG/mG, taking into account both statistical and systematic uncertainties.
The resulting limits on
σ× Aare shown in Fig. 3 and detailed in Table 1. This analysis may be used under the condition that the NP signal shape approaches a Gaussian distribution after applying the kinematic selection criteria to
y∗, m
j jand
ηof the leading jets. The acceptance should include the branching ratio of the particle decaying into dijets and the physics selection efficiency. The ATLAS m
j jresolution is about 5%, hence NP models with a width smaller than 7% should be compared to the 7% column of Table 1. Models with a greater width should use the column that best matches their width. A detailed description of the recommended analysis procedure, including the treatment of detector resolution effects, is given in Ref. [17].
34 Conclusions
An update of the search for new particles decaying into dijets is presented, based on an integrated luminosity of 13.0 fb
−1collected in 2012 with the ATLAS detector from pp collisions at 8 TeV center-of- mass at the LHC. No substantial changes were made to the previous analysis. No resonance-like features have been observed in the dijet mass spectrum. A new 95% C.L. exclusion limit on the mass of excited quarks has been set at 3.84 TeV. Limits on
σ× Afor simplified Gaussian resonances have also been extended.
3The primary difference with respect to Ref. [17] lies in the recovery of the problematic calorimeter regions: there is no longer need for the acceptance correction described in the reference.
Table 1: The 95% C.L. upper limit on
σ× A[pb] for the Gaussian model. The symbols m
Gand
σGare, respectively, the mean mass and standard deviation of the Gaussian.
m
G σG/mG(GeV) 7% 10% 15%
1500 0.091 0.14 0.23
1550 0.086 0.12 0.17
1600 0.077 0.11 0.13
1650 0.074 0.097 0.11
1700 0.066 0.085 0.081
1750 0.059 0.068 0.055
1800 0.055 0.055 0.045
1850 0.044 0.041 0.041
1900 0.033 0.031 0.037
1950 0.025 0.026 0.033
2000 0.019 0.024 0.031
2100 0.018 0.022 0.027
2200 0.017 0.021 0.025
2300 0.016 0.019 0.023
2400 0.015 0.017 0.021
2500 0.013 0.015 0.018
2600 0.011 0.013 0.017
2700 0.0089 0.011 0.014 2800 0.0075 0.0097 0.012 2900 0.0068 0.0087 0.0091 3000 0.0063 0.0075 0.0079 3200 0.0052 0.0051 0.0049 3400 0.0034 0.0030 0.0033 3600 0.0019 0.0022 0.0024 3800 0.0015 0.0017 0.0018 4000 0.0013 0.0014 0.0013 4200 0.0010 0.0011 0.00097 4400 0.00081 0.00082 0.00074 4600 0.00061 0.00060 0.00057 4800 0.00045 0.00046 0.00046
References
[1] ATLAS Collaboration, Search for New Phenomena in the Dijet Mass Distribution using 5.8 fb
−1of pp Collisions at
√s
=8 TeV collected by the ATLAS Detector, ATLAS-CONF-2012-088, 2012.
[2] CMS Collaboration, Search for Narrow Resonances using the Dijet Mass Spectrum in pp Collisions at
√s
=8 TeV , CMS PAS EXO-12-016, 2012.
[3] ATLAS Collaboration, ATLAS search for new phenomena in dijet mass and angular distributions using pp collisions at
√s
=7 TeV, submitted to JHEP (2012) , arXiv:1210.1718 [hep-ex].
[4] M. Cacciari, G. P. Salam, and G. Soyez, The anti-k
tjet clustering algorithm, JHEP
04(2008) 063,
arXiv:0802.1189 [hep-ph].
[5] M. Cacciari and G. P. Salam, Dispelling the N
3myth for the k
tjet-finder, Phys. Lett.
B641(2006) 57, arXiv:0512210 [hep-ph].
[6] ATLAS Collaboration, Jet energy measurement with the ATLAS detector in proton-proton collisions at
√s
=7 TeV, accepted by EPJC (2011) , arXiv:1112.6426 [hep-ex].
[7] CDF Collaboration, Search for new particles decaying into dijets in p p collisions at ¯
√
s
=1.96 TeV, Phys. Rev.
D79(2009) 112002, arXiv:0812.4036 [hep-ex].
[8] ATLAS Collaboration, Search for New Particles in Two-Jet Final States in 7 TeV Proton-Proton Collisions with the ATLAS Detector at the LHC, Phys. Rev. Lett.
105(2010) 161801,
arXiv:1008.2461 [hep-ex].
[9] CMS Collaboration, Search for Dijet Resonances in 7 TeV pp Collisions at CMS, Phys. Rev. Lett.
105(2010) 211801, arXiv:1107.4771 [hep-ex].
[10] ATLAS Collaboration, Search for New Physics in Dijet Mass and Angular Distributions in pp Collisions at
√s
=7 TeV Measured with the ATLAS Detector, New Journal of Physics
13(2011) 053044, arXiv:1103.3864 [hep-ex].
[11] ATLAS Collaboration, In situ jet pseudorapidity intercalibration of the ATLAS detector using dijet events in
√s
=7 TeV proton-proton 2011 data, ATLAS-CONF-2012-124, 2012.
[12] ATLAS Collaboration, Pile-up corrections for jets from proton-proton collisions at
√s=7 TeV in ATLAS in 2011, ATLAS-CONF-2012-064, 2012.
[13] G. Choudalakis and D. Casadei, Plotting the Differences Between Data and Expectation, Eur.
Phys. J. Plus (2012) 25, arXiv:1111.2062v3 [physics.data-an].
[14] CDF Collaboration, Global Search for New Physics with 2.0 fb
−1at CDF, Phys. Rev.
D79(2009) 011101, arXiv:0809.3781 [hep-ex].
[15] G. Choudalakis, On hypothesis testing, trials factor, hypertests and the BumpHunter, arXiv:1101.0390 [physics.data-an].
[16] L. Lyons, Open statistical issues in Particle Physics, Ann. Appl. Stat.
2(2008) 887.
[17] ATLAS Collaboration, Search for new physics in the dijet mass distribution using 1 fb
−1of pp collision data at
√s
=7 TeV collected by the ATLAS detector, Phys. Lett.
B708(2012) 37, arXiv:1108.6311 [hep-ex].
[18] T. Sjostrand, S. Mrenna, and P. Z. Skands, A Brief Introduction to PYTHIA 8.1, Comput. Phys.
Commun.
178(2008) 852–867, arXiv:0710.3820 [hep-ph].
[19] ATLAS Collaboration, Further ATLAS tunes of Pythia 6 and Pythia 8, ATL-PHYS-PUB-2011-014, 2011.
[20] P. M. Nadolsky et al., New parton distributions for collider physics, Phys. Rev.
D82(2010)
074024, arXiv:1007.2241 [hep-ph].
Appendices
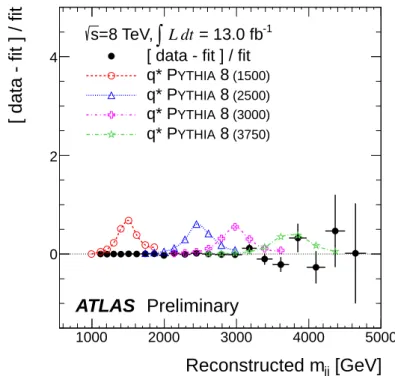
A Comparison of signal and data with background prediction
[GeV]
Reconstructed m
jj1000 2000 3000 4000 5000
[ data - fit ] / fit
0 2 4
= 13.0 fb-1
dt L
∫
=8 TeV, s
[ data - fit ] / fit
(1500)
8
YTHIA
q* P
(2500)
8
YTHIA
q* P
(3000)
8
YTHIA
q* P
(3750)
8
YTHIA
q* P
![Table 1: The 95% C.L. upper limit on σ × A [pb] for the Gaussian model. The symbols m G and σ G are, respectively, the mean mass and standard deviation of the Gaussian.](https://thumb-eu.123doks.com/thumbv2/1library_info/4029313.1542259/7.892.309.584.164.818/table-upper-gaussian-symbols-respectively-standard-deviation-gaussian.webp)