ATLAS-CONF-2020-022 20July2020
ATLAS CONF Note
ATLAS-CONF-2020-022
20th July 2020
Measurement of the ATLAS Detector Jet Mass Response using Forward Folding with 80 fb − 1 of
√ 𝒔 = 13 TeV 𝒑 𝒑 data
The ATLAS Collaboration
This note reports a measurement of the jet mass response of large-radius jets reconstructed by the ATLAS experiment using 80 fb−1 of
√
𝑠 = 13 TeV 𝑝 𝑝 data. The response is defined as the distribution of the measured mass given the particle-level jet mass and is characterised by its central value (jet mass scale) and spread (jet mass resolution). In order to account for non-Gaussian behavior of the response as well as non-trivial contributions from the intrinsic particle-level jet mass probability density, the forward-folding method is chosen for the measurement. This procedure is applied to both a top-quark pair final state (200 GeV< 𝑝
T <600 GeV for𝑊boson jets and 350 GeV < 𝑝
T <1000 GeV for top-quark jets) as well as inclusive𝑊/𝑍+jets events (500 GeV< 𝑝
T <1200 GeV). Results are presented for trimmed anti-𝑘𝑡 𝑅 =1.0 jets built using only calorimeter information as well as for the track-assisted jet mass that combines calorimeter and tracker information, and for reclustered small-radius jets also using𝑅=1.0. This note extends previous results by including more data, incorporating the𝑊/𝑍+jets final state, and by comparing various jet mass definitions. In addition, the jet mass response is studied for different numbers of subjets within reclustered jets and found to be universal. For both the jet mass scale and jet mass resolution, good agreement is observed between the data and simulated samples. Uncertainties are evaluated to be 1–5% for the scale and 10–20% for the resolution and they are driven by the parton shower and hadronisation modelling.
©2020 CERN for the benefit of the ATLAS Collaboration.
Reproduction of this article or parts of it is allowed as specified in the CC-BY-4.0 license.
1 Introduction
Searches and measurements involving Lorentz boosted and hadronically decaying Standard Model (SM) or Beyond the SM (BSM) particles are an important component of the ATLAS physics program. When a particle of mass𝑚is boosted in the plane transverse to the collision axis with transverse momentum𝑝
T, then its decay products will mostly fall into a cone with angular size of 2𝑚/𝑝
T in the𝜂-𝜙plane1. The resulting hadronic jets formed from the fragmentation of high energy quarks and gluons into hadrons have a complex substructure that can be used to identify and study particular processes [1,2]. A jet substructure observable of great interest is thejet mass, which will be near𝑚if the jet catchment area is sufficiently large and the experimental measurement is sufficiently accurate and precise. This property of the jet mass has been used to improve measurements and searches involving𝑊/𝑍bosons [3–10], Higgs bosons [11–15], top quarks [16–23], as well as BSM resonances [24–29]. The jet mass has also been studied in the context of precision measurements of the strong force [30–32].
In order to interpret the results of an analysis using the jet mass, it is critical to determine the accuracy of the ATLAS detector simulation. The relevant quantity is the jet mass response,𝑝(𝑚
det|𝑚
truth), where𝑚
det
is the measured jet mass and𝑚
truthis the particle-level jet mass. A calibration procedure using simulation ensures thath𝑚
det|𝑚
truthiis close to𝑚
truthin simulation. The residual bias from differences between data and simulation can be applied as a correction [33]. Uncertainty on this correction and inaccuracies on other aspects of𝑝(𝑚
det|𝑚
truth)lead to systematic uncertainties for analyses using the jet mass.
Determining the mean (jet mass scale or JMS,𝑅𝑚) and standard deviation (jet mass resolution or JMR, 𝜎𝑚) of 𝑝(𝑚
det|𝑚
truth) is complicated by the fact that the particle-level mass spectrum is broad and not known analytically. This is in contrast to the calibration of electrons [34] or muons [35], for which resonances like the𝑍 boson, theΥ, or the𝐽/𝜓have a well-known line-shape. Standard Model resonances like the𝑊/𝑍 bosons and the top quark are also used for the jet mass calibration, but uncertainty in the modelling of the𝑚
truth differential cross-section must be taken into account. In the past, the jet mass scale has been determined by comparing the mass computed using tracks to the one computed using calorimeter measurements [33,36,37]. This𝑟
trackmethod cannot offer a precise determination of the jet mass resolution and is complicated to apply to jet mass definitions that also include information from the ATLAS tracker.
The method used in this note is called forward-folding. In this method, 𝑝(𝑚
det|𝑚
truth) is shifted and stretched with respect to the simulated jet mass response so that the observed𝑚
detdistribution agrees between data and simulation. The particle-level spectrum𝑝(𝑚
truth)uncertainty is evaluated by comparing the fitted response for a variety of models. The forward-folding technique was first introduced in Ref. [38]
which used the full Run 1 dataset. Since that time, the method has also been applied to𝑡𝑡¯events at
√ 𝑠=13 TeV using early Run 2 data [33,39]. This note extends the forward-folding method to use a larger dataset collected in 2015–2017 as well as extends it beyond𝑡𝑡¯proccess to include inclusive𝑊/𝑍+jets events. This additional event topology provides a source of isolated𝑊/𝑍boson jets at higher 𝑝
Tthan is accessible in top quark decays. In comparison to previous JMS/JMR measurements in𝑡𝑡¯events [33,39], the additional 44 fb−1of data used in this note makes it possible to perform a more detailed study of the JMS and JMR
𝑝T dependence.
1ATLAS uses a right-handed coordinate system with its origin at the nominal interaction point (IP) in the centre of the detector and the𝑧-axis along the beam pipe. The𝑥-axis points from the IP to the centre of the LHC ring, and the𝑦-axis points upwards. Cylindrical coordinates (𝑟 , 𝜙) are used in the transverse plane, 𝜙being the azimuthal angle around the𝑧-axis.
The pseudorapidity is defined in terms of the polar angle𝜃as𝜂=−ln tan(𝜃/2). Angular distance is measured in units of Δ𝑅≡p
(Δ𝜂)2+ (Δ𝜙)2.
This note is organised as follows. Section2briefly introduces the ATLAS detector and provides details of the simulations and data used for this study. The experimental objects used for the event selection and jet construction are described in Section3. Section4reviews the forward-folding method for determining the jet mass scale and resolution. The results in𝑡𝑡¯events and𝑊/𝑍+jets events are presented in Sections5 and6, respectively. The jet topology dependence in𝑡𝑡¯events is investigated in Section 7. The note ends with conclusions and an outlook in Section8.
2 Datasets
2.1 The ATLAS Detector
The ATLAS detector [40] comprises three main sub-detectors: an inner tracker which measures charged particles and covers the pseudorapidity range|𝜂| <2.5, a sampling calorimeter which measures the energy of electrons, photons and hadrons produced with|𝜂| <4.9 and a spectrometer spanning|𝜂|< 2.7 at large radius, which detects muons and measures their transverse momenta. The 40 MHz LHC collision rate is reduced to a 1 kHz rate of events written to storage with a multi-stage trigger system which consists of a hardware-based first-level trigger followed by a software-based high-level trigger [41].
Data from proton-proton (𝑝 𝑝) collisions produced by the LHC at a centre-of-mass energy of
√
𝑠 =13 TeV in the 2015, 2016 and 2017 data-taking periods have been used in this analysis. The dataset is selected to pass requirements based on beam and detector conditions, as well as data quality, and corresponds to an integrated luminosity of 80 fb−1[42].
2.2 Monte Carlo simulation
A number of different Monte Carlo (MC) generators are employed in the determination of the relative JMS and JMR and their uncertainties. The simulated detector response [43] is based on Geant 4 [44]. Inelastic 𝑝 𝑝 interactions are generated with Pythia 8 (v8.210) [45] and overlaid onto signal and background processes in order to simulate the effect of additional𝑝 𝑝collisions in the same and nearby beam bunch crossings (pile-up). Pile-up activity varies in the 2015, 2016 and 2017 data taking periods and is accounted for in the production and reconstruction of simulated events. Two sets of MC samples are used: one corresponds to the pile-up profile of 2015–2016 data, while a second independent set of samples corresponds to the profile of 2017 data.
Production of top quark pairs (𝑡𝑡¯) is simulated using the next-to-leading order (NLO) Powheg-Box (𝑣2) matrix-element (ME) event generator [46–48] using Pythia 8 (v8.210) for the parton shower (PS) and hadronisation. The value of the parameter controlling the damping of the real radiation in Powheg (hdamp) is set to 172.5 GeV. The NNPDF3.0 NLO PDF set [49] is used in the ME generation and the NNPDF2.3 LO PDF set [50] is used in the PS. Non-perturbative QCD effects are modelled using a set of tuned parameters called the A14 tune [51]. The EvtGen (1.2.0) program [52] is used for the properties of the bottom and charm hadron decays for all samples generated with Powheg-Box (𝑣2). The𝑡𝑡¯events are normalised to NNLO QCD predictions, including soft-gluon resummation to next-to-next-to-leading-log (NNLL) order [53].
Single top-quark production is simulated at NLO using the Powheg-Box (𝑣2) ME event generator with CT10 as the PDF. It is interfaced to Pythia 6 (v6.428) [54] for the parton shower, hadronisation and
underlying event with the CTEQ6L1 [55] NLO PDF set, and a set of tuned parameters called the Perugia 2012 tune [56]. Single top-quark events are normalised to NLO QCD calculations [57].
Associated production of a heavy vector boson with jets is simulated using Sherpa 2.1.1 [58] with the CT10 [59] set of parton distribution functions (PDF). Only final states where the𝑊/𝑍 bosons decay hadronically are considered. The production of two massive vector bosons (diboson) is simulated using Sherpa 2.2.1 [60], with the NNPDF3.0 NNLO PDF. The single boson and diboson events are normalised to their respective theoretical cross sections [61,62].
The dominant process at the LHC consists of high-𝑝
Tmultijets initiated by light quarks and gluons. This contribution is simulated using the Pythia 8 (v8.186) [63] generator interfaced to the A14 [51] tune and the NNPDF2.3LO PDF set.
Alternative Monte Carlo samples are used to evaluate the modelling uncertainties of the signal and background samples.
For studies carried out in the𝑡𝑡¯event topology, alternative MC𝑡𝑡¯predictions are compared to the ones obtained from the nominal𝑡𝑡¯MC, in order to investigate the effects of the modelling of the initial- and final-state radiation, of the ME calculation and of the showering and hadronisation. A Powheg+Pythia8 prediction is employed with the renormalisation and factorisation scales varied by a factor of 2, using the low radiation variation of the A14 tune [51] and an hdamp value of 1.5×𝑚𝑡. These variations are used to estimate uncertainties associated to the parton shower radiation. An alternative sample is generated with MadGraph5_aMC@NLO (v2.2.1) [64], interfaced to Pythia8, which is employed in the estimation of the uncertainty related to the choice of the ME generator. The uncertainty due to the choice of parton shower algorithm and hadronisation model is evaluated using a sample generated using Powheg-Box (𝑣2) interfaced to Herwig (v2.7.1) [65,66].
For the measurements performed in the𝑊/𝑍+jets enhanced event topology, an alternative𝑊+jets sample has been used to estimate uncertainties on the modelling of the𝑊+jets signal. This alternative signal sample is simulated using the Herwig++ (v2.7.1) [67] generator with the CTEQ6L1 PDF set [55] for the Matrix Element and the parton shower. For the estimation of uncertainties on the modelling of the multijets background, alternative dijet background samples have been simulated using exactly the same setup as the nominal𝑊/𝑍+jets samples (Sherpa 2.1.1).
3 Object definitions
Primary objects such as jets and leptons are used in this analysis at two different scales using different sets of inputs: the energy deposits in the detector (detector-level objects) and stable particles, as defined in the MC simulations, before their interaction with the detector (particle-level objects). In this analysis only muons and jets are used directly for the event selection.
3.1 Detector-level object definitions
Muons are reconstructed using information from both the inner detector and the muon spectrometer. Muon candidates are selected to have|𝜂| < 2.5 and to pass tight track-quality requirements [68]. To suppress pile-up contamination, muons are selected to have a trajectory consistent with the primary vertex, defined as the reconstructed vertex with at least two associated tracks and the largest sum of squared track momentum.
This is ensured by requiring muons with |𝑑
0/𝜎(𝑑
0) | < 3 and|𝑧
0sin𝜃| < 0.5 mm, where 𝑑
0 and 𝑧
0 are respectively the transverse and longitudinal impact parameters with respect to the primary vertex2. Isolated muons must have the calorimeter cluster energy within a cone ofΔ𝑅< 0.2 be less than 30% of the muon 𝑝Tand the summed transverse momenta of additional tracks compatible with the primary vertex within a cone ofΔ𝑅< 0.3 be less than 15% of the muon 𝑝
T[68].
Small-radius (small-𝑅) jets are reconstructed using the anti-𝑘𝑡jet algorithm [69] with the radius parameter 𝑅 = 0.4 implemented in FastJet (v3.2.2) [70]. The objects used as inputs to the jet reconstruction are a set of four-momenta obtained from an algorithmic combination of measurements of both the tracker and calorimeter. Calorimeter cells are clustered into three-dimensional, massless, topological clusters (topo-clusters) [71] and their momenta, initially defined as pointing to the geometrical centre of the ATLAS detector, are adjusted to point towards the hard scatter primary vertex of the event [72]. The tracker and calorimeter information is combined through the particle flow algorithm [73]: when the tracker has better resolution than the calorimeter, the energy of a topocluster in the calorimeter which is associated to charged particles is replaced by the momenta of the tracks which are reconstructed in the inner detector using a sequence of algorithms [72] and associated to that same topocluster.
To suppress contamination from pile-up, small-𝑅jets with 𝑝
T <60 GeV must pass a requirement on the Jet Vertex Tagger (JVT) [74] discriminant. To avoid labelling the same detector signature as more than one object, an overlap removal procedure is applied [75]. Jets close to electrons, withΔ𝑅(𝑒,jet𝑅=0.4) < 0.4, are corrected by subtracting the electron four momentum from the jet four momentum. The new𝑒-subtracted jet is retained if it satisfies the jet selection criteria listed above, otherwise it is rejected. After this procedure, electrons that lie withinΔ𝑅(𝑒,jet𝑅=0.4)=0.2 from a small-𝑅jet are removed and their four-momentum is added back to that of the jet, and muons that fall inside a cone of sizeΔ𝑅(𝜇,jet𝑅=0.4) <0.04+10 GeV/𝑝
T𝜇
around a small-𝑅jet axis are removed.
The energy and direction of small-𝑅jets are calibrated using an energy- and𝜂- dependent simulation-based calibration scheme with in-situ corrections based on data [76]. Such jets are accepted if they have 𝑝T> 25 GeV and|𝜂| < 2.5. Small-𝑅jets are identified as originating from𝑏-hadrons with the multivariate 𝑏-tagging algorithm MV2c10, using observables sensitive to the lifetimes, production mechanisms, and decay properties of𝑏-hadrons [77]. In this analysis the MV2c10 algorithm output threshold is set such that a 70%𝑏-jet selection efficiency is achieved in simulated𝑡𝑡¯events. The corresponding rejection factors for 𝑐and light jets are 22 and 1200, respectively.
The missing transverse momentum, 𝑝®miss
T , is reconstructed from the negative vector sum of the transverse momenta of reconstructed electrons, muons, photons, jets, and a soft term built from high-quality tracks that are associated with the primary vertex, but not with the physics objects. Converted photons and hadronically decaying𝜏leptons are not explicitly included, but enter either as jets, electrons, or via the soft term. The magnitude of the missing transverse momentum, labelled as𝐸miss
T , is used to define some selection criteria [78,79].
The goal of this analysis is to measure the data-to-MC relative mass response of jets with radius𝑅=1.0 (large-𝑅jets). Two large-𝑅jet collections are used to study the detector response to three different large-𝑅 jet mass definitions.
2𝑑
0 is defined as the distance between the beam-line and the closest point of the ID track associated to the muon, while𝑧
0
corresponds to the distance between that point and the primary vertex, projected along the𝑧-axis. The uncertainty associated to the𝑑
0parameter is defined as𝜎(𝑑
0).
A first jet collection is obtained using the same clustering algorithm as for the small-radius jets, but using a radius parameter of𝑅 =1.0. In contrast to the small-radius jets, the inputs to the clustering are calorimeter topoclusters that are calibrated to correct for scale differences between energy deposits from electromagnetic particles (electrons and photons) and hadrons by the Local Cell Weighting (LCW) scheme [71], and are defined to be massless. To mitigate the effects of pile-up, soft emissions and the underlying event, a grooming algorithm known as “trimming” is applied to the jets [80]. Trimming recombines the jet constituents of each𝑅=1.0 jet into𝑅
sub=0.2 subjets using the𝑘𝑡 algorithm, producing a collection of subjets for each jet. Subjets with 𝑓
cut=𝑝subjet
T /𝑝jet
T < 0.05 and their associated constituents are removed from the large-𝑅jet and the jet four momentum is recalculated from the remaining constituents. The large-𝑅jets described above are referred to as trimmed jets in the following.
Other large-𝑅jets considered in this study are the reclustered jets [81,82], which are obtained by clustering small-𝑅jets together into large-𝑅jets of radius𝑅=1.0. To form these jets, the anti-𝑘𝑡algorithm with radius parameter𝑅=1.0 is run, taking as inputs all of the fully calibrated small radius jets defined above. No trimming procedure is applied to reclustered jets, since pile-up contamination is already suppressed at the constituent level by the JVT requirement on the small-𝑅jets, as well as during their energy calibration.
The𝑝
T calibration for small-radius jets depends on the number of tracks inside the jet as well as the jet width3, among other jet features. This calibration is applied multiplicatively to the jet four momentum and therefore also applies to the mass, though the mass is not a target of the calibration and no subsequent mass corrections are applied. For small-𝑅jets in data an additional correction is applied based on in-situ measurements of the 𝑝
T scale [83]. The 𝑝
T calibration for large-radius trimmed jets does not depend on any features of the jet substructure, but the mass is explicitly calibrated using 𝑝
T-, log(𝑚/𝐸)- and
|𝜂|-dependent correction factors. The full four momentum of large-𝑅jets in data is also corrected based on in-situ measurements of the large-𝑅jet 𝑝
Tscale [84]. The in-situ correction is applied to the full four momentum such that it also alters the mass. Only large-𝑅trimmed jets with𝑝
T >200 GeV and|𝜂
det|< 24 are considered, which is the phase space where the large-𝑅jet energy calibration has been optimised.
In this analysis the relative mass response is measured for the mass of reclustered jets (reclusteredmass, 𝑚RC) and for two trimmed jet mass definitions: the jet mass reconstructed from the topoclusters(𝑚
calo) and the track-assisted jet mass [39]
𝑚TA = 𝑝calo
T
𝑝track T
×𝑚track, (1)
which takes advantage of tracks associated to the jet via ghost association [85].
The track-assisted mass is expected to have a better resolution than the calorimeter mass at very high𝑝
Tand can be combined with𝑚
caloto improve the trimmed jet mass resolution [39]. The mass of reclustered jets benefits from the precise energy and𝑝
Tcalibrations, as well as pile-up robustness of the small-𝑅jets used as inputs for the jet clustering, and is expected to have a good mass resolution. It is also used to test the relevance of close-by effects to the jet mass response [82].
3.2 Particle-level object definitions
Particle-level objects are reconstructed using only MC generator event information, i.e. no detector simulation is applied. Only particles from the MC record with a lifetime equivalent of𝑐𝜏 >10 mm are
3The jet width is a variable that characterises the energy spread within a jet.
4The pseudorapidity of the jet based on the detector geometry.
considered at particle level. Furthermore, particle-level objects are required to be from the hard-scatter event, excluding particles from pile-up collisions.
Bare charged leptons, such as muons, are requested to not originate from hadron decays, either directly or from subsequent𝜏decays. The four-momenta of the bare leptons are then modified (dressed) by adding the four-momenta of all photons within a cone of sizeΔ𝑅 =0.1 to take into account final-state photon radiation.
All stable particles are considered for the jet clustering, except for muons and neutrinos. The same algorithms used at detector level are used in the jet clustering procedure. Small-𝑅jets are defined with the anti-𝑘𝑡algorithm with a radius parameter of𝑅=0.4. Only small-𝑅jets with𝑝
T >25 GeV and|𝜂| < 2.5 are considered. An overlap removal procedure is applied to particle-level objects as well, to ensure that leptons and jets are defined as separate objects and to avoid double counting of particles: small-𝑅jets which are found to have a muon within their jet cone are removed.
Large-𝑅trimmed particle-level jets are also defined with the anti-𝑘𝑡 algorithm, but with radius𝑅=1.0 and with trimming applied as described in Section3.1. Particle-level large-𝑅reclustered jets are built with the same clustering technique explained in Section3.1, but by taking as inputs all the possible particle-level small-𝑅jets with𝑝
T >25 GeV instead.
4 The forward-folding method
The distribution of the jet mass 𝑚
det in boosted top quark events has peaks around the𝑊-boson and top-quark physical masses. One may be tempted to compare the𝑊-boson or top quark jet mass peak positions and widths between data and simulation to determine the jet mass scale and resolution. However, physics effects like fragmentation have a significant contribution to both the resonance peak position and width, and so a direct comparison is not accurate. Instead, the contributions to the resonance structures from non-detector effects must be removed. Alternatively, one can add detector-effects to the particle-level spectrum byforward-folding[38]. For 0≤ (𝑟 , 𝑠) ≤ ∞, define the forward-folded mass𝑚
foldas follows:
𝑚fold=𝑠 𝑚
det+ (𝑚
det− h𝑚
det|𝑚
truthi) (𝑟 −𝑠). (2)
One can show that the jet mass scale and resolution of𝑚
foldare 𝑠and𝑟 times the scale and resolution of𝑚
det, respectively. The variable𝑠 is called the relative jet mass scale and𝑟 denotes the relative jet mass resolution. Note that if𝑟 < 1 in Eq.2, then the resolution of 𝑚
foldwill be smaller than that of 𝑚det. Furthermore, in Eq.2there is no assumption that the response distribution is Gaussian – rather the initial shape is taken from simulation, thus including any tails in the simulated response function. The average massh𝑚
det|𝑚
truthi in Eq.2is derived from the simulations discussed in previous sections: for measurements carried out in the𝑡𝑡¯event topology, the average mass is obtained from𝑡𝑡¯MC simulation, while for measurements carried out in𝑊/𝑍+jets events, the𝑊/𝑍+jets MC simulations are used. Examples of the average mass response from𝑡𝑡¯events are shown in Fig.1. The jets entering this plot are calibrated, so the average mass response is expected to be near unity. Some non-closure is observed during the calibration procedure near extreme kinematic regions and in regions where the simulated jet mass response is not Gaussian.
The forward-folding operation specified by Eq.2has the effect of shifting and stretching the response.
Values of𝑟 and𝑠are determined from data by matching𝑚
foldto the observed𝑚
detin data using a 𝜒2fit:
(𝑟 , 𝑠) =arg min
𝑟0, 𝑠0 𝑛bins
Õ
𝑖=1
ℎsim
𝑖 (𝑟0, 𝑠0) −ℎdata
𝑖
𝜎𝑖
!2
, (3)
whereℎsim
𝑖 andℎdata
𝑖 represent the𝑖th
bin of the𝑚
foldhistogram in simulation and the𝑚
detdistribution in data, respectively. Each histogram has𝑛
bins, with different ranges and binning for the𝑡𝑡¯and𝑊/𝑍+jets fits. The uncertainty𝜎𝑖only includes data and MC statistical uncertainties. Nuisance parameters are not profiled; the fit given by Eq.3is repeated for each source of systematic uncertainty. Fits were repeated using average mass responses computed from𝑡𝑡¯,𝑊/𝑍+jets and dijet MC samples: switching between average responses computed with different MC simulations was found to have a negligible impact on the determined values of𝑟and𝑠.
Implicit in Eq.3is the prior distribution 𝑝(𝑚
truth), which is a source of uncertainty. The fit is repeated with variations in the modelling of𝑡𝑡¯and𝑊+jets production and decay, and the spreads in𝑠and𝑟 are assigned as systematic uncertainties. This is described in more detail in subsequent sections.
0.6 0.7 0.8 0.9 1 1.1 1.2 1.3 1.4
Average Jet Mass Response
200 400 600 800 1000
[GeV]
pT
Detector-Level Jet 50
100 150 200 250 300
Particle-Level Jet Mass [GeV]
ATLAS Simulation Preliminary
= 13 TeV s
| < 2.0 ηdet
+jets, |
→µ t t
=1.0 (LCW+JES+JMS) R
Trimmed Calorimeter mass
(a)
0.6 0.7 0.8 0.9 1 1.1 1.2 1.3 1.4
Average Jet Mass Response
200 400 600 800 1000
[GeV]
pT
Detector-Level Jet 50
100 150 200 250 300
Particle-Level Jet Mass [GeV]
ATLAS Simulation Preliminary
= 13 TeV s
| < 2.0 ηdet
+jets, | µ
→ t t
=1.0 (LCW+JES+JMS) R
Trimmed Track-assisted mass
(b)
0.6 0.7 0.8 0.9 1 1.1 1.2 1.3 1.4
Average Jet Mass Response
200 400 600 800 1000
[GeV]
pT
Detector-Level Jet 50
100 150 200 250 300
Particle-Level Jet Mass [GeV]
ATLAS Simulation Preliminary
= 13 TeV s
| < 2.0 ηdet
+jets, | µ
→ t t
=1.0 (PFlow+JES+JMS) R
Reclustered
(c)
Figure 1: The average response matrices for trimmed jets (a)𝑚calo, (b)𝑚TAand for (c) the reclustered jet mass. The average responses reported are extracted from𝑡𝑡¯MC simulation.
5 Jet mass response measurement in 𝒕 𝒕 ¯ events
The relative JMS and JMR of large-𝑅jets are extracted with the forward folding technique from𝑡𝑡¯events in the 𝜇+jets channel, where the large-𝑅 jets contain fully or partially the hadronic decay products of top-quarks. This approach was used in the past to measure the relative jet mass scale and resolution of trimmed and reclustered jets, using 36 fb−1of data [82, 86]. In this section new improved results are obtained, taking advantage of a much larger dataset corresponding to 80 fb−1. Such a dataset allows for the measurement of the jet mass responses over an extended𝑝
Trange and in finer𝑝
Tbins.
Mass distributions for data and MC simulations are built from the selected events. The relative JMS and JMR are extracted via a fit of the reconstructed distributions to templates generated with the forward folding transformation of Sec.4. A𝜒2minimisation procedure is performed to extract the central values of the JMS and JMR parameters. Statistical uncertainties on the measurement are evaluated by repeating the procedure with pseudo-experiments. The fit is repeated for mass distributions obtained using different MC simulations, as well as for varied jet energy responses and event selection requirements. Differences between the obtained values of the JMS and JMR and the nominal MC result are taken to estimate the systematic uncertainties on the measurement. Systematic uncertainties obtained from two-point comparisons are symmetrised. The total uncertainty is obtained by summing in quadrature all the contributions from single uncertainty sources.
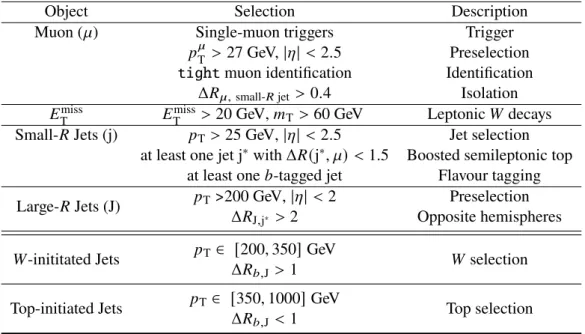
Table 1: Summary of the event selection for the top quark events in the𝜇+jets channel. Additional selections discriminate between events with jets originating from𝑊 bosons (W-initiated) or top quarks (top-initiated).
Object Selection Description
Muon (𝜇) Single-muon triggers Trigger
𝑝
𝜇 T
>27 GeV,|𝜂| < 2.5 Preselection tightmuon identification Identification
Δ𝑅𝜇 ,
small-𝑅jet >0.4 Isolation
𝐸miss
T 𝐸miss
T >20 GeV,𝑚
T >60 GeV Leptonic𝑊 decays Small-𝑅Jets (j) 𝑝
T >25 GeV,|𝜂| <2.5 Jet selection at least one jet j∗withΔ𝑅(j∗, 𝜇) <1.5 Boosted semileptonic top
at least one𝑏-tagged jet Flavour tagging Large-𝑅Jets (J)
𝑝T>200 GeV,|𝜂| <2 Preselection Δ𝑅
J,j∗ >2 Opposite hemispheres 𝑊-inititated Jets
𝑝T∈ [Δ200𝑅𝑏 ,,350] GeV 𝑊selection
J> 1 Top-initiated Jets
𝑝T∈ [350,1000] GeV
Top selection Δ𝑅𝑏 ,
J< 1
The event selection used follows closely the standard ATLAS search for𝑡𝑡¯resonances [75], which was also employed in the previous iteration of this measurement [86], and is summarised in Table1. An isolated, high-𝑝
T central muon, along with a significant missing transverse momentum, are required to identify semileptonically decaying top-quarks. Single-muon triggers requiring an isolated energy deposit in the muon spectrometer greater than 26 GeV are used to reject most of the events from QCD multijet background processes. Muons with 𝑝
T > 27 GeV and |𝜂| < 2.5 which satisfytightquality criteria [68] and are separated from small-𝑅jets byΔ𝑅 >0.4 are considered. To enhance the selection
of events where the muon and 𝐸miss
T originate from a 𝑊 boson the transverse mass 𝑚
T, defined as 𝑚T =q
2𝑝
𝜇 T𝐸miss
T (1−cos(Δ𝜙
𝜇 , 𝐸miss T
)) 5, is required to be greater than 60 GeV and𝐸miss
T > 20 GeV. One small-𝑅jet is required to satisfy an angular distance to the muonΔ𝑅(𝑗 , 𝜇) <1.5, in order to identify the jet from the semileptonic top-quark decay. Events with at least one𝑏-tagged jet are required to further enhance the𝑡𝑡¯signal over other background processes. Finally, at least one large-𝑅jet with a transverse momentum greater than 200 GeV is required to exist and to lie in the opposite hemisphere of the jet from the semileptonic top-quark decay.
Two sub-samples are defined based on the angular separation of the closest𝑏-tagged small-𝑅jet to the large-𝑅jet. If the distance between them is smaller than one, the event is categorised as a top-initiated jet.
Instead, if the distance is larger than one, the event is classified as a𝑊-initiated jet. This selection has the advantage of increasing the purity of the𝑊and top-quark signals over the background, enhancing the to-be-fitted mass peaks, and reducing the impact of misclassified jets.
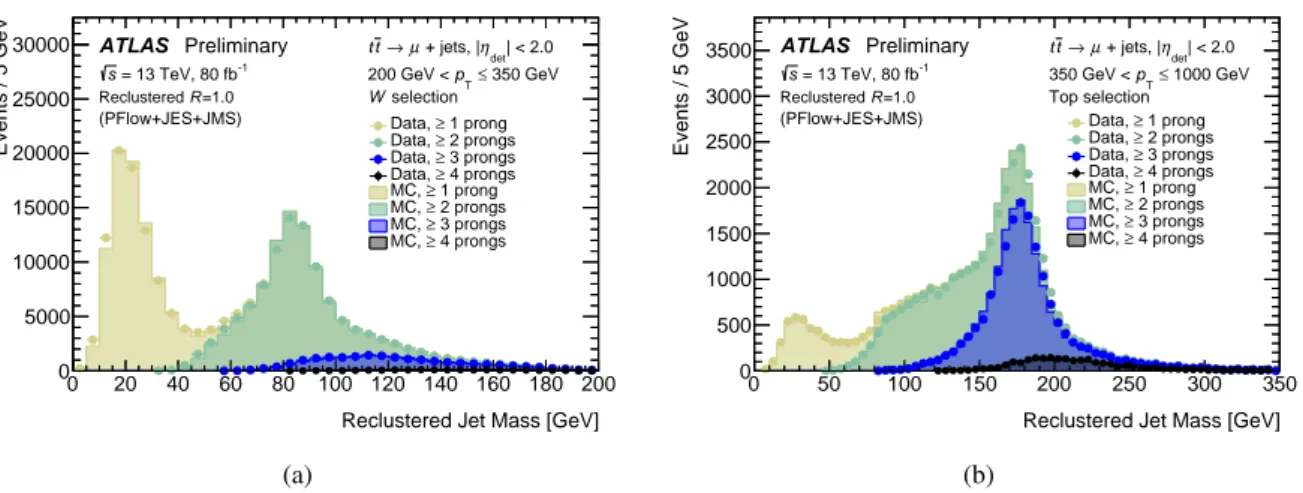
Examples of mass distributions for the various definitions are presented in Fig.2.
5𝜙
𝜇 , 𝐸miss
T is the azimuthal angle between the charged muon and the direction of the missing transverse momentum.
0 5000 10000 15000 20000
Events / 5 GeV
ATLAS Preliminary = 13 TeV, 80 fb-1
s
=1.0 R Trimmed (LCW+JES+JMS)
| < 2.0 ηdet
+ jets, | µ
→ t t
350 GeV
T≤ p 200 GeV <
selection W
Data t t Single top W+jets Other MC syst. error
0 20 40 60 80 100 120 140 160 180 200
Calorimeter Jet Mass [GeV]
0.5 1 1.5 2
Data / MC
(a)
0 500 1000 1500 2000
Events / 5 GeV
ATLAS Preliminary = 13 TeV, 80 fb-1
s
=1.0 R Trimmed (LCW+JES+JMS)
| < 2.0 ηdet
+ jets, | µ
→ t t
1000 GeV
T≤ p 350 GeV <
Top selection Data
t t Single top W+jets Other MC syst. error
0 50 100 150 200 250 300 350
Calorimeter Jet Mass [GeV]
0.5 1 1.5 2
Data / MC
(b)
0 5000 10000 15000 20000
Events / 5 GeV
ATLAS Preliminary = 13 TeV, 80 fb-1
s
=1.0 R Trimmed (LCW+JES+JMS)
| < 2.0 ηdet
+ jets, | µ
→ t t
350 GeV
T≤ p 200 GeV <
selection W
Data t t Single top W+jets Other MC syst. error
0 20 40 60 80 100 120 140 160 180 200
Track-Assisted Jet Mass [GeV]
0.5 1 1.5 2
Data / MC
(c)
0 500 1000 1500
Events / 5 GeV
ATLAS Preliminary = 13 TeV, 80 fb-1
s
=1.0 R Trimmed (LCW+JES+JMS)
| < 2.0 ηdet
+ jets, | µ
→ t t
1000 GeV
T≤ p 350 GeV <
Top selection Data
t t Single top W+jets Other MC syst. error
0 50 100 150 200 250 300 350
Track-Assisted Jet Mass [GeV]
0.5 1 1.5 2
Data / MC
(d)
0 10000 20000 30000
Events / 5 GeV
ATLAS Preliminary = 13 TeV, 80 fb-1
s
=1.0 R Reclustered (PFlow+JES+JMS)
| < 2.0 ηdet
+ jets, | µ t→ t
350 GeV
T≤ p 200 GeV <
selection W
Data t t Single top W+jets Other MC syst. error
0 20 40 60 80 100 120 140 160 180 200
Reclustered Jet Mass [GeV]
0.5 1 1.5 2
Data / MC
(e)
0 1000 2000 3000
Events / 5 GeV
ATLAS Preliminary = 13 TeV, 80 fb-1
s
=1.0 R Reclustered (PFlow+JES+JMS)
| < 2.0 ηdet
+ jets, | µ t→ t
1000 GeV
T≤ p 350 GeV <
Top selection Data
t t Single top W+jets Other MC syst. error
0 50 100 150 200 250 300 350
Reclustered Jet Mass [GeV]
0.5 1 1.5 2
Data / MC
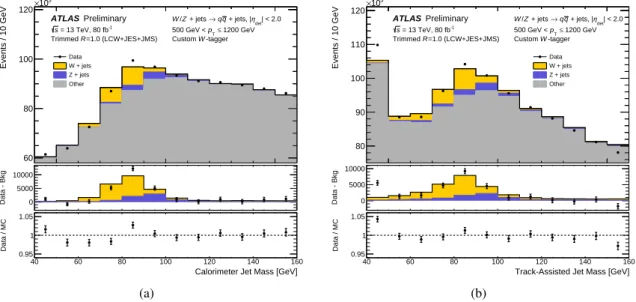
(f) Figure 2: The (a,b) trimmed jet𝑚
calo, (c,d) trimmed jet𝑚
TAand (e,f) reclustered jet mass distributions obtained from events passing the (left)𝑊 selection and (right) top-quark selection in the𝑡𝑡¯event topology. The "Other"
category refers to diboson and𝑍+jets events.
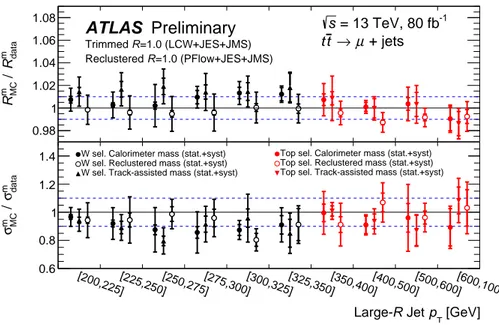
The forward-folding method is used to extract the data-to-MC relative jet mass scale and resolution in various bins of 𝑝
T. The template fit explained in Section4 is performed in the jet mass window 50 GeV < 𝑚
jet<120 GeV when the𝑊selection is applied, and in the range 120 GeV < 𝑚
jet < 300 GeV for the top-quark selection. The results obtained are summarised in Fig.3. As can be observed, the relative JMS and JMR are found to be compatible with one and roughly constant accross the𝑝
Trange within the statistical and systematic uncertainties. The relative JMS and JMR measured for reclustered jets are in general closer to unity than the ones measured for trimmed jets. This is a consequence of the modelling of the detector response to small-𝑅jets which is typically more accurate than the one of large-𝑅trimmed jets in this kinematic regime.
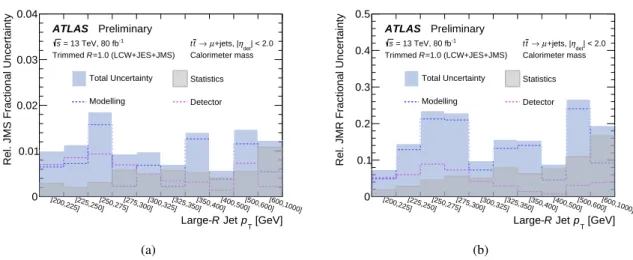
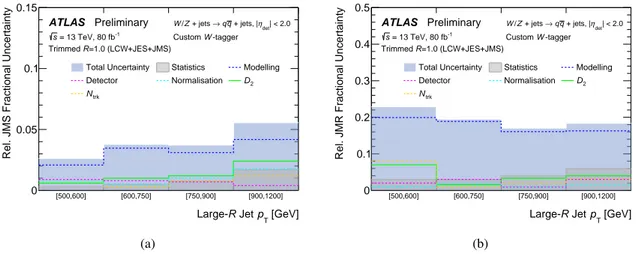
Systematic uncertainties account for potential bias in the modelling of the detector response and the physical processes involved, as was reported in Ref. [86]. The total uncertainty is the result of adding in quadrature statistical and systematic errors. An illustrative example for𝑚
calois presented in Fig.4for each of the𝑝
Twindows, where the total uncertainty is decomposed into several sources. The leading source of uncertainty in most regions is coming from the MC modelling. In particular, the component that is found to have the largest impact on the measurement is the one related to the showering and hadronisation, which is obtained from a comparison of Powheg +Pythia 8 and Powheg +Herwig𝑡𝑡¯MC simulations.
[200,225] [225,250] [250,275] [275,300] [300,325] [325,350] [350,400] [400,500] [500,600] [600,1000]
0.98 1 1.02 1.04 1.06 1.08
m dataR / m MCR
ATLAS Preliminary s = 13 TeV, 80 fb-1 + jets µ
→ t
=1.0 (LCW+JES+JMS) t
R Trimmed
=1.0 (PFlow+JES+JMS) R
Reclustered
[200,225][225,250][250,275][275,300][300,325][325,350][350,400][400,500][500,600][600,1000]
[GeV]
pT
Jet R Large- 0.6
0.8 1 1.2 1.4
m dataσ / m MCσ
W sel. Calorimeter mass (stat.+syst) W sel. Reclustered mass (stat.+syst) W sel. Track-assisted mass (stat.+syst)
Top sel. Calorimeter mass (stat.+syst) Top sel. Reclustered mass (stat.+syst) Top sel. Track-assisted mass (stat.+syst)
Figure 3: The relative JMS and the relative JMR measured in𝑡𝑡¯events for the𝑊 selection (black points) and the top selection (red points) for the calorimeter jet mass (filled dots), track-assisted jet mass (filled triangles) and reclustered jet mass (empty dots). Error bars represent the statistical uncertainty (inner bars) and the total uncertainty (outer bars). Dashed blue lines are used to represent 1% (10%) variations in the relative JMS (JMR).
[200,225][225,250][250,275][275,300][300,325][325,350][350,400][400,500][500,600][600,1000]
[GeV]
pT
Jet R Large- 0
0.01 0.02 0.03 0.04
Rel. JMS Fractional Uncertainty
Total Uncertainty Statistics
Modelling Detector
ATLAS Preliminary = 13 TeV, 80 fb-1
s | < 2.0
ηdet
+jets, | µ
→ t t
=1.0 (LCW+JES+JMS) R
Trimmed Calorimeter mass
(a)
[200,225][225,250][250,275][275,300][300,325][325,350][350,400][400,500][500,600][600,1000]
[GeV]
pT
Jet R Large- 0
0.1 0.2 0.3 0.4 0.5
Rel. JMR Fractional Uncertainty
Total Uncertainty Statistics
Modelling Detector
ATLAS Preliminary = 13 TeV, 80 fb-1
s | < 2.0
ηdet
+jets, | µ
→ t t
=1.0 (LCW+JES+JMS) R
Trimmed Calorimeter mass
(b)
Figure 4: Breakdown of the total uncertainty associated with the (a) relative JMS and (b) relative JMR for trimmed jets 𝑚calo, extracted via the forward folding method as applied in𝑡𝑡¯events. Similar trends are observed for trimmed jets 𝑚TAand reclustered jet mass. The modelling uncertainty is derived as the sum in quadrature of the matrix-element, fragmentation and initial- and final-state radiation components. The estimation of the MC modelling uncertainties is limited in accuracy by the statistics available in the MC samples used.
The absolute mass resolution is measured in data for the trimmed𝑚
calo,𝑚
TAand reclustered jet mass utilizing the relative JMS and JMR measured with the forward folding method. This measurement is performed for the large-𝑅jets which pass the selection of Table1.
Firstly, the absolute resolution in the MC simulations is determined from the mass response (=𝑚
det/𝑚
truth) distribution. The resolution is quantified by the 68% inter-quantile range (IQR68, 84thpercentile - 16th percentile), as well as the half-width𝜎gauss
fit of a Gaussian fit to the core of the response distribution6. Secondly, the absolute resolution in data is obtained by multiplying the absolute mass resolution from MC simulation with the relative (data/MC) JMR measured with the forward folding method in data.
Figures5(a)and5(b)show the MC response for trimmed𝑚
calofor the𝑊boson and top-quark selections defined in Table1. The standard deviation of the gaussian fit,𝜎gauss
fit , can be directly compared to half of the IQR68 interval and differences between the two are caused by the tails in the MC-response distribution.
Tails are not properly described by the gaussian fit, which underestimates the resolution of the distribution.
The simulated mass resolution of jets in the𝑊boson selection is seen to be significantly larger than that for jets passing the top-quark requirements, as can be seen from the IQR68 values associated to the respective jet mass responses. This is due to the definition of the𝑊boson selection: the high-response tail is caused by contamination in the large-𝑅jet from energy originating from the𝑏-hadron from the top decay, while the low-response tail is caused by leakage of energy from the𝑊decay products outside the𝑅=1.0 jet cone.
As a result the low and high tails are lifted. This effect is sensitive to the details of the event selection.
An alternative 𝑡𝑡¯sample (Powheg +Herwig) has been considered to quantify the dependence of the simulated mass resolution on the particle-level mass distribution. Differences of.2% in the𝑊 selection and . 1% in the top-quark selection were found. Such differences are negligible compared to the uncertainties associated with the forward folding measurements of the relative JMR, and are hence not added as additional uncertainties to the final result.
6The Gaussian fit is performed in a𝑥-axis range covering one standard deviation of the histogram, centred around the histogram mean value.
0 0.5 1 1.5 2
truth
m
reco / m Jet R Large- 0
1000 2000 3000 4000
Events
ATLAS Simulation Preliminary = 13 TeV
s
=1.0 (LCW+JES+JMS) R
Trimmed Calorimeter mass
| < 2.0 ηdet
+ jets, | µ
→ t t
250 GeV
T≤ p 225 GeV <
selection W
IQR68 = 0.43 = 0.29
gauss
σfit
× 2
(a)
0 0.5 1 1.5 2
truth
m
reco / m Jet R Large- 0
1000 2000
Events
ATLAS Simulation Preliminary = 13 TeV
s
=1.0 (LCW+JES+JMS) R
Trimmed Calorimeter mass
| < 2.0 ηdet
+ jets, | µ
→ t t
500 GeV
T≤ p 400 GeV <
Top selection
IQR68 = 0.20 = 0.16
gauss
σfit
× 2
(b) Figure 5: Comparison of the MC-response of𝑚
calofor trimmed jets from (a) the𝑊 selection and (b) the top-quark selection in𝑡𝑡¯events with two statistical estimators: full-width IQR68 is represented by blue vertical dashed lines, while the red line represents a Gaussian fit to the core of the distribution with standard deviation𝜎gauss
fit . The numerical values of IQR68 and𝜎gauss
fit for each MC-response are reported in the plots.
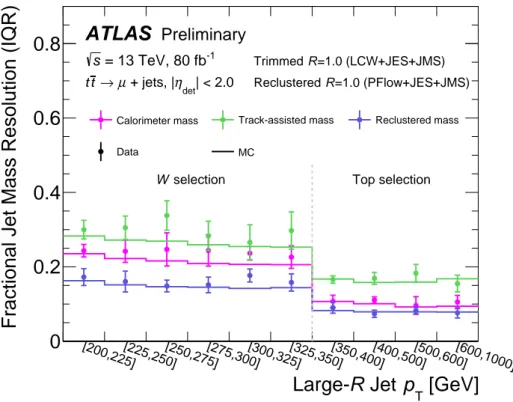
The fractional jet mass resolution, defined as the half of the IQR68 divided by the median of the mass distribution, of data and MC are reported in Fig.6. A larger fractional JMR is found for 𝑝jet
T
<
350 GeV where the𝑊 selection is used, as already explained. The absolute JMR drops considerably from 𝑝jet
T =350 GeV onwards and is found to be consistent with past studies comparing different large-𝑅jets definitions [87]. The track-assisted mass shows the worst performance with a fractional JMR roughly twice as large as those extracted from the trimmed𝑚
caloand reclustered jet mass. This is expected given the width of the mass distributions in Fig.2and is a consequence of the better resolution of the calorimeter than the tracker for the𝑝
T ranges studied [39]. Reclustered jets are found to have the best performance over the entire𝑝jet
T range for both data and MC. Moreover, the fractional JMR in data follows closely the MC, and differences are always covered by the total associated uncertainty (statistical and systematic). This is a consequence of the relative JMR measured with forward folding being compatible with one, within the uncertainty, in most𝑝
Tbins
[200,225][225,250][250,275][275,300][300,325][325,350][350,400][400,500][500,600][600,1000]
[GeV]
p
TJet R Large- 0
0.2 0.4 0.6 0.8
Fractional Jet Mass Resolution (IQR)
Calorimeter mass Track-assisted mass Reclustered mass
Data MC
ATLAS
Preliminary= 13 TeV, 80 fb-1
s
| < 2.0 ηdet
+ jets, | µ
→ t t
=1.0 (LCW+JES+JMS) R
Trimmed
=1.0 (PFlow+JES+JMS) R
Reclustered
selection
W Top selection
Figure 6: Fractional jet mass resolution in data (points) and MC (solid lines) for the three jet mass definitions considered here: calorimeter (magenta), track-assisted (green) and reclustered (violet) jet mass. The error bars on the data points represent the total uncertainty, propagated from the measurements of the relative JMR.
6 Jet mass response measurement in 𝑾/ 𝒁+jets events
The in-situ jet mass response is extracted for the first time using the forward folding method in the𝑊/𝑍+ jets event topology, where the large-𝑅 jet mass distribution peaks around the𝑊 and 𝑍 masses. The advantage of studying such an event topology is that vector bosons with higher momentum than those produced in𝑡𝑡¯events can be selected, making it possible to measure the JMS and JMR in a higher 𝑝
T
regime.
The strategy follows the method outlined in Sec.5, with the difference that the measurement is performed in a phase space where the𝑊/𝑍+jets event topology is enhanced. The𝜒2minimisation procedure is always performed in the 50 GeV< 𝑚
jet < 120 GeV mass window. Final states where the vector bosons decay hadronically are studied, which makes it necessary to develop a dedicated event selection to enhance the relatively small𝑊/𝑍+jets signal over the dominant multijet background. Such selections are commonly used for trimmed jets, and thus the trimmed jet𝑚
calo and 𝑚
TA are measured. Reclustered jets have a coarser jet substructure, given that they are build from𝑅=0.4 constituents, which makes it difficult to use substructure-based selections. Thus the reclustered jet mass is not measured in this context.
6.1 Optimisation of the event selection criteria
Events considered in the following are required to pass a basic selection that consists of a large-𝑅jet trigger requirement, at least two large-𝑅jets with 𝑝
T >200 GeV and a leading jet 𝑝
T > 500 GeV. All the large-𝑅 jets are also required to be in the central region of the detector,|𝜂
det| <2.
It is well known that the distribution of the energy inside a large-𝑅jet originating from the hadronic decay of a heavy resonance is different from the one of a large-𝑅jet originating from a quark or gluon. Hence, in order to enhance the ratio of the𝑊/𝑍+jets signal over the multijet background, variables which are able to describe the substructure of the large-𝑅jets can be used. In particular two jet substructure variables, 𝐷2[88] and the number of tracks associated with the jet (𝑁
trk), which were seen to have a good sensitivity in tagging𝑊/𝑍 jets [89], are used. The distributions of these variables are presented in AppendixA.
The optimisation studies were made on the𝑊+jets signal, which consists of roughly 75% of the entire 𝑊/𝑍+jets signal.
The variable𝐷
2is a jet shape variable that distinguishes between one- and two-prong7jets [90,91]. It is small for two-prong jets and large for a one-prong jet. Its tagging power is high in the context of this analysis since large-𝑅jets originating from hadronic decays of boosted𝑊and𝑍 bosons are more likely to have a two-prong structure than QCD jets, as it is shown in Fig.12. An algorithm to tag large-𝑅jets from 𝑊bosons based on𝐷
2was developed in Ref. [89]. In that same reference two working points "Medium"
and "Tight" of the tagger were defined, associated with different𝐷
2cuts, corresponding to two different signal efficiencies. In this analysis an intermediate working point is chosen as a nominal𝐷
2selection and the "Medium" and "Tight" ones are used to estimate the systematic uncertainty associated with such a choice. The nominal upper-cut on𝐷
2starts at values of∼1 for large-𝑅jets with 𝑝
T ∼500 GeV and progressively increases near∼ 1.3 for jets with 𝑝
T ∼ 1.2 TeV. In the same 𝑝
T interval, the "Tight"
("Medium") working point maximum allowed values of𝐷
2are in the range[0.9,1.2] ( [1.2,1.6]). The number of tracks inside a jet (𝑁
trk) is also used as a jet substructure variable to enhance the signal over background ratio. In fact,𝑁
trkis related to the number of constituents inside a jet: gluon-induced jets contain a higher fraction of charged hadrons than quark-induced jets and hence a higher number of tracks within the jet [89]. As the multijet background contains a significant contribution of gluon jets,𝑁
trkcan be used to improve the background rejection, as it is shown in Fig.13. The discriminating power of a𝑁
trk
cut is increased when applied after a𝐷
2 cut [92]. The𝑁
trkdistribution in data has been found to vary between 2015+2016 and 2017. This could be related to the grooming algorithm used in the jet definition not fully removing the pile-up contamination and a change in the pile-up conditions across the years. The 𝑁trkdistribution for the 2017 data sample was found to have slightly higher values than for the 2015+2016 sample. The nominal value of the𝑁
trkcut has been set to minimise the impact of this effect, and variations on it are considered to cover discrepancies between the years. For the 2015+2016 data sample, events are selected to have𝑁
trk <25+−32, while for the 2017 data sample the upper cut on𝑁
trkis set to be 30+−53. If a jet passes the minimum𝑝
Trequirements, as well as the𝐷
2and𝑁
trkcuts, it is considered as a signal jet candidate. An event is considered for the final measurement if one of the two leading𝑝
Tjets is a signal jet candidate and the other one is not.
The𝑚
caloand𝑚
TAmass distributions of the signal jet candidates for events which pass the complete event selection are shown in Fig.7(a)and Fig.7(b), respectively. The designed event selection is seen to provide
7‘Prongs’ refers to the number of partons that are captured within the jet.