ATLAS-CONF-2015-057 21/10/2015
ATLAS NOTE
ATLAS-CONF-2015-057
21st October 2015
Determination of the jet energy scale and resolution at ATLAS using Z /γ–jet events in data at √
s = 8 TeV
The ATLAS Collaboration
Abstract
The jet-energy scale and its systematic uncertainty are determined for jets measured with the ATLAS detector using proton-proton collision data at √
s=8 TeVcorresponding to an inte- grated luminosity of 20.3fb−1. The jet energy is probed using the conservation of transverse momentum (pT) in events with a jet and aZ/γ-boson for 20 GeV ≤ pjetT <800 GeVand pseu- dorapidities|η| <0.8. The uncertainty in the jet energy measured withZ–jet events is 1–2%
for 35 GeV≤ pjetT < 210 GeV, and increases to 5–8% in the 17 GeV≤ pTjet <25 GeVrange.
The jet energy is measured with an uncertainty of about 1% for 120 GeV≤ pTjet < 700 GeV usingγ–jet events. The jet-energy scale for jets in the pseudorapidity range 0.8 ≤ |η| < 4.5 is validated in data using Z–jet events. After applying η-dependent corrections, the MC simulation reproduces the jet-energy scale in the forward region within 2%. The jet-energy resolution for 20 GeV≤ pjetT <700 GeVand|η| <0.8is measured in data using theZ/γ–jet balance method. The jet-energy resolution in the 20 GeV ≤ pTjet < 80 GeV range is de- termined using the Z–jet events with an uncertainty of about 20%. The uncertainty on the jet-energy resolution is found to be approximately 10% for 80 GeV≤ pjetT < 700 GeVusing theγ–jet technique.
c
2015 CERN for the benefit of the ATLAS Collaboration.
Reproduction of this article or parts of it is allowed as specified in the CC-BY-3.0 license.
1 Introduction
Proton-proton (pp) collisions with a large centre-of-mass energy at the Large Hadron Collider (LHC) probe the laws of nature down to very short distances. Jets, collimated streams of hadrons, are the dominant final state objects in high-energyppcollisions at the LHC. They are key ingredients for many physics measurements and for searches for new phenomena. Jets are observed as groups of topologically- related energy deposits in the ATLAS [1] calorimeters. They are reconstructed with jet algorithms as implemented by theFastJetpackage [2]; ATLAS uses the anti-kt [3] and Cambridge/Aachen [4] jet reconstruction algorithms. The reconstructed jets are calibrated using a combination of methods based on Monte Carlo (MC) simulation and in situ techniques. This note presents a determination of the jet energy scale (JES) using transverse momentum balance inZ/γ–jet events for jets reconstructed with the anti-kt algorithm and with a jet size ofR=0.4,R= 0.6 and R=1.0 (large–Rjets). The calibration and performance of non-standard jets that have been constructed using various clustering algorithms and jet size parameters is described in Ref. [5].
A first estimate of the jet energy scale uncertainty [6] in data collected in 2009/2010 was based on test- beam measurements, single hadron response measurements and the transverse momentum balance in dijet events measured in collision data (in situ). An uncertainty of about 2.5% was found over a wide range of jetpT in the central calorimeter region. A much larger dataset, recorded during the 2011 data-taking period allowed to improve the precision of JES measurements to 1–3% for jets withpT > 40 GeV within
|η| <2.5 using a combination of in situ techniques [7].
In 2012, ATLAS collected data fromppcollisions at a centre-of-mass energy of √
s = 8 TeV, with total statistics corresponding to approximately 20 fb−1 of integrated luminosity. The jet reconstruction and calibration is complicated by pile-up effects. Pile-up is due to multiple ppinteractions occurring during the same bunch crossing, and the remnants of electronic signals from adjacent bunch crossings in the detector. The high luminosity operation of the LHC in 2012 together with the large inelasticppcross- section result in an average numberhµiof simultaneous ppcollisions of about 21, increasing to 40 in some data-taking periods.
This note presents the results of the in situ jet energy scale and resolution measurements, and the determi- nation of their uncertainties usingZ/γ–jet events. First, the jet energy is probed using the direct balance method (DB) in events with one jet recoiling against a Z-boson or a photon. Second, the calorimeter response is measured using the missing transverse energy projection fraction (MPF) technique inZ/γ–jet events. BothZ →e+e−andZ → µ+µ−decay channels are considered in the Z–jet analysis. Finally, the DB method is used to study the jet energy resolution (JER).
This document is organised as follows: Section 2 describes the ATLAS detector and Section3 sum- marises the Monte Carlo simulation of electrons, photons, muons and jets. Section4 briefly describes the jet reconstruction and calibration procedures. The methodology for in situ jet energy scale calibra- tion is discussed in Section5. The dataset and event selections are outlined in Section6. The study of out-of-cone effects in the DB method are presented in Section7. The Z–jet and γ–jet validation tech- niques are detailed in Sections 8 and 9. The validation of the jet energy scale in the forward region is discussed in Section 8.2. The calibration of the energy scale of large–Rjets and its uncertainty are presented in Section10. Determination of the jet energy resolution and its uncertainty is described in Section11. A summary of the jet energy scale calibration and jet energy resolution determinations is given in Section12.
2 The ATLAS detector
The ATLAS detector is a multi-purpose detector designed to observe particles produced in proton-proton and heavy ion collisions. A detailed description can be found in Ref. [1]. The detector consists of an inner detector, sampling electromagnetic and hadronic calorimeters and a muon spectrometer.
The inner detector (ID) comprises a tracking system immersed in a magnetic field of 2 T provided by a solenoid. It covers a pseudorapidity1range |η| < 2.5 and has complete azimuthal coverage. TheID is used to reconstruct tracks from charged particles and determine their transverse momentum from the curvature of the tracks.
The liquid argon (LAr) calorimeter is composed of sampling detectors with full azimuthal symmetry, housed in one barrel and two endcap cryostats. A highly granular electromagnetic (EM) calorimeter with accordion-shaped electrodes and lead absorbers in liquid argon covers the pseudo-rapidity range
|η| <3.2. It contains a barrel section (EMB,|η|< 1.475) and an endcap section (EMEC, 1.375≤ |η| <3.2), each with three layers in depth. A copper-liquid argon hadronic endcap calorimeter (HEC, 1.5≤ |η| <3.2) is located behind theEMEC. A copper/tungsten-liquid argon forward calorimeter (FCal) covers the region closest to the beam at 3.1 ≤ |η| < 4.9. The HEC has four layers and the FCal has three layers. The hadronicTilecalorimeter (|η| < 1.7) surrounding theLArcryostats completes the ATLAS calorimetry.
It consists of plastic scintillator tiles and steel absorbers covering |η| < 0.8 for the barrel and 0.8 ≤
|η| <1.7 for the extended barrel. Radially, the hadronicTilecalorimeter is segmented into three layers.
The ATLAS calorimeters are used to reconstruct electrons, photons, taus, missing transverse energy and jets.
The muon spectrometer surrounds the ATLAS calorimeters. A system of three large air-core toroids, a barrel and two endcaps, generates a magnetic field in the pseudorapidity range of|η| < 2.7. The muon spectrometer measures muon tracks with three layers of precision tracking chambers and is instrumented with separate trigger chambers.
The trigger system for the ATLAS detector consists of a hardware-based Level 1 (L1), as well as software- based Level 2 (L2) and event filter (EF), jointly denoted as the High Level Trigger (HLT) [8]. Electrons and photons are triggered in the pseudorapidity range|η| < 2.5, where the electromagnetic calorimeter is finely segmented. Compact electromagnetic energy depositions triggered atL1are used as the seed for the higher level trigger algorithms, which are designed for identifying electrons based on calorimeter and fast track reconstruction. The muon trigger atL1is based on a coincidence of trigger chamber layers.
The parameters of muon candidate tracks are then derived by fast reconstruction algorithms in both the IDandMS.
1 The ATLAS coordinate system is a right-handed system with thex-axis pointing to the centre of the LHC ring and they-axis pointing upwards. The polar angleθis measured with respect to the LHC beam-line. The azimuthal angleφis measured in the transverse (xy) plane with respect to thex-axis. The pseudorapidityηis an approximation for rapidityyin the high energy limit, and it is related to the polar angleθasη=−ln tanθ2. The rapidity is defined asy=0.5×ln[(E+pz)/(E−pz)], whereEdenotes the energy andpzis the component of the momentum along the beam direction. Transverse momentum and energy are defined aspT=p×sinθandET=E×sinθ, respectively.
3 Monte Carlo simulation of jets in the ATLAS detector
The type, energy and direction of particles produced in proton-proton collisions are simulated using various event generators. An overview of Monte Carlo (MC) event generators for LHC physics can be found in Ref. [9].
The baseline simulation sample used in theγ–jet studies is produced with the event generator Pythia8 [10]
with the AU2 tune [11]. The simulation uses a 2→ 2 matrix element (ME) calculation convoluted with the CTEQ6L1 [12] parton density functions (PDF) to model the hard sub-process, andpT-ordered parton showers to model additional radiation in the leading-logarithm approximation [13]. Multiple parton inter- actions [14] (MPI), as well as parton showering and hadronisation based on the Lund string model [15], are also simulated. To estimate the uncertainties on the modelling of the hard scattering, parton show- ers and hadronisation, as well as of the underlying event (UE), additional samples are produced using the Herwig++[16] event generator with the UE-EE-3 tune [17]. Herwig++uses a 2 → 2 ME calcula- tion convoluted with the CTEQ6L1 PDFs and angular-ordered parton showers in the leading-logarithm approximation, as well as the cluster model for the hadronisation [18]. The UE and soft inclusive inter- actions are described using a hard and soft MPI model.
For the Z–jet analysis, the default sample is generated using the next-to-leading order (NLO) generator POWHEG [19] interfaced with Pythia 8 with the AU2 tune to evolve partons into final state particles. This generator uses a 2→1 matrix element at the leading order (LO) (only aZ-boson is produced) and both 2→1 and 2→2 ME at NLO, such that jets are produced only at the NLO level. The matrix elements are convoluted with CT10 NLO PDFs [20]. Theoretical uncertainties are evaluated by comparing to samples generated using Sherpa [21], which incorporates multi-leg 2→ N matrix elements (with up to 5 partons in the final state) matched to parton showers using the CKKW [22] prescription. MPI are simulated using 2→2 QCD matrix elements, while fragmentation is simulated using the cluster-hadronisation model [23]
and the UE is modelled using the Sherpa AMISIC model based on Ref. [24]. The CT10 PDF set is used to generate the hard scattering processes.
All samples are produced with √
s = 8 TeV. Table 1 summarizes the baseline MC samples, as well as those produced with various event generators and theoretical models used in evaluating systematic uncertainties for each of the analysis channels.
Analysis Sample Event generator PDF set/tune Z–jet baseline POWHEG+Pythia 8 CT10/AU2
alternative Sherpa CT10
γ–jet baseline Pythia 8 CTEQ6L1/AU2
alternative Herwig++ CTEQ6L1/UE-EE-3
Table 1: Summary of the simulation samples used for each in situ method. Here baselinerefers to the nominal MC samples and thealternativesamples are used for evaluation of modelling uncertainties.
Pile-up effects in all samples are modelled using simulated minimum bias events generated using Pyth- ia8 [10] with the AU2 tune. These events, which are dominated by inelastic ppscattering, are overlaid onto the hard scattering events. The number of pile-up events follows a Poisson distribution around the average numberhµiof additional ppcollisions per bunch crossing. The effects from pile-up events
occurring in nearby bunch crossings (out-of-time pile-up) are also modelled. These overlaid events are sampled from out-of-time bunches according to a simulation of the LHC bunch train structure.
Additionial weights are assigned to events in the MC simulation to match the distribution ofhµi, as well as the efficiencies of the trigger and of electron/photon identification, to those in data.
The Geant4 software toolkit [25] within the ATLAS simulation framework [26] propagates the particles produced by the event generators through the ATLAS detector and simulates their interactions with the detector material. Hadronic calorimeter showers are simulated with the QGSP_BERT physics list [27–
35].
4 Jet reconstruction and calibration
Jets in the ATLAS calorimeters are reconstructed using the anti-kt algorithm [3] with radius parameters R=0.4,R=0.6 orR=1.0 (large–Rjets), using as input positive energy topological clusters (topo-clust- ers) [36] of calorimeter cells. The three-dimensional topo-clusters are built from topologically connected calorimeter cells that contain a significant signal above noise. Jets can be reconstructed from topo-clust- ers at the electromagnetic (EM) energy scale, which correctly measures the energy deposited by electro- magnetic showers in the calorimeter, or from clusters calibrated with the local cluster weighting (LCW) scheme [37,38].
The LCW method first classifies topo-clusters as either electromagnetic or hadronic in nature, based primarily on their energy, energy density and location in the calorimeter. Weights are assigned to the clusters to correct for the difference between the calorimeter response to hadrons and electro-magnetic objects, energy falling in unclustered cells and energy deposited in uninstrumented areas of the detector.
Based on this classification, energy corrections are derived from single charged and neutral pion Monte Carlo simulations.
Jets are calibrated in several steps. Since the topo-clusters are reconstructed using the geometrical centre of the ATLAS detector as the reference to calculate their directions, the calorimeter jets originate from the detector centre. The kinematic observables of each topo-cluster are recalculated using as their direction the vector from the primary vertex to the topo-cluster centroid. The primary vertex is defined as the one that has the largest sum of squared transverse momenta of associated tracks. The raw jet four-momentum is thereafter redefined as the vector sum of the corrected topo-cluster four-momenta. This correction improves the angular resolution and leaves the jet energy unaffected [7,39].
The dependence of the jet response on the number of primary vertices, NPV, and the expected average number,hµi, of interactions per beam bunch-crossing is removed by applying a pile-up correction on the EM or LCW scale before applying the JES correction. This pile-up correction is calculated on a jet-by- jet basis by multiplying the median transverse momentum density in the event by the jet area [40] . In addition, a residual pile-up correction as a function ofpTjetandηin bins ofhµiandNPVis applied2[41].
The main jet energy calibration is derived as a simple correction relating the reconstructed jet energy to the true jet energy at particle level (after parton fragmentation) [7,39]. It can be applied to jets formed from topo-clusters at EM-scale or at LCW-scale with the resulting jets referred to as calibrated with the EM+JES or the LCW+JES scheme. The JES correction is derived from an inclusive jet Monte Carlo sample that includes pile-up events.
2The residual correction brings jet response to the pile-up conditions withNPV=1.
In order to further improve the jet performance, the global sequential calibration (GSC) is applied [7, 42]. The GSC is a multi-variate extension of the nominal calibration procedure. Any variable x that is correlated with the detector response to the jet can be used, e.g. the jet properties that characterise the longitudinal and/or transverse topology of the energy deposited by the jet. A multiplicative correction to the jet energy measurement is derived for each relevant variable in sequence by inverting the calibrated jet response as a function of this variable. As a result of this correction, the dependence of the response on the variablexis removed without changing the average energy,3resulting in a reduction of the spread of the reconstructed jet energy and, thus, an improvement in energy resolution [42]. In the following, the EM+JES or LCW+JES notation refers to the full JES calibration scheme, which also includes the GSC corrections.
The response of the ATLAS calorimeters to jets depends on the jet direction, due to the various calorime- ter technologies used and to the varying amounts of dead material in front of the calorimeters. Anη- dependent calibration factor is therefore needed to ensure a uniform calorimeter response to jets. This is achieved by applying first the JES calibration and then additional correction factors, derived in data by comparing in dijet events the transverse momentum of a well-calibrated central jet to a jet in the forward region [43] (not available for the large–Rjets).
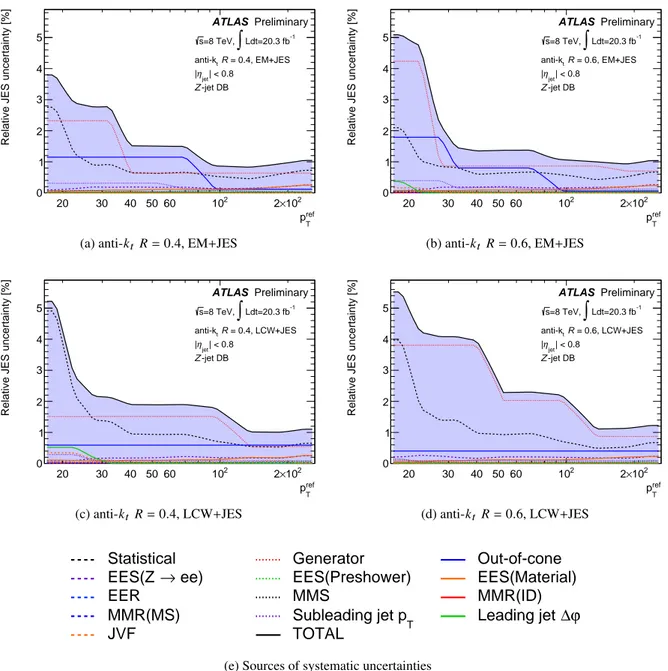
In the central calorimeter region,|η| < 0.8, the jet energy scale is validated in data exploiting transverse momentum balance between a jet and a well calibrated reference object inγ–jet and Z–jet events. At the last step of the calibration procedure, a residual correction determined from the combination of the in situ methods [39] is applied to account for differences between data and MC simulation. The derivation of the residual correction and its uncertainties is detailed in the following section.
5 Methodology of the in situ jet energy scale calibration
The energy scale of jets is calibrated in data using as reference a well-calibrated object. Two techniques are employed to calibrate jets in the central rapidity region,|η| <0.8:
• Direct transverse-momentum balance between a photon or aZ-boson and a jet (DB),
• Transverse-momentum balance between a photon or aZ-boson and the hadronic recoil, referred to as the Missing Projection Fraction (MPF) technique.
In these methods, the response of the jet or the hadronic recoil is compared to the reference object in both data and MC simulation, and the data-to-MC ratio is used as a residual correction. This factor is applied to jets in data, in addition to the MC-based JES calibration, to improve the measurement of the jet energy.
Due to the steeply fallingZ-bosonpTspectrum, which limits the number of events at largepT, the Z–jet analysis covers a limited momentum range 17 GeV ≤ pTjet < 250 GeV. The γ–jet analysis covers a range 25 GeV ≤ pTjet < 800 GeV, but at low pT the photon sample has a large contamination from dijet production. A combination of both Z–jet andγ–jet channels is used to cover the full momentum range 17 GeV≤ pTjet< 800 GeV [7,39].
3The GSC correction factors are derived in dijet events, which are dominated by gluon-induced jets. When these corrections are applied to quark-induced jets such as those found inZ/γ–jet events, a small shift in energy is observed [42].
5.1 Direct balance method description
In the DB method, events with aZ/γand one recoiling jet are used to compare the transverse momentum of the jet to that of the Z/γ-boson. The pT balance technique uses the photon in the γ–jet analysis, or the leptonically decayingZ in theZ–jet analysis, as a reference to validate the jet-energy calibration and determine its systematic uncertainties. The four-momentum of the photon is precisely measured in the electromagnetic calorimeter. BothZ → e+e− andZ → µ+µ−decay channels are used in the measure- ment to improve the statistical precision of the JES validation and to have different systematic uncer- tainties on the four-momentum of the reference object. If the Z-boson decays into electrons (muons), its four-momentum is reconstructed using the electrons (muons), which are accurately measured in the electromagnetic calorimeter and the inner detector (muon spectrometer and the inner detector).
Ideally, if the jet includes all the particles that recoil against theZ/γ-boson, and if the photon/lepton four- momenta are perfectly measured, the response of the jet in the calorimeters can be determined by using pTZ/γ as the reference jetpT. However, this measurement is affected by:
• the uncertainty on the photon/electron energy (or the muon momentum) measurements;
• additional parton radiation (sub-leading jets) contributing to the recoil against theZ/γ-boson;
• particles from the fragmentation process that are not included in the jet cone, referred to as out-of- cone (OOC) radiation;
• a contribution from the underlying event, as well as in-time and out-of-time pile-up.
In order to reduce, at least partly, the effect of additional parton radiation perpendicular to the jet axis in the transverse plane4, a reference
prefT = pTZ/γ×
cos∆ϕ jet,Z/γ
, (1)
is constructed from the azimuthal angle∆ϕ jet,Z/γ
between the Z/γ-boson and the jet, and the Z/γ- boson transverse momentumpTZ/γ. In addition, cuts on∆ϕ jet,Z/γ
and thepTof the sub-leading jet are applied, as detailed in Section6.
The measurement of thepTbalance between aZ/γ-boson and a jet is sensitive to the jet energy scale. By comparing the distribution of the momentum balance between the jet and the reference object,
pTjet/prefT , obtained in data and the MC simulation, one validates the MC description of the data and the MC based jet energy calibration. The data-to-MC ratios of mean values ofpTbalance are studied in bins ofpTref. The balance distribution is fitted by a maximum likelihood fit. The function used, referred to hereafter as the “fit function”, is a Poisson distribution extended to non-integer values and multiplied by a turn- on curve to model the effect of the cut on the reconstructed pjetT . For a given prefT bin, [prefT min,prefT max], the turn-on curve is equal to 1 above pTjet/pTref=8 GeV/prefT min and to 0 below 8 GeV/prefT max. A linear function is used to interpolate the turn-on between these two values. The mean value of the underlying Poisson distribution is taken as the mean balance,hpTjet/prefT i, and the width of the Poisson distribution,
σ
pjetT /pTref
, is used to compute the jet energy resolution. The fit range is limited to a width equal to
±2×RMS (root mean square) of the balance distribution around its arithmetic mean to minimise the impact on the final result of mismodelling of the tails of the balance distribution by the MC simulation.
The fit range has been varied up and down by 5% and the impact of these variations on the data-to-MC
4xy–plane in the ATLAS coordinate system
ratio ofhpTjet/prefT iis found to be much smaller than the statistical uncertainty on the data-to-MC ratio. A fit is also preferred to an arithmetic mean calculation because of the cut on thepjetT at the reconstruction level, which biases the mean value of the balance distribution at low-pTref due to the jet energy resolution and the steeply falling Z/γ–jet cross section [44]. For larger prefT (prefT ≥ 35 GeV), the arithmetic mean calculation is not sensitive to the jet threshold, and it gives results equivalent to those obtained with a fit.
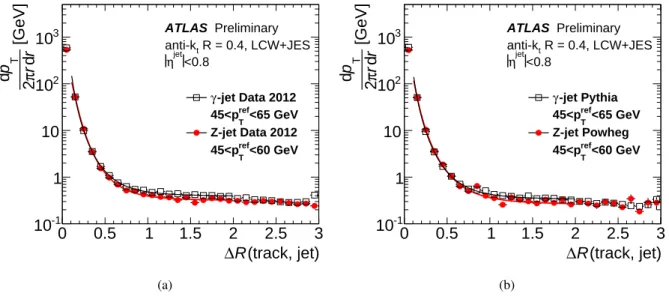
The precision of the DB method is limited by the out-of-cone effects. In a pure partonicZ/γ–jet event at LO, the outgoingZ/γand parton (quark or gluon) perfectly balance each other in transverse momentum.
However, in practice the transverse momentum of the reference object is only approximately equal to the transverse momentum of the particle-level jet originating from a parton, mainly because of the following two reasons: (1) while theZ/γbalances against the whole system of recoiling particles, the jet definition includes only a subset of these particles due to the limited size of the jet cone and does not include muons and neutrinos from hadron decays5, and, (2) the contribution to the momenta of theZ/γand the jet from particles not directly associated with the hard scattering, such as from the UE. The latter contribution is negligible for photons and electrons/muons, since they are very narrow objects, but could be considerable for wide objects such as jets. The amount of momentum carried by particles outside the jet and by particles coming from soft interactions not contributing to thepTbalance is studied in Section7.
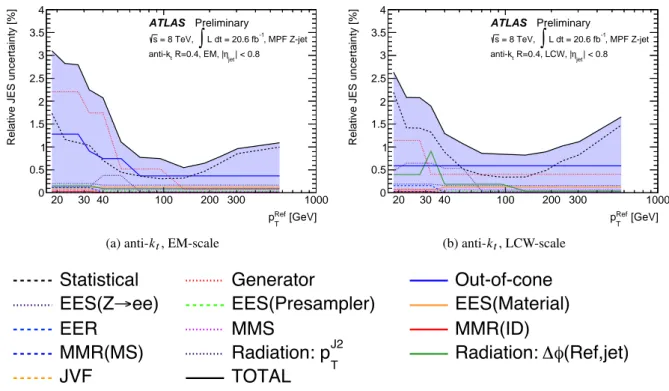
5.2 Missing Projection Fraction method description
An alternative to the DB method is the Missing Projection Fraction (MPF) technique [38, 45]. Rather than balancing the reference object,Z-boson or photon, against the jet, the whole hadronic recoil is used.
This method takes into account the contribution from the out-of-cone radiation and it is also more robust against pile-up and the UE. This is because this other activity is symmetric inφwhen averaged over many events and therefore cancels.
The MPF formalism is detailed below forγ–jet events. The case forZ–jet is the same with theZreplacing the photon. Applying conservation of transverse momentum to theγ–jet final state at leading order (LO) in QCD gives:
~
pTγ+p~Tparton=~0, (2)
at parton level, while at particle level:
~
pTγ+p~Trecoil =~0, (3)
where the momentum balance at particle level is assumed to not be affected by the parton fragmentation.
The momentum balance could be altered by the presence of initial-state radiation (ISR) and/or final-state radiation (FSR) due to residual effects associated with the reconstruction, and the energy dependence of the calorimeter response to jets. Such higher-order effects are mitigated using selection criteria on the event topology. The remaining contributions are mainly in the tails of the MPF distributions. The impact of these effects on the MPF response is propagated to the systematic uncertainties in the data-to-MC ratio measurements.
5Muons and neutrinos deposit either only part or none of their energy in the calorimeter respectively.
Accounting for the interactions with the calorimeters of particles produced by the hard-scattering, Equa- tion (3) can be re-written as
REMp~Tγ+RMPFp~Trecoil=−E~Tmiss, (4) where REM is the response of particles interacting electromagnetically in the calorimeter, RMPF is the calorimeter response to the hadronic recoil andETmiss is the missing transverse momentum in the event.
The assumption is thatETmissis due mostly to the reduced calorimeter signal for the jet because of non- compensation or the loss of particles in inactive material in front of the calorimeters. The minus sign emphasizes the fact thatETmiss is in the direction opposite to the energy excess in the event. Since the calorimeters are calibrated to the EM scale using test beam data and decays such asZ →e+e−in collision data (cf. [46] for details), the photon is well measured so thatREM≈1 and
~
pTγ+RMPFp~Trecoil=−E~Tmiss= p~Tγ−RMPFp~Tγ, (5) where the last step follows from Equation (3). In order to calculate RMPF, the vector quantities are projected into the direction of the photon ( ˆnγ) and the result is divided byETγ:
ETγ−RMPFETγ=−nˆγ·E~Tmiss, (6) where the fact that ˆnγ·p~Tγ =ETγis used. This leads to the MPF equation
RMPF=1+ nˆγ·E~Tmiss
ETγ . (7)
This equation gives the response of the calorimeter to the hadronic recoil in terms of the measurements of the photon and the global energy measurement in the calorimeters. One of the characteristics of the technique is that it is almost independent from the jet algorithm, as the jet definition enters only via the event selection cuts. After a correction has been made for the response of particles that are outside the jet,RMPF≈Rjet. Thistopology correctionis relatively small and is discussed further in Section8.4.7.
The distribution of the jet responseRMPFin bins ofprefT is measured in data and MC simulations, and is fitted using the approach described in Section5.1.
TheE~Tmissused in Equation (7) is chosen to be consistent with the jet-energy scale being calibrated. The E~Tmiss used for the calibration of EM jets is calculated simply for all topological clusters of calorimeter cells, calibrated at the EM scale. For the calibration of jets at the LCW scale, the topo-clusters are first calibrated using the Local Cluster Weight prescription.
The MPF measurement depends mainly on the calorimeter response. The jet algorithm enters only be- cause jets are used in the event selection process. Migration of particles into and out of the jet as it propagates from the particle level to the calorimeter is not tested by the MPF technique6. Ashowering correctionto the JES applied to jets must therefore be added to account for energy flow in the calorimeter across the jet boundary. This correction is calculated in Monte Carlo simulation because it is difficult to measure in data. The contribution of this component to the systematic uncertainty receives dedicated treatment (see Sections8.4and9.3).
The MPF and DB methods probe the calorimeter response to jets in a different way and are sensitive to different systematic effects. They therefore provide complementary measurements of the jet-energy scale.
6Note however that particles that are absorbed by dead material or curl up in the magnetic field, and therefore do not make it to the calorimeter, are considered part of the hadronic response and are corrected by the calibration procedure.
Each technique has different sensitivities to additional soft parton radiation, as well as to pile-up interac- tions. The MPF is in general less sensitive to additional particle activity that is symmetric in the transverse plane, like for example pile-up and the underlying event. The explicit use of jets in the measurement of the jet response from DB makes this technique dependent on the jet reconstruction algorithm. Conversely, the MPF technique is mostly independent of the jet algorithm, as explained above. Thus, in the follow- ing, when presenting the results from the MPF technique, no jet algorithm is explicitly mentioned in general.
5.3 Evaluation of systematic uncertainties
The in situ techniques usually rely on assumptions that are fulfilled only approximately. For example, the balance between the jet and the reference object can be altered to varying degrees by the presence of additional radiation and the amount of this radiation can be controlled by the event topology cuts (cf.
Section6). The systematic uncertainties due to physics effects such as extra radiation can be studied by varying the event selection criteria and looking at the changes induced by these variations on the data- to-MC ratio. An appropriate choice of criteria (e.g. the energy of the subleading jet) can isolate physics effects on the ratio, independent of detector effects. Systematic effects in the selection, modelling and calibration of the reference objects need to be propagated to the data-to-MC ratio as well.
The ratios
hpTjet/prefT datai/hpjetT /prefT MCi
hRMPFdatai/hRMPFMCi
of the mean balances (MPF responses) measured in data and MC simulation are used to quantify the level of data-to-MC agreement in the DB (MPF) method in order to validate the Monte-Carlo-based jet calibration. The effects altering these ratios are evaluated by shifting up and down the energy (or momentum) of the reference object according to its uncertainties, as well as by changing kinematic and topological selections and other modelling parameters.
Only statistically significant variations of the response have to be included as contributions to the systema- tic uncertainties, when thehpjetT /prefT i(RMPF) measured in the nominal and the varied samples are com- pared. This is achieved in two steps. First, the statistical uncertainty onhpjetT /pTrefi(RMPF) in each prefT bin is evaluated using pseudo-experiments. Each event in data and in the MC simulation is countedn times, wherenis sampled from a Poisson distribution with a mean of one. The random numbers for the pseudo-experiments are generated using unique seeds. ThehpjetT /prefT i(RMPF) is evaluated as the average over these pseudo-experiments in both data and MC simulation. The resulting data-to-MC ratio and its statistical uncertainty are calculated taking into account statistical correlations between the nominal and the varied samples in both data and the MC simulation. Second, the systematic uncertainties are evaluated in intervals, which can be larger than the pTref bins of the response measurements, i.e. the adjacent prefT bins are iteratively combined until the observed deviation of the varied response is statistically significant with respect to the nominal one. ThepTref bins are merged only in the regions where there are no physics reasons for the response to depend onpjetT .
The use of the pseudo-experiments and the bin merging procedure avoids multiple counting of the statis- tical uncertainties when evaluating systematic uncertainties.
6 Event and object selection
The data used in this note were recorded by ATLAS from April to December 2012, with all ATLAS sub- detectors operational. The dataset corresponds to a total integrated luminosity of about 20.3±0.6 fb−1of ppcollisions at a centre-of-mass energy of √
s=8 TeV.
The presence of at least one primary vertex, reconstructed using two or more tracks withpT > 500 MeV, is required to reject cosmic ray events and beam-related backgrounds. The primary vertex with the largest sum of the squared transverse momentum of associated tracks is used as the interaction point for the analysis.
The event selections used for the DB and MPF methods are similar, but the values of some of the cuts vary slightly as detailed in the following discussion.
6.1 Trigger selection
Each in situ analysis uses events collected from the available trigger streams. Some of the trigger rates were reduced during data-taking (prescaled) due to bandwidth constraints, with prescales increasing with decreasingpT.
For theZdecaying in thee+e−channel, events are selected online using a trigger that requires the presence of two “loose” electrons, as defined in Ref. [47], with transverse energy ETe > 12 GeV, in the region
|η| < 2.5. For the Z → µ+µ− channel, events are triggered by the presence of one “tight” and one
“loose” (as defined in Ref. [48]) muon withpT >18 GeV and pT >8 GeV, respectively.
In order to accommodate the fast increase in luminosity during the data taking period, six single photon triggers were used, each with a different photon transverse momentum trigger thresholdpγT;trig, to collect events with photons. The requirement that a given trigger is satisfied is made in non-overlappingpγT;trig ranges. The trigger selection was designed such that, for a givenpγT;trigregion, the efficiency was better than 99%. Five prescaled triggers, with 20, 40, 60, 80 and 100 GeV thresholds, are used to select events for this analysis. The highest pγT;trig threshold is 120 GeV and corresponds to the lowest unprescaled single photon trigger.
6.2 Jet selection
In each in situ analysis only the jets within the full calorimeter acceptance |η| < 4.5 with calibrated pT >8 GeV are considered. The jets are also required to pass “Loose” quality criteria, designed to reject fake jets originating from noise bursts in the calorimeter, from non-collision background, or from cosmic rays [49].
Some of the selection criteria rely on the ability to discriminate between jets originating from the hard scatter and pile-up. In order to assess whether a given jet comes from the primary hard-scatter vertex or a pile-up vertex, a quantity labelled the jet vertex fraction (JVF) is computed [50]. The JVF variable is defined as the scalar sum,P
ptrackT , of those tracks matched to a given jet that are associated with the hard scattering primary vertex, divided by theP
pTtrackof all tracks matched to that jet. Any central jet with pT < 50 GeV that has a JVF < 0.25 is likely not to have originated from the hard-scatter vertex
Object Selection Description
jets “Loose” jet pre-selection
pT > 8 GeV,|η| <4.5
JVF>0.25, ifpT <50 GeV and|η|< 2.4
leading jet pT > 10/12 GeV forZ–jet/γ–jet leading jet selection
∆ϕ jet,Z/γ> 2.8 (2.9) rad topology DB (MPF) sub-leading jet pTsublead(R=0.4)<max
8 GeV,0.1(0.3)×prefT
radiation suppression DB (MPF)
Table 2: Summary of the jet/event selection criteria applied in DB and MPF analyses. The parentheses indicate where the MPF selection criteria are different.
[41]. Therefore, jets with pT < 50 GeV, within|η| < 2.4 and JVF< 0.25 are excluded from the balance studies.
Only events where the leading jet haspT >10(12) GeV and|η| < 0.8 are considered in the Z–jet(γ–jet) in situ analysis. To suppress QCD radiation that could affect the pT balance between the Z/γ and the jet, selection criteria are applied on the azimuthal angle between the Z/γ and the leading jet such that
∆ϕ leading jet,Z/γ > 2.8, and on thepTcarried by the second leading jet,pTsublead, such thatpsubleadT <
max
8 GeV,0.1×prefT
. The second-leading jet is defined as the highest-pTjet from the set of sub-leading jets within the|η| <4.5 range. The event is accepted for analysis, if theR=0.4 jet collection passes the cut on the subleading jet.
The jet selection cuts for the MPF analysis arepsubleadT < max
8 GeV,0.3×prefT and
∆ϕ leading jet,Z/γ >2.9. ThepTsubleadcut is less stringent because the MPF method is less sensitive to QCD radiation. The jet selection for the DB and MPF methods is summarised in Table2.
6.3 Z–jet selection
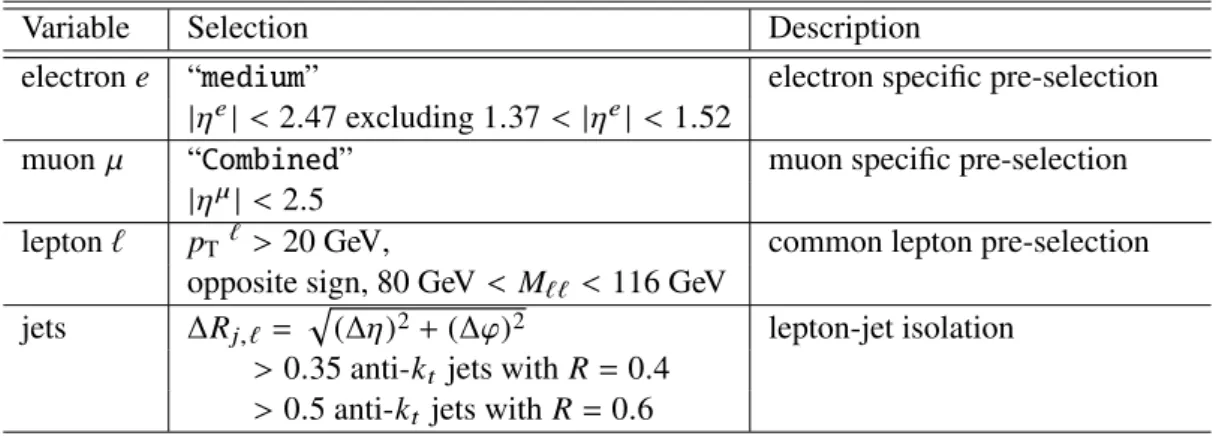
Details of electron reconstruction and identification can be found in Ref. [51]. Three levels of electron identification quality are defined, based on different requirements on shower shapes, track quality, and track-cluster matching. The intermediate one, “medium” selection criteria, is used in this analysis. The energy calibration of electrons follows the procedure discussed in Ref. [46].
Muons in ATLAS are reconstructed through the combination of trajectories and energy loss information in some or all detector systems, “Combined”, as detailed in Ref. [52].
Events are required to contain exactly two leptons, either two electron or two muon candidates, passing kinematic cuts onpTand pseudo-rapidity. If these leptons have opposite-sign charge and an invariant mass (M``) in the range 80−116 GeV, the event is kept and the four-momentum of the Z-boson candidate is reconstructed from the four-momenta of the two leptons. Events withprefT >17 GeV are considered in the Z–jet analysis. The leading jet must havepT > 10 GeV to minimise the impact of the jetpT cuts on the shape of thepT balance distribution. All jets are required to be isolated from the two leptons originating from theZ-boson.
Table3summarizes theZ–jet selection criteria.
Variable Selection Description
electrone “medium” electron specific pre-selection
|ηe| <2.47 excluding 1.37 < |ηe| <1.52
muonµ “Combined” muon specific pre-selection
|ηµ| < 2.5
lepton` pT `> 20 GeV, common lepton pre-selection opposite sign, 80 GeV< M`` <116 GeV
jets ∆Rj,` = p
(∆η)2+(∆ϕ)2 lepton-jet isolation
>0.35 anti-kt jets withR=0.4
>0.5 anti-kt jets withR=0.6
Table 3: Summary of the event selection criteria applied in theZ–jet analysis. Here∆Rj,`is the distance between the leading jet and a lepton, where sub-leading refers to any jet other than the leading jet used in the measurements.
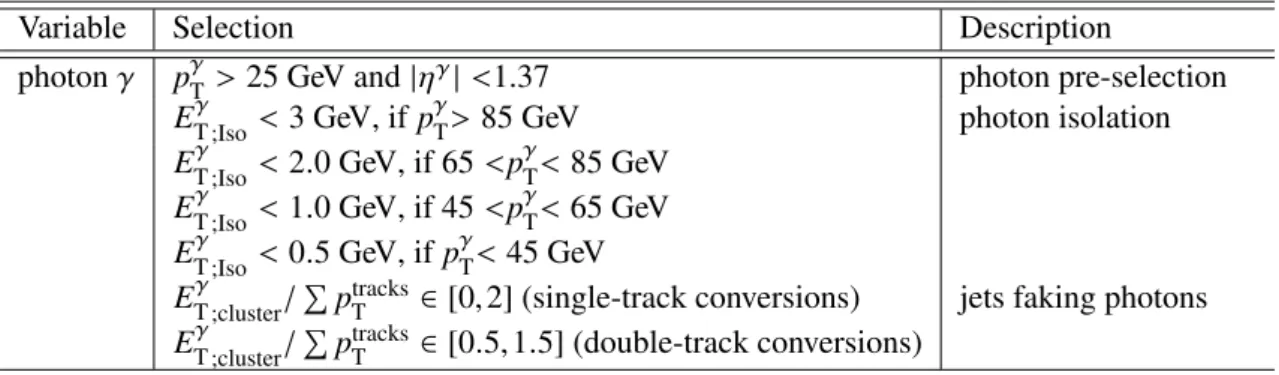
6.4 γ–jet selection
Events are required to have at least one reconstructed photon; the highest pT (leading) photon within
|η| < 1.37 is taken as the hard-process photon and must have pγT > 25 GeV. The leading photon must pass strict identification criteria [53], meaning that the pattern of energy deposition in the calorimeter is consistent with the expected photon showering behaviour in the calorimeter. The leading photon must also lie in a pseudo-rapidity range such that it is fully contained within the electromagnetic barrel calorimeter.
The energy calibration of photons follows the procedure discussed in Ref. [46].
Jets with high electromagnetic content (e.g. jets for which a π0 carries most of the jet energy, with
π0 → γγ) might be misidentified as photons. In order to reduce this background, the leading photon
is required to be isolated from other activity in the calorimeter. An isolation variable (EγT ;Iso) [53] is computed by summing the energy depositions in the calorimeter in a cone of size R = 0.4 around the photon (i.e. excluding the photon itself), and corrected for pile-up energy and photon energy leakage inside the isolation cone. The isolation energy must beEγT ;Iso<3.0 GeV. However, low-pTphotons have larger dijet contamination, therefore a tighter cut on the isolation variable is applied, namely EγT ;Iso <
(0.5,1.0,2.0) GeV for photons withpT< (45,65,85) GeV, respectively.
The photon reconstruction algorithm also considers photons that have converted into an electron-positron pair. While calorimeter clusters without matching tracks are directly classified as “unconverted” photon candidates, clusters matched to pairs of tracks originating from reconstructed conversion vertices are considered as “converted” photon candidates (double-track conversions). To increase the reconstruction efficiency of converted photons, conversion candidates where only one of the two tracks is reconstructed (single-track conversions) are also retained. Jets that are misidentified as photons fall more often in the category of converted photons, because fake photons produce wider showers and have tracks associated with them. To suppress this background further, an event selection is applied based on the ratio of the transverse energy of the photon candidate cluster to the scalar sum of the pT of the matching tracks (EγT ;cluster/(P
pTtracks)). Similarly to the Z–jet analysis, the highest pT jet must have pT > 12 GeV. The value of the pjetT cut is slightly higher in the case of the γ–jet analysis due to a larger photon pT cut compared to that of theZ-boson. A summary of theγ–jet selection criteria is given in Table4.