ATLAS-CONF-2013-044 25April2013
ATLAS NOTE
ATLAS-CONF-2013-044
April 24, 2013
Determination of the tau energy scale and the associated systematic uncertainty in proton-proton collisions at √
s = 8 TeV with the ATLAS detector at the LHC in 2012
The ATLAS Collaboration
Abstract
This note describes the energy scale calibration of hadronic
τdecays and the associated uncertainty in 4.5 fb
−1of data at
√s=
8 TeV recorded in 2012 with the ATLAS detector at the LHC. The calibration is based on simulated
τdecays, while the systematic uncertainty is estimated by propagating single particle response measurements to the individual
τdecay products, namely charged and neutral pions. The systematic uncertainty on the hadronic
τenergy scale for
pτT >20 GeV and
|ητ| <2.5 is found to be
≤3% for the hadronic decay modes with exactly one reconstructed track, and
≤4% for the hadronic decay modes with at least two reconstructed tracks. The systematic uncertainty is obtained with a deconvolution method, and is checked using an in-situ analysis of the visible mass of reconstructed
Zboson decays into one leptonically and one hadronically decaying
τ. These two methodsyield results that are compatible within the calculated uncertainties.
c
Copyright 2013 CERN for the benefit of the ATLAS Collaboration.
Reproduction of this article or parts of it is allowed as specified in the CC-BY-3.0 license.
1 Introduction
Tau leptons play a central role in the LHC physics program, in particular as an important part of the phenomenology of the Higgs boson and Supersymmetry searches [1, 2].
Tau leptons decay hadronically 65% of the time, predominantly to one or three charged pions, a neutrino, and often additional neutral pions. Hadronically decaying τ leptons (τ
h) are categorised by the number of charged decay products, observed as the number of tracks or “prongs”. The branching fractions
1(with respect to all τ decays) for hadronic 1-prongs, 3-prongs, and 5-prongs are approximately 50%, 15%, and 0.1%, respectively. There is also a contribution from Cabibbo-suppressed decays to kaons, with a branching fraction of 3%. For the remainder of this document, τ
1-prongrefers to the hadronic decay modes with exactly one reconstructed track and τ
multi-prongrefers to the hadronic decay modes with at least two reconstructed tracks. Since the hadronic τ decays consist of a specific mix of charged and neutral pions, the energy scale of hadronic τ candidates is derived separately from the jet energy scale.
This note describes the calibration of the hadronic τ energy scale (TES) to the energy of the visible decay products, and two methods used to determine the systematic uncertainties on this scale.
First, the TES uncertainty is evaluated by propagating the single particle uncertainties of the indi- vidual visible τ decay products (τ
had-vis) to the τ energy scale. These single particle uncertainties are given by an in-situ measurement comparing calorimeter energy measurements to momenta measured in the Inner Detector (E/p) and test-beam measurements (for pseudorapidities
|η|< 0.8), which are used to directly constrain potential differences in the energy response to charged hadrons. For large pseudo- rapidities (0.8 <
|η|< 2.5), the E/p response measurement for low hadron momenta is combined with uncertainty estimates by comparing di
fferent shower models in simulated samples.
Secondly, the uncertainty on the TES is evaluated by using the reconstructed Z visible mass peak from Z
→ττ
→µν
µν
ττ
hν
τevents. This provides a cross-check on the systematic uncertainty determined using the former method. The two methods yield consistent results. Both analyses were employed in 2011 data [4]. Because of the denser pileup
2environment in 2012 data, minor changes were necessary to adapt the earlier methods to the 2012 data-taking conditions as described in Section 2.3 below. The results presented in this note correspond to data and MC samples produced with the software used for reconstruction up to autumn 2012. The in-situ analysis of the visible mass of reconstructed Z boson decays into one leptonically (τ
lep) and one hadronically (τ
had) decaying τ includes the first 4.5 fb
−1of the 2012 data sample at
√s
=8 TeV.
The note is organised as follows. Section 2 describes the method employed to derive the τ
henergy scale while the deconvolution technique and its application to the TES uncertainty is described in Section 3. Section 4 reports the TES uncertainty derived from the Z
→ττ events.
1.1 Hadronic τ Reconstruction
Decaying τ leptons are reconstructed using the anti-k
talgorithm [5], with a distance parameter R
=0.4.
Topological clusters
3[6] made of calorimeter cells, and calibrated using the Local Hadron Calibration (LC) [7] are used as inputs to the jet algorithm. These jets seed the τ
hreconstruction algorithm, which associates tracks to each seed jet. The τ
hreconstruction is applied to all seed jets with p
T> 10 GeV and with
|η|< 2.5, the η-range of the ATLAS tracking system.
The LC accounts for the non-compensation of the ATLAS calorimeters, for energy deposited outside the reconstructed clusters, and for dead material. These e
ffects are taken into account using weights applied to the cells. These calibration weights depend directly on the reconstructed shower profile, and
1The precise branching ratios used in this analysis are those of the PDG [3].
2Pileup in the following refers to the contribution of additionalppcollisions superimposed on the hard physics process.
3Three dimensional clusters of neighbouring cells for which the signal is significantly above the noise threshold.
are derived from a detailed GEANT4 [8] simulation of the ATLAS detector. The sum of the four-vectors of the clusters associated with the seeding jet is used to calculate the initial direction of the τ
hcandidate.
The energy and direction of the reconstructed τ
hat the LC scale are defined by the sum and centroid of all LC clusters within
∆R
=0.2
4around the initial jet direction. The mass of τ
hcandidates is taken to be zero, and therefore the reconstructed transverse momentum, p
τT, and transverse energy, E
τT, are identical. The calibration of τ leptons in this note is performed relative to the true visible τ momentum defined in Section 2.1 below.
2 Tau Energy Calibration
The LC improves the τ
henergy resolution with respect to the usage of topological clusters at the EM scale, but does not correct for energy lost before the calorimeters, for underlying event and pileup con- tributions, and for out-of-cone effects. All of these corrections are needed to restore the true visible τ momentum scale.
The TES is derived from simulated W
→τν, Z
→ττ and Z
0 →ττ data samples generated with PYTHIA8 [9]. These samples include in-time and out-of-time pileup
5. The mean number of recon- structed primary vertices per event is
hNPVi =14.6. Events used in this study are selected if there is at least one reconstructed τ
hcandidate, and no reconstructed jets with p
T> 15 GeV within
∆R < 0.5 of the τ
hcandidate. Only reconstructed τ
hcandidates passing a medium particle identification criteria, cor- responding to a signal e
fficiency of approximately 60% [10], and matched to a true τ
hwith a transverse momentum p
τ-trueT> 10 GeV, are used. Accounting for resolution effects, this calibration is applicable to τ
hcandidates with p
τT> 15 GeV. Uncertainties are provided for the same transverse momentum range.
This section describes the derivation of calibration constants and corrections that need to be applied to the energy and direction of the reconstructed τ
hto bring it to the true momentum scale and direction.
The section follows the order in which the corrections are derived, however they are implemented in the following order: first the pileup o
ffset is subtracted, then the energy is calibrated using response curves and finally an η
τcorrection is applied.
2.1 Determination of Calibration Constants
The calibrated momentum p
τcalis defined as
p
τcal =p
τLCR( p
τLC,
|ητreco|,n
p) (1) where R is the additional calibration term determined from simulated events that brings the τ momentum to the calibrated visible momentum scale. It is a function of the reconstructed τ
hmomentum at the LC scale p
τLC, the reconstructed τ
hpseudorapidity
|ητreco|, and number of prongsn
p(distinguishing one- and multi-prong candidates).
The τ response is defined as the ratio of p
τLCto the true τ
had-vismomentum (p
τ-truevis) and is binned in the true visible momentum and
|ητreco|. The calibration constants are derived separately forτ
1-prongand τ
multi-prong[4]. The τ candidates are grouped into categories by p
τ-truevis,
|ητreco|and n
p. In each category, the response is fitted with a Gaussian to determine the mean value and a response distribution is constructed as a function of the mean of p
τLCin the given p
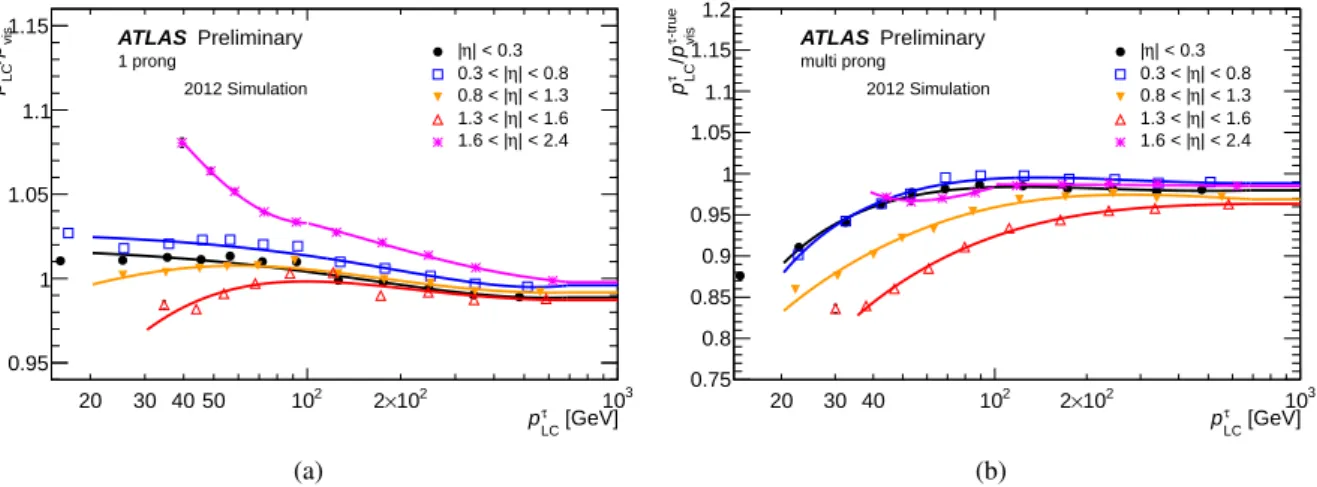
τ-truevisbin. The response is fitted with a functional form empirically-derived and flexible enough to describe the momentum dependence of the calibration con- stants. The response curves for τ
1-prongand τ
multi-prongare shown in Fig. 1(a) and 1(b), respectively. At
4∆R= p
(∆η)2+(∆φ)2.
5In-time pileup describing the additional collisions within the same bunch crossing, out-of-time pileup describing the effects due to calorimeter signal tails from collisions in previous bunch crossings.
[GeV]
LC
pτ
20 30 40 50 102 2×10² 103
-trueτ visp/τ LCp
0.95 1 1.05 1.1
1.15 ATLAS Preliminary 2012 Simulation
1 prong |η| < 0.3
| < 0.8 η 0.3 < |
| < 1.3 η 0.8 < |
| < 1.6 η 1.3 < |
| < 2.4 η 1.6 < |
(a)
[GeV]
LC
pτ
20 30 40 102 2×10² 103
-trueτ visp/τ LCp
0.75 0.8 0.85 0.9 0.95 1 1.05 1.1 1.15 1.2
ATLAS Preliminary 2012 Simulation
multi prong |η| < 0.3
| < 0.8 η 0.3 < |
| < 1.3 η 0.8 < |
| < 1.6 η 1.3 < |
| < 2.4 η 1.6 < |
(b)
Figure 1: Response curves as a function of the reconstructed τ
hmomentum at LC scale for τ
1-prong(a) and τ
multi-prong(b) in bins of
|ητreco|. Uncertainties (smaller than the shown markers in most bins) are statistical only.
very low and high momenta the response curves are extrapolated with a constant equal to the response curve at the outermost evaluated points. The markers terminate at the approximate kinematic limit cor- responding to the threshold of p
τT =15 GeV. The curves extend down to 20 GeV to reflect the fit range used.
2.2 Pseudorapidity Corrections
The calibration procedure described in the previous section brings the momentum of the reconstructed τ
hto the final scale within 1-2% overall. However, a comparison between the reconstructed transverse momentum of τ
hand its true value reveals a few percent level deviation from unity in some
|ητreco|regions.
The largest deviation is found in the transition region between the electromagnetic (EM) barrel and end- cap. This is due to clusters reconstructed in poorly instrumented regions of the calorimeters which tend to have underestimated energies, and may lead to a bias in the τ
hpseudorapidity value.
The pseudorapidity of the reconstructed τ
his corrected to account for this effect. The correction is smaller than 0.01 units in the transition region and negligible elsewhere. The final value of η
τis defined as
|ητ|=|ητreco| −
η
bias(2)
where η
bias= h|ητreco|−|ητtrue|i. After the correction, both the reconstructed momentum and transverse mo-mentum agree with their true values within 1% on average for τ
1-prongand 2% on average for τ
multi-prong. 2.3 Pileup Corrections
The momentum and pseudorapidity corrections described above restore the response to unity. However, when the response is studied as a function of the pileup conditions, variations of up to 8% are observed.
To reduce that dependence and reduce the TES uncertainty, a pileup correction procedure is applied. The pileup contribution to the τ
hmomentum is estimated using the following formula
p
τpileup=A(|η
τreco|,n
p)(N
PV− hNPVi),(3)
where N
PVis the number of reconstructed primary vertices in a given event and
hNPViis the mean
number of N
PVin the sample used to derive the calibration constants (hN
PVi=14.6). The parameter A is
extracted in bins of
|ητreco|and n
pfrom a linear fit. Given that the fractional pileup contribution is largest for low momentum τ candidates, the o
ffset correction is extracted in a momentum bin corresponding to 20 < p
τ-truevis< 30 GeV for
|ητreco|< 1.6, while for
|ητreco|> 1.6 the momentum bin corresponding to 30 < p
τ-truevis< 40 GeV is used.
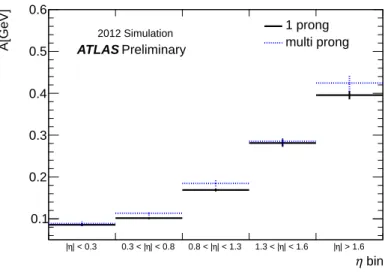
Figure 2 shows the pileup contribution per vertex for τ
1-prongand τ
multi-prongin bins of
|ητreco|. Withpileup corrections applied, equation 1 is modified to
p
τF=p
τLC−p
τpileupR(p
τLC,
|ητreco|,n
p) (4)
and defines the τ momentum at final scale after the pileup correction.
The determination of R( p
τLC,
|ητreco|,n
p) is independent of the pileup corrections which adjust p
τLCto the average level of pileup in the samples used to derive the calibration constants. Out-of-time pileup
η bin
| < 0.3 η
| 0.3 < |η| < 0.8 0.8 < |η| < 1.3 1.3 < |η| < 1.6 |η| > 1.6
A[GeV]
0.1 0.2 0.3 0.4 0.5 0.6
2012 Simulation ATLAS Preliminary
1 prong multi prong
Figure 2: The average pileup contribution per additional primary vertex to τ
1-prongand τ
multi-prongin bins of
|ητreco|. The error bars reflect the statistical uncertainty only as extracted from the linear fit.contributions, originating from previous bunch crossings, are not accounted for. For τ
hwith
|ητreco|> 2 and p
τT< 20 GeV, for which the largest pileup contributions are expected, the dependence of the response on out-of-time pileup was found to be less than one percent. These results are based on simulated samples.
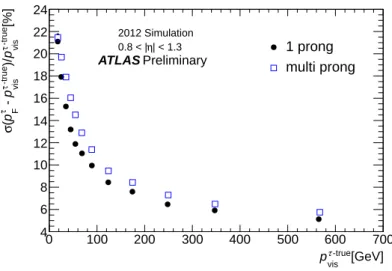
2.4 Momentum Resolution
The resolution of the τ
had-vismomentum is calculated from the di
fference between the calibrated momen- tum ( p
τF) and p
τ-truevis. The resolution is obtained from a Gaussian fit by dividing the σ of the Gaussian by the mean value of the p
τ-truevis. Fig. 3 shows the resolution as a function of the true visible momentum for τ
1-prongand τ
multi-prongfor 0.8 <
|ητ|< 1.3.
The momentum resolution scales with the momentum approximately as σ
p
=a
√
p
⊕b (5)
where
⊕denotes the sum in quadrature. The resolution constants are extracted by fitting this function to
the resolution distributions defined above. They are summarised in Table 1 for τ
1-prongand τ
multi-prongin
various η
τregions.
[GeV]
-true τ
pvis
0 100 200 300 400 500 600 700
[%]-true
τ-truep)/ vis
τp - vis
τ p(σ F
4 6 8 10 12 14 16 18 20 22 24
ATLAS Preliminary 2012 Simulation
| < 1.3 η
0.8 < | 1 prong
multi prong
Figure 3: Momentum resolution for τ
1-prongand τ
multi-prongfor 0.8 <
|ητ|< 1.3.
The discontinuity in the value of b at η
τ =1.6 is due to a change in the detector technology of the hadronic calorimeter between the barrel and end-cap region. In general, the momentum resolution of τ
1-prongis about 10
−20% smaller than for τ
multi-prongdue to the higher fraction of EM energy from π
0decays relative to the hadronic depositions.
One-prong
|ητ|< 0.3 0.3 <
|ητ|< 0.8 0.8 <
|ητ|< 1.3 1.3 <
|ητ|< 1.6
|ητ|> 1.6 a [
√GeV] 0.71 0.73 0.87 1.09 1.10
b 0.02 0.02 0.04 0.07 0.01
Multi-prong
|ητ|< 0.3 0.3 <
|ητ|< 0.8 0.8 <
|ητ|< 1.3 1.3 <
|ητ|< 1.6
|ητ|> 1.6 a [
√GeV] 0.85 0.79 1.02 1.24 1.27
b 0.01 0.03 0.04 0.06 0.01
Table 1: Summary of fitted momentum resolution terms for τ
1-prongand τ
multi-prongin various
|ητ|bins.
3 Determination of the Tau Energy Scale Uncertainty Using Single Parti- cle Uncertainties
The TES uncertainty has contributions from the calorimeter energy response, the chosen MC event gen- erator with a specific choice of the underlying event model, the detector description in the simulation and systematic uncertainties related to the non-closure of the calibration method. Single particle response measurements can be used to determine the calorimeter response uncertainty by decomposing the τ
hinto its decay products and convolving the constituents’ response with the τ
had-visparticle composition. The response of the calorimeter to single particles is estimated from one of three sources depending on the particle kinematics.
1. For low momentum charged hadrons (p < 20 GeV for
|η|< 1.7 and p < 60 GeV for 1.7 <
|η|<
2.5), the response is estimated from in-situ E/p measurements as described in Section 3.1.2.
2. For high momentum charged hadrons in the central region (|η| < 0.8), the response is estimated
from combined test-beam (CTB) measurements [11], as described in Section 3.1.3.
3. In the case of high momentum particles outside the central region, the response is estimated by MC simulation [12] as described in Section 3.1.6.
Sources 1 and 2 directly constrain the description of the calorimeter response to single particles in the simulation and therefore can greatly decrease the TES uncertainty. The convolution is done using a pseudo-experiment approach. In each pseudo-experiment, the TES is evaluated after randomly changing the single particle energy responses within their statistical and systematic uncertainties. In this section, the foundation for the TES uncertainty evaluation is described.
The deconvolution method employed was used and established in the context of the Jet Energy Scale (JES) uncertainty determination for 2010 data [13, 14, 15], as well as in the evaluation of the TES uncertainty for 2011 data [4]. The evaluation of the calorimeter response uncertainty in this document follows the prescription in the documentation cited above while utilising E/p results from 2012 data.
The calorimeter response uncertainty at the LC scale is evaluated as described in Section 3.1; the remaining uncertainty contributions are summarised in Section 3.2. Section 3.3 reports the total TES uncertainty.
3.1 Calorimeter Response Uncertainty
The calorimeter response uncertainty is derived using simulated MC samples of Z
→ττ and Z
0 →ττ decays generated with PYTHIA8 [9]. The events are simulated not including additional pileup interac- tions to allow a pure calorimeter response uncertainty evaluation. The calorimeter response uncertainty is evaluated both for τ
1-prongand τ
multi-prongwith p
τT> 15 GeV. Only reconstructed τ
hcandidates passing medium boosted decision tree based particle identification criteria [10] and matched to a true τ
hare used.
The ATLAS simulation software [16] is able to link the simulated energy depositions to the initiating particle in the generated collision. Thus, the in-situ single particle response measurements can be applied to the depositions (given the deposition-particle link) contributing to the reconstructed τ
hcandidate. This constrains the uncertainty due to the modelling of the particle-calorimeter interactions and the knowledge of the amount of material in front of the calorimeter. Each particle contributing to clusters associated with the reconstructed τ
his classified as follows:
•
Low momentum charged hadrons. The energy depositions of particles associated with isolated tracks in the Inner Detector are used to determine the energy response
hE/piof charged hadrons in a momentum range of 2
≤p < 20 GeV for pseudorapidities covered by the tracking system,
|η|
< 2.5. This analysis provides a MC to data response ratio.
•
High momentum charged hadrons. The pion response measurements of the 2004 CTB data are used to complement the in-situ
hE/pimeasurement for high momentum particles. In the test setup, a full slice of the ATLAS detector, corresponding to the
|ητ|< 0.8 region, was exposed to a pion beam with momentum between 20 GeV and 350 GeV.
•
Neutral pions. The EM energy response has been studied in detail using electrons from Z boson decays and minimum ionising muons in the hadronic Tile calorimeter. Therefore the EM scale is considered to be well described in the simulation. The uncertainties associated with the EM scale are taken from Ref. [17] and are propagated to the TES.
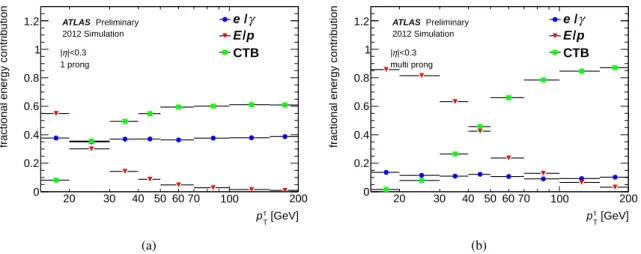
Figure 4 shows the fractional energy contributions, to τ
had-vis, of particles being classified in one of these three categories for
|ητ|< 0.3. For low p
τT, the energy scale uncertainty determination is driven by the in-situ
hE/pimeasurement, while the test-beam analysis contributes mainly to the evaluation of the uncertainty at high momenta. The energy contribution from neutral pions does not depend on the τ
had-vistransverse momentum. The fraction of energy carried by charged hadrons is of the order of 60%
for τ
1-prongand of the order of 85% for τ
multi-prong.
[GeV]
τ
pT
20 30 40 50 60 70 100 200
fractional energy contribution
0 0.2 0.4 0.6 0.8 1
1.2 e /γ
p / E CTB
Preliminary ATLAS 2012 Simulation
|<0.3 η
| 1 prong
(a)
[GeV]
τ
pT
20 30 40 50 60 70 100 200
fractional energy contribution
0 0.2 0.4 0.6 0.8 1
1.2 e /γ
p / E CTB
Preliminary ATLAS 2012 Simulation
|<0.3 η
| multi prong
(b)
Figure 4: Fractional energy contributions to τ
1-prong(a) and τ
multi-prong(b) for
|ητ|< 0.3 by particles described by the
hE/pi (low momentum charged hadrons), the test-beam analysis (high momentum charged hadrons) and e/γ response measurements (π
0).
3.1.1 Particle Deconvolution
A pseudo-experiment approach is used to propagate the single particle uncertainties to the reconstructed τ
had-vis[4, 14]. For each pseudo-experiment (t), particle type, momentum (i) and pseudorapidity bin ( j) a random factor f
tis sampled from a Gaussian probability density function (PDF) with a mean given by the measured response ratio r between data and MC and its width given by the statistical uncertainties
∆
r
(i,j):
f
t(i,j)=N(r
(i,j),
∆r
(i,j)) (6)
Systematic uncertainties (δ) of the measurements are included as additional scale factors u
(i,t,δj), which are sampled from Gaussian PDF’s centered at unity and their widths given by the corresponding systematic uncertainty, which themselves may depend on particle type, momentum and pseudorapidity. In each pseudo-experiment t, the τ
had-visenergy is re-calculated by summing up all energy contributions E
kof the τ object constituents after rescaling them by the corresponding scale factors, giving
E
τt =Xk
f
t(ik,jk)·Yδ
u
(it,δk,jk)·
E
k(7)
This energy is compared to the energy as obtained by setting all scale factors f
t(i,j),u
(i,j)t,δto unity, to assess the TES shift in a given τ
had-visobject and toy experiment. The mean value µ
t = hEtτ/E
τiwithin the τ
had-vissample gives the relative TES shift in the given pseudo-experiment t for a specific set of energy scales and deviations of systematic parameters from one. The distribution of means for a set of 1000 pseudo-experiments is fitted with a Gaussian. The mean of this Gaussian gives information about the expected scale shift between data and MC, while the standard deviation gives the TES uncertainty. Short reviews of the single particle response measurements used as input to the deconvolution method are presented in the following subsections.
3.1.2 Low Momentum Charged Hadrons
The mean energy response for low momentum charged hadrons is measured by comparing their calorime-
ter energy depositions to the momentum measured by the Inner Detector (
hE/pi ). This analysis is per-
formed using a sample of particles with isolated tracks. The neutral background contribution is subtracted
p / E -1 -0.5 0 0.5 1 1.5 2 2.5 3 3.5
)p/E1/N dN/d(
10-5
10-4
10-3
10-2
10-1
1
p / E
-1 0 1 2 3
Data/MC
0 0.5 1 1.5 2
|<0.8 η
|
< 3.6 GeV p 2.8 GeV<
Preliminary ATLAS
= 8 TeV s Data 2012
Simulation Data
(a)
[GeV]
p 2 3 4 5 6 7 10 20 30 40
corr.>p/E<
0.1 0.2 0.3 0.4 0.5 0.6 0.7 0.8 0.9 1
[GeV]
p 2 3 4 5 6 7 10 20 30 40
Data/MC
0.9 1 1.1
|<0.8 η
|
Preliminary ATLAS
= 8 TeV s Data 2012 Data
Simulation
(b)
Figure 5: E/ p distribution for track candidates with momenta between 2.8 < p < 3.6 GeV (a) and the background subtracted
hE/pidistribution as a function of the track momentum (b). The yellow band corresponds to the statistical uncertainty on the simulated sample.
on average by estimating the average energy density of the calorimeter depositions of neutral particles close to the selected tracks in a sample of late showering, minimum ionising hadrons. This procedure is detailed in Refs. [13, 14, 18]. The comparison of the mean energy response
hE/pibetween data and MC is used to determine a relative response shift in the simulation. This measurement covers momenta up to 20 GeV for
|η|< 1.7 and up to 60 GeV for 1.7 <
|η|< 2.5.
In 2012, a dedicated low pileup run at a centre of mass energy of
√s
=8 TeV was carried out, providing a sample of minimum bias events at a high rate. The average number of interactions per bunch crossing in this run corresponds to 0.01. Figure 5 (a) shows the E/ p distribution for particles with momenta between 2.8 < p < 3.6 GeV. Both the low and the high end tail in the uncorrected E/ p distributions are not well modelled in the simulation. The low end tail is dominated by negative energy contributions from cells in the Liquid Argon calorimeter and therefore highly sensitive to energy depositions from previous bunch crossings. Even though the average number of interactions per bunch crossing is low in the studied data sample, contributions from neighbouring bunch crossings still a
ffect this low end tail. The high end tail corresponding to E/p > 1 is dominated by energy depositions from neutral particles close to the selected charged track. While these background components are fairly well modelled in 900 GeV data [18], significant deviations from the MC predictions were observed in 7 and 8 TeV data. A background subtraction scheme corrects on average for these neutral depositions. After correction, the mean calorimeter response is well described by MC simulation, with deviations up to 4%
at low momenta. Figure 5 (b) shows the background corrected
hE/pidistribution.
The average energy deposition from pileup interactions is taken into account as an additional noise
term in the topological clustering algorithm during event reconstruction. To ensure that the obtained
results are applicable to τ
hin nominal 2012 data taking and reconstruction conditions, the impact of the
cluster noise suppression on the
hE/pianalysis was evaluated. Comparisons between di
fferent cluster
threshold settings as well as comparisons between cell based and cluster based
hE/pimeasurements were
carried out. Both comparisons yield compatible results within 2% of the nominal measurement for pseu-
dorapidities of
|η|< 1.5. Therefore a 2% systematic uncertainty is assigned to energy depositions within
this region. For larger pseudorapidities, falling into the acceptance of the hadronic end-cap calorimeter, larger deviations are observed, ranging from 10% for track momenta of 2 GeV to 2% for momenta of 8 GeV.
Additional systematic uncertainties account for the background subtraction scheme (1%), and for di
fferences in the E/ p acceptance (<1.5% ) [13].
3.1.3 High Momentum Charged Hadrons
The CTB data are used to constrain the calorimeter response for high momentum charged pions [11].
To account for any changes in the calorimeter simulation and calibration method since the CTB data analysis, single charged pions with energies and pseudorapidities corresponding to the test-beam setup are simulated using the current ATLAS simulation setup. The difference in the charged pion response between the two simulations is found to be within 0.5%. In addition, cluster threshold e
ffects are found to be negligible for charged pions with p > 15 GeV. Therefore the test-beam results are included in the response uncertainty determination with a conservative 0.5% systematic uncertainty to cover possible response changes in the simulation. Other systematic uncertainties are included to account for the fact that the data are not taken in the same detector conditions. These include uncertainties for calorimeter non-uniformity for all energies measured at the same pseudorapidity point, as well as fully correlated scale uncertainties in the Liquid Argon and Tile calorimeters [14].
3.1.4 Global Electromagnetic Energy Scale
The EM energy scale is precisely measured from the well known line-shape of Z
→e
+e
−decays for the EM calorimeters and using the energy loss of minimum ionising muons in the hadronic Tile calorimeter.
For the EM barrel calorimeter, a 1.5% uncertainty on the cell energy measurement is found, while a scale uncertainty of 3% is found for the hadronic Tile calorimeter. Absolute scale uncertainties are applied to EM energy depositions, such as photons from neutral pion decays, as well as to any particle not falling into the phase space covered by the in-situ
hE/pianalysis.
3.1.5 Additional Uncertainty Due to Shower Shape Modelling
Differences in the shower shape model can lead to differences in the shower’s energy density, and hence to a di
fference in which cells are included by the clustering algorithm. In the construction of the pseudo- experiments, any effect on the response due to the clustering algorithm is neglected, as only clustered cells are included in the rescaling procedure. The impact of the response uncertainty on the clustering algorithm is studied by re-applying the clustering algorithm after changing the various energy scales in each pseudo-experiment. This effect is found to be negligible, as is the effect of variations in the shower model on the clustering algorithm.
However, changing the distribution of energy in a cluster also changes the LC weight assigned to
that cluster, and the τ
henergy reconstruction is based on cluster energies calibrated to the LC scale. The
additional uncertainty introduced by this effect is evaluated by comparing the nominal hadronic shower
model QGSP BERT [19, 20, 21] to the FTFP BERT [22] shower model. Both hadronic shower models,
FTFP BERT and QGSP BERT, are compared to CTB data. It is found that the full difference between
these models gives a realistic scale of the systematic uncertainties associated with the hadronic shower
shapes needed for the LC calibration. The e
ffective calibration weight
hELC/E
E Miis derived by compar-
ing the sum of cluster energies at LC and EM scale and is shown in Figure 6. For τ
multi-prong, deviations
of less than 1% are observed between the two physics lists, while for τ
1-prongdeviations are smaller than
0.5%. Similarly, deviations up to 1% are found in the average number of clusters classified as being
likely to be of hadronic origin. Alternatively, one can study the double ratio of data to MC comparisons
102 103
>EME/LCE<
1 1.1 1.2 1.3 1.4 1.5 1.6
[GeV]
τ
pT
100 1000
QGSP/FTFP 0.98 0.99 1 1.01 1.02
|<0.3 η
| 1 prong
Preliminary ATLAS
2012 Simulation
FTFP_BERT QGSP_BERT
(a)
102 103
>EME/LCE<
1 1.1 1.2 1.3 1.4 1.5 1.6
[GeV]
τ
pT
100 1000
QGSP/FTFP 0.98 0.99 1 1.01 1.02
|<0.3 η
|
multi prong
Preliminary ATLAS
2012 Simulation
FTFP_BERT QGSP_BERT
(b)
Figure 6: Comparison of the effective LC calibration at the τ
had-vislevel as given by
hELC/E
E Mibetween two di
fferent shower models as a function of the transverse momentum of τ
had-visfor τ
1-prong(a) and τ
multi-prong(b). For τ
1-prong, the dependence is smaller due to lower hadronic activity.
in E/p results at the EM scale to those obtained at the LC scale (Data/MC)
E M/(Data/MC)
LC. These comparisons show deviations smaller than 1%. Therefore an additional uncertainty of 1% for τ
multi-prongand 0.5% for τ
1-prongis assigned due to an imperfect shower model.
3.1.6 Calorimeter Response Results
For
|ητ|< 0.8, the uncertainty from high momentum charged hadrons is derived from the CTB analysis.
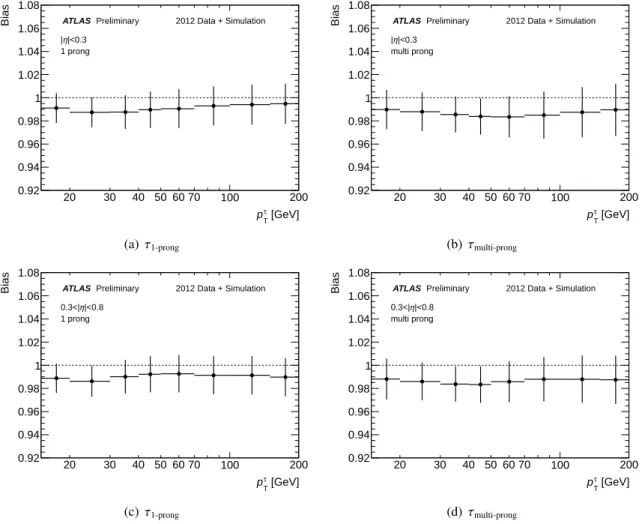
Figure 7 shows the TES bias (central value) and uncertainty (error bars) due to the calorimeter response with all contributions folded in. The error bars are the fitted width, while the points represent the expected scale bias between simulation and data. Overall, low momentum hadrons show a lower response in data than in simulation in the
hE/pi analysis. This translates into an expected TES shift of the order of 1%
for p
τT =15 GeV. The response uncertainty is of the order of 1.5-2% for τ
1-prongwhile it is about 2-2.5%
for τ
multi-prong. The expected scale shift is smaller than the uncertainty, hence no calibration correction is extracted. Instead, the expected shift is added in quadrature to the uncertainty.
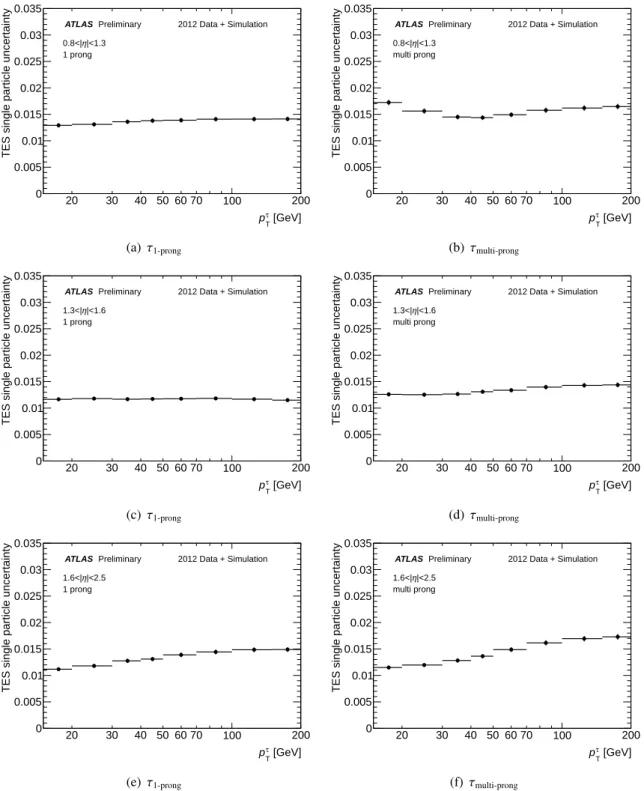
Figure 8 shows the TES uncertainty derived from the
hE/pianalysis and e/γ scale uncertainties for the 0.8 <
|ητ|< 2.5 region. Additional uncertainties for high momentum charged hadrons need to be folded in for a complete response uncertainty. The response uncertainty for high momentum charged hadrons is evaluated by comparing the nominal hadronic shower model to the FTFP BERT shower model. These systematic uncertainties are provided in Table 2, as a function of p
τT,
|ητ|and n
pand need to be scaled by the energy fraction carried by particles outside the scope of the
hE/pimeasurement.
3.2 Additional Uncertainties on the TES Calibration
Additional uncertainties are evaluated from four distinct sources: knowledge of the dead material in front of the calorimeters, underlying event model, the non-closure of the calibration method and pileup [12].
An increase in dead material a
ffects the energy deposition in the calorimeters, that is not accounted
for in the calibration procedure. To quantify the systematic uncertainty due to our knowledge of the
[GeV]
τ
pT
20 30 40 50 60 70 100 200
Bias
0.92 0.94 0.96 0.98 1 1.02 1.04 1.06 1.08
2012 Data + Simulation
Preliminary ATLAS
|<0.3 η
| 1 prong
(a) τ1-prong
[GeV]
τ
pT
20 30 40 50 60 70 100 200
Bias
0.92 0.94 0.96 0.98 1 1.02 1.04 1.06 1.08
2012 Data + Simulation
Preliminary ATLAS
|<0.3 η
| multi prong
(b)τmulti-prong
[GeV]
τ
pT
20 30 40 50 60 70 100 200
Bias
0.92 0.94 0.96 0.98 1 1.02 1.04 1.06 1.08
2012 Data + Simulation
Preliminary ATLAS
|<0.8 η 0.3<|
1 prong
(c) τ1-prong
[GeV]
τ
pT
20 30 40 50 60 70 100 200
Bias
0.92 0.94 0.96 0.98 1 1.02 1.04 1.06 1.08
2012 Data + Simulation
Preliminary ATLAS
|<0.8 η 0.3<|
multi prong
(d)τmulti-prong
Figure 7: Expected relative calorimeter response shift of the data with respect to the MC of reconstructed transverse momentum of the τ candidate in two pseudorapidity bins. The error bars represent the TES uncertainty due to calorimeter response uncertainties.
One-prong systematics 0.8 <
|ητ|< 1.3 1.3 <
|ητ|< 1.6
|ητ|> 1.6
> 15 GeV 0.5% 1.0% 0.5%
Multi-prong systematics 0.8 <
|ητ|< 1.3 1.3 <
|ητ|< 1.6
|ητ|> 1.6
15-30 GeV 2.0% 3.0% 1.0%
30-100 GeV 2.0% 2.0% 1.0%
> 100 GeV 1.0% 1.0% 0.5%
Table 2: Systematic uncertainty due to the shower model as a function of p
τTand
|ητ|. The uncertainty isnot scaled by the energy fraction carried by particles outside the scope of the
hE/pi measurement.
[GeV]
τ
pT
20 30 40 50 60 70 100 200
TES single particle uncertainty
0 0.005 0.01 0.015 0.02 0.025 0.03 0.035
2012 Data + Simulation
Preliminary ATLAS
|<1.3 η 0.8<|
1 prong
(a) τ1-prong
[GeV]
τ
pT
20 30 40 50 60 70 100 200
TES single particle uncertainty
0 0.005 0.01 0.015 0.02 0.025 0.03 0.035
2012 Data + Simulation
Preliminary ATLAS
|<1.3 η 0.8<|
multi prong
(b)τmulti-prong
[GeV]
τ
pT
20 30 40 50 60 70 100 200
TES single particle uncertainty
0 0.005 0.01 0.015 0.02 0.025 0.03 0.035
2012 Data + Simulation
Preliminary ATLAS
|<1.6 η 1.3<|
1 prong
(c) τ1-prong
[GeV]
τ
pT
20 30 40 50 60 70 100 200
TES single particle uncertainty
0 0.005 0.01 0.015 0.02 0.025 0.03 0.035
2012 Data + Simulation
Preliminary ATLAS
|<1.6 η 1.3<|
multi prong
(d)τmulti-prong
[GeV]
τ
pT
20 30 40 50 60 70 100 200
TES single particle uncertainty
0 0.005 0.01 0.015 0.02 0.025 0.03 0.035
2012 Data + Simulation
Preliminary ATLAS
|<2.5 η 1.6<|
1 prong
(e) τ1-prong
[GeV]
τ
pT
20 30 40 50 60 70 100 200
TES single particle uncertainty
0 0.005 0.01 0.015 0.02 0.025 0.03 0.035
2012 Data + Simulation
Preliminary ATLAS
|<2.5 η 1.6<|
multi prong
(f) τmulti-prong
Figure 8: Calorimeter response uncertainty for 0.8 <
|ητ|< 2.5 in three pseudorapidity bins, for τ
1-prong(left) and τ
multi-prong(right) . Only contributions from the
hE/pi analysis and e/γ scale uncertainties are
taken into account.
material in the ATLAS Inner Detector and the cryostat, the nominal sample is compared to a dataset generated with a conservative extra amount of material in the detector simulation [12]. The simulated dataset has an extra 5% material in the Inner Detector, distributed between its sub-detectors, and an extra 20% of material for detector services added for the Pixels. Between the Semiconductor Tracking Detector and Transition Radiation Tracker, there is an additional 20% of material for detector services included and 15% of extra material is added at the end of the Inner Detector end-plate. The dead material contribution to the TES uncertainty is scaled by the energy fraction carried by particles outside the
hE/pi measurement, since this measurement is sensitive to the amount of dead material in front of the calorimeter. On average, the dead material knowledge contributes between 1% and 2% to the TES uncertainty.
The uncertainty due to the underlying event model is obtained by comparing the TES of the nominal sample with a dataset generated using a different MC tune for the underlying event [23]. On average, the underlying event model contributes about 1% to the TES uncertainty. The non-closure of the calibration method contributes about 1% to the TES uncertainty for τ
1-prongand 2% for τ
multi-prong.
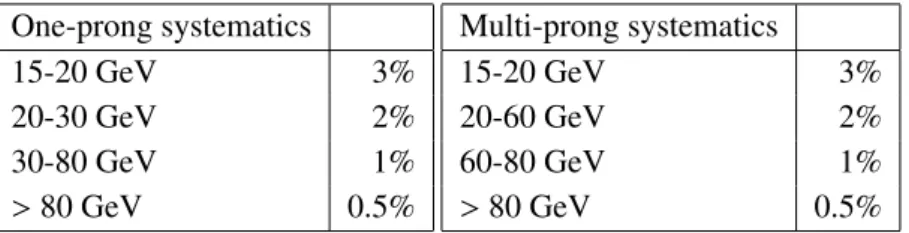
After applying the pileup correction (described in Section 2.3), the variation of the response as a function of N
PVis significantly reduced. The remaining dependence is assigned as a systematic uncer- tainty. It is estimated by splitting the MC samples into five bins according to the average number of primary vertices, which range from 0 to 40. This uncertainty is assigned independent of
|ητ|. Figure 9shows the ratio ( p
τT−p
trueT)/ p
trueTas a function of
|ητ|and p
τTfor different number of primary vertices. The di
fference between the highest and lowest value is taken as the pileup uncertainty to avoid double count- ing the systematics deriving from the non-closure. This uncertainty is found to be 3% for 15 < p
τT< 20 GeV and up to 2% for p
τT> 20 GeV. To estimate the impact of possible out-of-time pileup contributions on the energy response, the scale dependence on the average number of interactions per bunch crossing (hµi) at a fixed value of N
PVwas studied and found to be negligible. Therefore no additional uncertainty is assigned.
A summary of the pileup uncertainties is provided in Table 3, as a function of p
τTand n
p. The uncertainties are independent of the chosen identification working point.
One-prong systematics
15-20 GeV 3%
20-30 GeV 2%
30-80 GeV 1%
> 80 GeV 0.5%
Multi-prong systematics
15-20 GeV 3%
20-60 GeV 2%
60-80 GeV 1%
> 80 GeV 0.5%
Table 3: Systematic uncertainties due to the pileup correction in bins of p
τT. Bins in p
τTwith equal uncertainties are grouped.
3.3 Total Systematic Error
Figure 10 and Table 4 summarise the TES systematic uncertainties for reconstructed τ
hcandidates pass- ing a medium particle identification criteria. Table 5 summarises the TES systematic uncertainties for reconstructed τ
hcandidates passing a tight particle identification criteria [10].
The uncertainty is smallest for τ
1-prongin the central region. The transition region between barrel and
end-cap (1.3 <
|ητ|< 1.6) has the largest uncertainty, mainly due to the large amount of dead material in
front of the calorimeter.
τ| η
|
0 0.5 1 1.5 2 2.5
true Tp)/true Tp-τ Tp(
-0.03 -0.02 -0.01 0 0.01 0.02 0.03 0.04 0.05 0.06 0.07
1 prong 2012 Simulation
ATLAS Preliminary Integrated < 5 0 < NPV
< 10 5 < NPV
< 15 10 < NPV
< 20 15 < NPV
20 < NPV
τ| η
|
0 0.5 1 1.5 2 2.5
true Tp)/true Tp-τ Tp(
-0.03 -0.02 -0.01 0 0.01 0.02 0.03 0.04 0.05 0.06 0.07
multi prong 2012 Simulation
ATLAS Preliminary Integrated < 5 0 < NPV
< 10 5 < NPV
< 15 10 < NPV
< 20 15 < NPV
20 < NPV
[GeV]
τ
pT
102 true Tp)/true Tp-τ Tp(
-0.02 -0.01 0 0.01 0.02 0.03 0.04 0.05 0.06
1 prong 2012 Simulation
ATLAS Preliminary Integrated < 5 0 < NPV
< 10 5 < NPV
< 15 10 < NPV
< 20 15 < NPV
20 < NPV
[GeV]
τ
pT
102 true Tp)/true Tp-τ Tp(
-0.02 -0.01 0 0.01 0.02 0.03 0.04 0.05 0.06
multi prong 2012 Simulation
ATLAS Preliminary Integrated < 5 0 < NPV
< 10 5 < NPV
< 15 10 < NPV
< 20 15 < NPV
20 < NPV