ATLAS-CONF-2013-086 13August2013
ATLAS NOTE
ATLAS-CONF-2013-086
August 10, 2013
Jet Charge Studies with the ATLAS Detector Using √
s = 8 TeV Proton-Proton Collision Data
The ATLAS Collaboration
Abstract
The momentum-weighted sum of the charges of tracks associated to a jet provides an experimental handle on the electric charge of fundamental strongly-interacting particles.
Presented here is a study of thisjet chargeobservable for jets produced in dijet,W+jets, and semileptonict¯tevents using 5.8-15.2 fb−1of data with the ATLAS detector at √
s =8 TeV.
In addition to providing a constraint on hadronization models, jet charge has many possible applications in measurements and searches. This note documents the study of the modelling of jet charge and its performance as a charge-tagger, in order to establish this observable as a tool for future physics analyses.
c
Copyright 2013 CERN for the benefit of the ATLAS Collaboration.
Reproduction of this article or parts of it is allowed as specified in the CC-BY-3.0 license.
1 Introduction
Quarks are the only known elementary particles that transform non-trivially under all the Standard Model gauge groups. However, none of their quantum numbers can be measured directly. In particular, one cannot directly observe the electric charge of quarks produced in collisions which could distinguish pro- cesses such as W
→q q ¯
0from Z
→q q. Nevertheless, indirect charge measurements are possible. This ¯ note presents a study of a quark-charge sensitive jet observable first suggested by Field and Feynman [1]:
the momentum-weighted charge sum constructed from tracks in the jet. Called the jet charge, this ob- servable was first used experimentally in deep inelastic scattering studies at Fermilab [2,3], CERN [4–7], and Cornell [8] to establish a relationship between the quark model and hadrons.
Since then, jet charge observables have been used in many Standard Model measurements, including the parity-violating parameter A
bwith polarized electron beams [9,10], the weak mixing angle from the Z forward-backward asymmetry at LEP [11–13], the time dependent B
0d ↔B
0dmixing both at LEP [14,15]
and CDF [16], W boson charge discrimination in ALEPH [17] and the charge of the top quark at the Tevatron [18, 19] and the Large Hadron Collider (LHC) [20, 21]. Both the challenge of determining the nature of heavy objects reconstructed in fully-hadronic final-states and recent calculations of average jet charge and higher moments of the jet charge distribution [22, 23] have renewed interest in jet charge measurements at the LHC.
This note presents jet charge measurements in several final-states, using 8 TeV pp data recorded by the ATLAS experiment at the LHC, in order to both study heavy object reconstruction and constrain QCD predictions. Hadronically-decaying Ws produced in t¯ t
→(W
→ `ν)(W →)b b ¯ events are examined in order to characterize the performance of jet charge in identifying the charge of hadronically-decaying heavy particles. To assess the Monte Carlo modelling of jet charge over a broad energy range, the total charge of dijet events is measured in inclusive dijet events and the charge of individual quarks is measured using (W
→ µν)+jet events. The discussion is organized as follows: Section 2 describes the event selection and the simulated data used in these studies. Section 3 describes the jet selection and jet charge reconstruction. Section 4 presents the charge study of hadronically-decaying W bosons in t¯ t events, and Section 5 discusses the modelling of jet charge in jets from dijet and W
+jets events. Finally, Section 6 is devoted to the conclusions.
2 Data and Simulated Samples
The studies are performed using subsets of pp collision data recorded with the ATLAS detector at a centre-of-mass energy of 8 TeV between April and December 2012. The analyses measuring jet charge in W
±from t¯ t events and dijet charge in QCD dijet events use data from April-June, corresponding to 5.8 fb
−1. The studies of jet charge in W
+jets use data spread across many periods, amounting to 15.2 fb−1of the full 20.3 fb
−12012 dataset.
ATLAS is a multipurpose particle detector comprising four main subsystems: an inner tracking de- tector (ID), electromagnetic and hadronic calorimeters, and a muon spectrometer [24]. It has an approxi- mately cylindrical geometry with close to 4π solid angle coverage. Nearest to the beamline, the ID tracks charged-particle trajectories in a 2 T magnetic field produced by a superconducting solenoid, covering a pseudorapidity
1range
|η|<2.5 with pixel and silicon microstrip detectors (SCT), and additionally cov- ering the region
|η|<2.0 with a straw-tube transition radiation tracker (TRT). Outside of the solenoid are
1ATLAS uses a right-handed coordinate system with its origin at the nominal interaction point (IP) in the centre of the detector and thez-axis along the beam pipe. Thex-axis points from the IP to the centre of the LHC ring, and they-axis points upward. Cylindrical coordinates (r, φ) are used in the transverse plane,φbeing the azimuthal angle around the beam pipe. The psuedorapidity is defined in terms of the polar angleθasη=−ln tan(θ/2). Transverse momentum and energy are defined in the x−y-plane aspT =p·sin(θ) andET=E·sin(θ).
the electromagnetic and hadronic calorimeters. Liquid argon (LAr) is used as the active medium for the electromagnetic (EM) calorimeter in the central
|η|region and is used for both EM and hadronic energy measurements in the end-cap and forward regions up to
|η| <4.9. Hadronic energy measurement in the central region (|η|
<1.7) uses an iron-scintillator tile calorimeter. Surrounding the calorimetry is the muon spectrometer, a system of detectors for triggering up to
|η|<2.4 and precision tracking chambers up to
|η|<2.7 inside a magnetic field supplied by three large superconducting toroid magnets.
ATLAS records LHC collision events that are selected by a multi-level trigger system of dedicated hardware (level one, L1) and software (High Level Trigger, HLT) filters. Single lepton and jet triggers are used to select the data presented in this note. Monte Carlo (MC) generated events are processed with a full ATLAS detector and trigger simulation [25] based on the
Geant4[26] program and reconstructed using the same software as the experimental data. The high LHC bunch intensity in 2012 produced an average number of additional pp collisions per bunch crossing (pileup interactions) of 20.7 over the full run. The effects of these interactions within the triggered, preceding (with respect to the triggered), and subsequent bunch crossings are modelled by adding multiple minimum-bias events simulated with
PYTHIA 8[27] to the generated hard-scatter events, and then weighting the resulting sample to reflect the pileup distribution in the 2012 data.
The processes most relevant to this study are the production of t¯ t, W bosons in association with jets, and inclusive dijets. Top quark pair production is simulated with two next-to-leading-order (NLO) gen- erators. When studying W
±discrimination in t¯ t events,
MC@NLO[28] is used with the NLO parton density function (PDF) set
CT10[29,30], and parton showering and underlying event modelled with
HERWIG[31]
and
JIMMY[32], respectively. For jet charge studies in W
+jets, t¯ t is simulated with
PowHeg[33–35] using the PDF set
CT10and
PYTHIA6.4 [36] for fragmentation and hadronization with the Perugia2011C [37]
tune that employs the LO
CTEQ6L1PDF set [38]. In all t¯ t MC events, events are filtered by requiring at least one lepton consistent with the lepton trigger selection used for the measurements in which t¯ t is relevant. Before filtering, the t¯ t cross section is
σtt¯=238
+22−24pb for a top quark mass of 172.5 GeV. It has been calculated at next-to-next-to leading-order (NNLO) in QCD including resummation of next-to-next- to-leading logarithmic (NNLL) soft gluon terms with top
++2.0 [39–44]. The PDF and
αSuncertainties are calculated using the PDF4LHC prescription [45] with the MSTW2008 68% CL NNLO [46,47],
CT10NNLO and NNPDF2.3 5f FFN [48] PDF sets, and added in quadrature to the scale uncertainty. W
+jets production is based on
ALPGEN[49], with the parton shower modelled with
PYTHIA6.4 and the Peru- gia2011C tune; for these samples the production of heavy quarks is modelled separately, and overlapping phase space produced in the inclusive samples is removed. The QCD dijet samples used for the analysis described in Section 5.2 are generated with
PYTHIA 8.The single top (s- and Wt-channel) backgrounds are modelled with the same
MC@NLOsetup as t¯ t while the t-channel is modelled with
AcerMC[50] and the
CTEQ6L1PDF set interfaced with
PYTHIAusing the Perugia2011C tune. Like W
+jets, the Z
+jets backgrounds are modelled with
ALPGEN, PYTHIA6.4 showering, and the Perugia2011C tune. Dibosons are generated with
HERWIGusing the
CTEQ6L1PDF set. Multijet background distributions in the W
+jets analysis are estimated using data-driven techniquesdescribed later.
3 Jet Charge
The jet charge is computed for anti-k
tR
=0.4 jets [51] reconstructed from topological calorimeter
clusters [52] using the local cluster weighting (LCW) algorithm [53] and calibrated to account for the
detector response as well as to mitigate the contribution from pileup [54]. Jets are required to be central
(|η|
<2.1) so that their charged particles are within the
|η|<2.5 coverage of the ID. Jets strongly a
ffected
by additional pileup interactions are removed by a jet vertex fraction (JVF) cut, requiring that more than
25% of the total track momentum associated with jets with p
T <50 GeV comes from tracks consistent
with the primary collision vertex. Tracks used to calculate the jet charge are required to have p
T ≥500 MeV,
|η| <2.5, and a
χ2per degree of freedom (resulting from the track fit) less than 5.0. Additional quality criteria are applied to select tracks originating from the collision vertex: tracks must have
•
at least one hit in the pixel detector,
•
at least six hits in the silicon microstrip tracker,
•
a longitudinal impact parameter with respect to the primary vertex (PV)
|zPV0 | ≤2 mm, and
•
a transverse impact parameter with respect to the primary vertex
|d0PV| ≤2.5 mm.
Tracks are associated to jets using ghost association [55]: an assignment of tracks to jets by adding to the jet clustering process ghost versions of tracks that have the same direction but infinitesimally low p
T.
There is no unique way to define the jet charge. The most na¨ıve construction is to add up the charge of all tracks associated to a jet. However, this scheme is very sensitive to fluctuations from extraneous and missing tracks in relation to the originating parton. Therefore, a weighting scheme is introduced to suppress fluctuations. Using the tracks assigned by ghost association, the jet charge Q
jof a jet j is calculated using a transverse-momentum-weighting scheme [1]:
Q
j =1 (p
T j)
κX
i∈Tr
q
i×( p
iT)
κ,(1)
where Tr is the set of tracks associated to jet j, q
iis the charge (in units of the electron charge) determined from the curvature of track i with associated p
iT,
κis a free scaling parameter, and p
T jis the transverse momentum of the (calorimeter) jet. In the denominator, calorimeter energy is used to determine p
Tinstead of the sum of track momenta to account for the contribution from neutral particles. In this note,
κwill be one of 0.3, 0.6 or 1.0. Other weighting schemes have been used in the literature, such as pseudorapidity weighting [17].
4 Jet Charge Performance with Hadronic W Decays
The t¯ t events are selected with exactly one leptonic W
→ µ+νdecay to obtain a high-purity source of hadronically-decaying bosons with known charge in t¯ t
→(W
→`ν)(W→)b b ¯ final-states. Candidate events are chosen by requiring a p
T >25 GeV muon with
|η| <2.5 and missing transverse momentum E
missT >20 GeV; in addition, the sum of the missing transverse momentum and the transverse mass
2of the W reconstructed from the lepton and missing momentum is required to be greater than 60 GeV, as expected for leptonic W decays. Muons from heavy-flavour decays are suppressed by requiring the muon to be isolated in both the tracker and calorimeter from unclustered objects as well as from jets.
Events must also have at least four jets with
|η| <2.5 and p
T >25 GeV. Exactly two of these jets must be identified as b-quark jets using the multivariate discriminant ‘MV1’ [56] which includes impact parameter and secondary vertex information as inputs. The chosen MV1 working point corresponds to an average b-tagging e
fficiency of 70% for b-jets in simulated t¯ t events. Among the jets not selected by the b-tagger, there must exist a pair each with
|η|<2.1 and a dijet invariant mass within 30 GeV of the W boson mass. The two jets with invariant mass closest to the W boson mass are chosen as the W daughter candidates. This procedure selects a sample that is expected to contain more than 90% t¯ t production, as shown in Table 1 for the positive muon and negative muon channels separately.
2The transverse mass is defined asm2T =2plepT ETmiss(1−cos(∆φ)), where∆φis the azimuthal angle between the lepton and the missing transverse momentum direction.
The charge of the hadronically decaying W boson can be inferred from the measured charge of the selected muon. Therefore, the discrimination power of the jet charge can be directly determined in data.
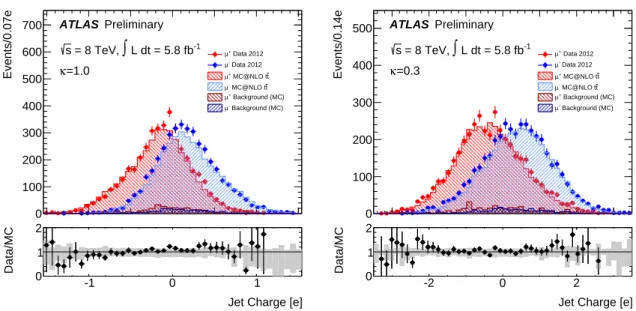
Figure 1 shows the distributions of dijet charge from W
+and W
−decays for two different values of the p
Tweighting factor
κfrom Eq. 1. The dijet charge is computed as the sum of the jet charges from the W boson daughter candidates. In
µ+events, the dijet charge tends to be negative, while the opposite is true for
µ−events, indicating that the dijet charge shows correlation with the charge of the hadronically- decaying W.
The ratio between data and MC in the lower panels of Fig. 1 includes the relevant systematic uncertainties: the jet energy scale uncertainty (JES), the jet energy resolution uncertainty (JER), tracking efficiency, b-tagging related uncertainties, and the uncertainty on the background normalisation. The JES and its uncertainty are determined from a combination of test-beam data, LHC collision data, and MC simulation [57]. The
±1σ variations are computed as a function of the p
Tand
ηof each reconstructed jet and are then propagated through to the jet charge distributions. To model the impact of the uncertainty on the energy resolution, reconstructed jet energies are smeared by a Gaussian function such that the new width incorporates a
+1σ variation of the JER uncertainty. The e
ffect on the charge distribution is symmetrized by taking the difference between the nominal and the shifted as 1σ. The JES and JER uncertainties are comparable and amount to about 20% of the nominal in the
|Q| <1 region for
κ=1.0.
Track reconstruction e
fficiency [58] and b-tagging uncertainties are much smaller than the JES and JER contributions (less than percent level). The b-tagging only affects acceptance and not the charge itself, unlike JES and JER which contribute to both acceptance and the actual charge via the jet calorimeter energy in the denominator of the jet charge definition. The uncertainty on the background normalisation is taken to be the same as the cross section uncertainty for t¯ t stated in Section 2, namely about 6%.
This is justified because the combinatorial background from ttbar represents more than 90% of the total background. All uncertainties are added in quadrature for each bin.
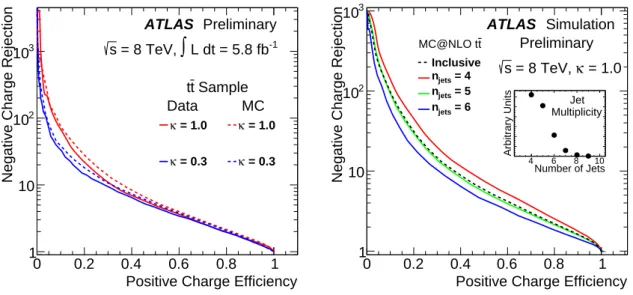
To quantify the discriminating power of the dijet charge, the rejection of negatively-charged W bosons is computed against the e
fficiency for selecting positively-charged W bosons. This relationship is shown in the left plot of Fig. 2. The points along the solid (dashed) lines correspond to cuts on the charge distribution in data (MC) for two values of
κ. Sinceµ±events correspond to hadronic W
∓, the horizontal axis is computed as the fraction of
µ−events beyond a given cut value with respect to all
µ−events and the vertical axis values are the reciprocals of the fraction from
µ+events past the same cut value, with respect to all
µ+events. A negative W rejection of about 6 is expected for a positive W boson efficiency of 50%, almost independent of
κ. Some degradation of the separation power between positive and negativeW bosons is expected to come from the combinatorial background, i.e. the two W daughter candidates may not have originated from or contain all of the partons associated with the W decay. Such an effect appears in both data and MC. Its impact can be estimated by selecting a purer sample, which reduces the
Process N
eventswith
µ+N
eventswith
µ−t¯ t 3575
±29 3522
±20
Single Top 126
±3 97
±3
W
+jets170
±29 91
±15
Z
+jets 23± 5 18
±3
Dibosons 3
±0.4 3
±0.3
Total MC 3895
±36 3729
±25
2012 Data 4095 3893
Table 1: The data and MC signal and background yields after all selections for the 5.8 fb
−1sample,
shown separately for
µ+and
µ−final states. The MC uncertainties are purely statistical and included
solely for the purposes of illustrating the sample composition.
Reconstructed Jet Charge (e)
Events/0.07e
0 100 200 300 400 500 600
700 ATLAS Preliminary L dt = 5.8 fb-1
∫
= 8 TeV, s
κ=1.0
Data 2012 µ+
Data 2012 µ-
t MC@NLO t µ+
t MC@NLO t µ-
Background (MC) µ+
Background (MC) µ-
Jet Charge [e]
-1 0 1
Data/MC
0 1 2
Reconstructed Jet Charge (e)
Events/0.14e
0 100 200 300 400
500 ATLAS Preliminary L dt = 5.8 fb-1
∫
= 8 TeV, s
κ=0.3
Data 2012 µ+
Data 2012 µ-
t MC@NLO t µ+
t MC@NLO t µ-
Background (MC) µ+
Background (MC) µ-
Jet Charge [e]
-2 0 2
Data/MC
0 1 2
Figure 1: The distribution of the sum of the jet charges from the two daughter candidates in hadronic W boson decays in semileptonic t¯ t events. The plot on the left is obtained with p
Tweighting factor
κ=1.0 and the right plot with
κ=0.3. Events with a
µ±correspond to a hadronically-decaying W
∓. The bottom panels show the data/MC ratios with the bands giving the systematic uncertainties described in the text.
combinatorial background. The right plot in Fig. 2 shows the positive W e
fficiency for di
fferent numbers of jets in the event. Jets are required to be above 25 GeV in p
T, pass the JVF requirements stated in the beginning of Section 3, and have
|η| <2.5. For example, for a fixed positive W efficiency of 50%, the rejection of negative W increases by 20% when the jet multiplicity decreases from six to four.
4.1 Charge Reconstruction Performance
The MC generation record (“MC truth”) can be used to study the dijet charge detector response, defined as the difference between the reconstructed and the true dijet charge in simulated events. Truth jets are clustered using the same algorithm and distance parameter as reconstructed jets; the clustering is performed with all stable interacting particles including muons. The truth jet charge is calculated using the particles’ true charge and p
T. The top row of Fig. 3 shows the mean dijet charge response versus the dijet track multiplicity for two values of
κin t¯ t MC events. The response is close to zero and constant with respect to the number of tracks. However, the resolution, parameterized by the distribution RMS, does depend on the number of tracks, as can be seen for the same values of
κin the bottom row of Fig. 3.
As expected, the RMS tends to decrease with the number of tracks as fluctuations about the mean are
suppressed. However, this trend is less evident at lower
κwhere the individual contribution to the jet
charge from any one track is decreased. There is also a strong correlation between p
Tand number of
tracks, which can further weaken the decreasing trend at high track multiplicity. The top row of Fig. 4
shows the mean response as a function of the hadronic W p
T, defined as the transverse momentum of the
dijet system formed from the W daughter candidates. As with track multiplicity, the response is constant
around zero (indicating very good agreement between the reconstructed and the true values), while the
RMS (bottom row of Fig. 4) decreases with the W boson p
T.
Positive Charge Efficiency
0 0.2 0.4 0.6 0.8 1
Negative Charge Rejection
1 10 102
103
ATLAS Preliminary L dt = 5.8 fb-1
∫
= 8 TeV, s
Data MC
Sample t
t
= 1.0 κ
= 0.3 κ = 1.0 κ
= 0.3 κ
Positive Charge Efficiency
0 0.2 0.4 0.6 0.8 1
Negative Charge Rejection
1 10 102
103
ATLAS Simulation Preliminary
= 1.0 κ = 8 TeV, s
t MC@NLO t
Inclusive
jets = 4 n
jets = 5 n
jets = 6 n
Number of Jets
4 6 8 10
Arbitrary Units
Jet Multiplicity
Figure 2: The power to reject W
−as a function of the efficiency to tag W
+as measured in semileptonic t¯ t events. Each point on the curve corresponds to a cut value on the charge distribution shown in Fig. 1.
The left plot shows results for inclusive jet multiplicity, and the right plot for several multiplicities and
κ=1.0.
4.2 Charge Tagging in a Boosted Topology
In t¯ t events, when the hadronic W has a large Lorentz boost, its decay products become merged in the lab frame, obscuring the resolution of the R
=0.4 jets that are usually associated with the W decay. In a clas- sical two-body decay of a boosted object, the separation
∆R
= p(
∆η)2+(
∆φ)2scales as 2m/p
T, where m (p
T) is the mass (transverse momentum) of the boosted object and
∆η(∆
φ) is the difference in pseu-dorapidity (azimuthal angle) between daughters in the lab frame. For a W boson (m
W =80.4 GeV [59]) with a p
Tof 200 GeV, a R
=1.0 (large-R) jet often captures most of the hadronic decay products. The jet charge is considered here also in this boosted scenario. The same
MC@NLOsemileptonic t¯ t MC events as described before are used as a source of boosted W bosons. In each event, the hadronically-decaying W is identified at truth level and its p
Tis required to be above 200 GeV. The anti-k
talgorithm is used to cluster the hadronic decay products of the W using an R
=1.0 radius parameter. A first definition of jet charge is the simple extension of the procedure described previously: tracks are assigned to the R
=1.0 jets in the event using ghost association and then Eq. 1 is used with the large-R (calorimeter) jet p
Tin the denominator. The distribution of this large-R jet charge is shown in Fig. 5 for
κ=1.0 and
κ =0.3. Large-R jets are chosen as the closest R
=1.0 jet in
∆R to the truth p
T >200 GeV hadronic W and
∆R(jet, W)
≤1.0 is required. Since jets are only matched geometrically to the truth W boson, a momentum and mass threshold are imposed: only reconstructed large-R jets with p
T >100 GeV and mass above 30 GeV are considered. The jet four-vector ( p) is corrected for pileup using the area correc- tion [54, 55] p
7→p
−ρ×A, where A is the four-vector jet area determined from ghost four-momenta and
ρis the median p
Tdensity per unit area in
η−φspace.
A modification of the large-R jet charge definition can be obtained using the technique of trim-
ming [60]. To form a trimmed large-R jet, first the jet constituent LCW topological clusters are grouped
using the k
talgorithm with a distance parameter of R
=0.3. Then, the clusters (and ghosts) of all the
subjets that carry less than 5% of the total jet momentum are removed from the list of constituents. The
remaining clusters determine the trimmed jet. The tracks associated to the trimmed jet are determined
by the ghost tracks that remain after subjets have been removed. The trimmed large-R jet charge is de-
Track Multiplicity
0 5 10 15 20
Mean Charge Response
-0.6 -0.4 -0.2 0 0.2 0.4
0.6 ATLAS Simulation
Preliminary = 8 TeV s
= 1.0 κ
t MC@NLO t
Track Multiplicity
0 5 10 15 20
Mean Charge Response
-0.6 -0.4 -0.2 0 0.2 0.4
0.6 ATLAS Simulation
Preliminary = 8 TeV s
= 0.3 κ
t MC@NLO t
Track Multiplicity
0 5 10 15 20
RMS of the Charge Response
0 0.2 0.4 0.6 0.8 1 1.2
1.4 ATLAS Simulation
Preliminary = 8 TeV s
= 1.0 κ
t MC@NLO t
Track Multiplicity
0 5 10 15 20 25
Arbitrary Units
Track Mult.
Distribution
Track Multiplicity
0 5 10 15 20
RMS of the Charge Response
0 0.2 0.4 0.6 0.8 1 1.2
1.4 ATLAS Simulation
Preliminary = 8 TeV s
= 0.3 κ
t MC@NLO t
Track Multiplicity
0 5 10 15 20 25
Arbitrary Units
Track Mult.
Distribution
Figure 3: For t¯ t simulated events, the mean (top) and RMS (bottom) distributions of the W daughter dijet
charge response as a function of the total number of tracks used to compute the charge for two values
of
κ. The insets show the (arbitrarily normalised) distribution of the number of tracks. The error barsindicate the statistical uncertainties on the number of MC events.
[GeV]
Hadronic W pT
0 50 100 150 200 250 300
Mean Charge Response
-0.6 -0.4 -0.2 0 0.2 0.4
0.6 ATLAS Simulation
Preliminary = 8 TeV s
= 1.0 κ
t MC@NLO t
[GeV]
Hadronic W pT
0 50 100 150 200 250 300
Mean Charge Response
-0.6 -0.4 -0.2 0 0.2 0.4
0.6 ATLAS Simulation
Preliminary = 8 TeV s
= 0.3 κ
t MC@NLO t
[GeV]
Hadronic W pT
0 50 100 150 200 250 300
RMS of the Charge Response
0 0.2 0.4 0.6 0.8 1 1.2
1.4 ATLAS Simulation
Preliminary = 8 TeV s
= 1.0 κ
t MC@NLO t
[GeV]
Had. W pT
0 100 200 300
Arbitrary Units
Had. W pT Distribution
[GeV]
Hadronic W pT
0 50 100 150 200 250 300
RMS of the Charge Response
0 0.2 0.4 0.6 0.8 1 1.2
1.4 ATLAS Simulation
Preliminary = 8 TeV s
= 0.3 κ
t MC@NLO t
[GeV]
Had. W pT
0 100 200 300
Arbitrary Units
Had. W pT Distribution
Figure 4: For t¯ t simulated events, the mean (top) and RMS (bottom) distributions of the W daughter dijet
charge response as a function of the transverse momentum of the dijet system for two values of
κ. Theinsets show the (arbitrarily normalised) distribution of the W candidate p
T. The error bars indicate the
statistical uncertainties on the number of MC events.
Jet Charge [e]
-3 -2 -1 0 1 2 3
Aribitrary Units
0 50 100 150 200
250 ATLAS Simulation Preliminary
> 200 GeV pT
truth
= 8 TeV W s
= 1.0 κ
-) W
+/ W R=1.0 ( anti-kt
-) W
+/ W R=1.0 Trimmed ( anti-kt
-) W
+/ W R=0.3 Subjets ( kt
t MC@NLO t
Jet Charge [e]
-3 -2 -1 0 1 2 3
Aribitrary Units
0 100 200 300 400 500
600 ATLAS Simulation Preliminary
> 200 GeV pT
truth
= 8 TeV W s
= 0.3 κ
-) W
+/ W R=1.0 ( anti-kt
-) W
+/ W R=1.0 Trimmed ( anti-kt
-) W
+/ W R=0.3 Subjets ( kt
t MC@NLO t
Figure 5: The charge of a boosted hadronically-decaying W boson in simulated semileptonic t¯ t events for
κ =1.0 (left) and
κ =0.3 (right). The hashed distributions are for the extension of the jet charge definition to large-R jets. The solid line histograms show the distribution of the large-R jet charge after trimming and the dashed lines show the sum of the charge of the two leading R
=0.3 k
tsubjets.
fined, as above, by summing over the tracks according to Eq. 1, with the (calorimeter) trimmed jet p
Tin the denominator. The trimmed large-R jet charge is shown in Fig. 5 for
κ =1.0 and
κ =0.3 for the same selection as for the untrimmed distribution. The trimmed and untrimmed jets have very similar distributions, with the untrimmed distributions being slightly wider. The reason why there is not much di
fference in the charge distributions is that trimming only removes 20% of tracks, all of which have a low p
trackT /pjetTweight (
. O(1%)) and thus do not contribute significantly to the charge. Trimming re-moves more than 20% of calorimeter clusters, but the tracks are required to match to the primary vertex and are thus significantly protected against pileup.
In the process of trimming, R
=0.3 subjets associated with each large-R jet are clustered together.
This gives rise to a third natural definition of the hadronic W charge, namely, the sum of the jet charge of the two leading k
tsubjets. Tracks are already matched with subjets from the ghost association to the R
=1.0 jets. This subjet charge is shown in Fig. 5 for
κ =1.0 and
κ =0.3. The subjet charge is much more spread out than the (trimmed) large-R jet charge. Part of the stretching comes simply from the definitions. To see this, consider an example in which the large-R jet transverse momentum P is parallel to the two subjet momenta p and q and assume that p
+q
=P. Then, since 1/ p
+1/q
>1/( p
+q)
=1/P, the subjet charge will tend to have a larger spread.
The performance of hadronic W charge-tagging in the boosted regime is shown in Fig. 6 in terms of the inverse e
fficiency (rejection) to identify a W
−as a function of the e
fficiency to identify a W
+. As expected, since the large-R charge and trimmed large-R charge distributions are very similar for the two definitions, the performance is similar. For a 50% W
+efficiency, a factor of four rejection is obtained.
The subjet charge performs significantly worse than the (trimmed) large-R jet charge. There are several
factors that contribute to the difference in performance. For example, there are many selected large-R
jets with three or more subjets. In these cases, the jet charge calculation does not include information
beyond what is contained in the two leading subjets. In addition, the decay products of the W may not
be fully merged into the R
=1.0 cone. The large-R jet charge may take this partial contribution into
account, but the subjet charge may miss information from tracks on the edge of the jet.
Positively Charged W Efficiency
0 0.2 0.4 0.6 0.8 1
Negatively Charged W Rejection
1 10 102
103
ATLAS Simulation Preliminary
> 200 GeV pT
truth
= 8 TeV W s
= 1.0 κ
R=1.0 anti-kt
R=1.0 Trimmed anti-kt
R=0.3 Subjets kt
t MC@NLO t
Positively Charged W Efficiency
0 0.2 0.4 0.6 0.8 1
Negatively Charged W Rejection
1 10 102
103
ATLAS Simulation Preliminary
> 200 GeV pT
truth
= 8 TeV W s
= 0.3 κ
R=1.0 anti-kt
R=1.0 Trimmed anti-kt
R=0.3 Subjets kt
t MC@NLO t
Figure 6: The inverse e
fficiency (rejection) of boosted W
−bosons as a function of the e
fficiency for boosted hadronic W
+bosons for simulated semileptonic t¯ t events and
κ=1.0 (left) and
κ =0.3 (right).
The three curves indicate the performance of three di
fferent ways of measuring the jet charge for boosted W bosons.
5 Jet Charge in W + jets and QCD Dijets
A study of jet charge in both W
+jets and QCD dijet samples is discussed in this section. In the following, a jet is considered to be a quark jet if the highest energy parton in the Monte Carlo truth record that falls within a
∆R
=0.4 cone of the jet axis is a quark, and the flavour of the quark jet is that of the energetic parton. In dijet events, the leading jet is a quark jet about 50% of the time (the other 50% consists of gluon jets). As this is computed with
PYTHIA, the calculation is only valid for the two leading jets indijet events, to which this study is restricted. This fraction depends on the process; in pp
→W(→
`ν)+jets, the fraction of quark jets is about 75% for the leading jet, as computed with
ALPGEN.5.1 Quark Jet Charge in W + jets
A complementary approach to study the charge-tagging performance to that described in Section 4 takes advantage of the large and fairly pure W
+jets samples collected in 2012. In these events, the leptonically-decaying W bosons can serve as an away-side tag to predict the charge of a recoiling quark jet, allowing studies of individual quark jet charges directly in data. At leading order, there are two processes which contribute to W
+jet production (see Fig. 7). In the left diagram of Fig. 7, there is no correlation betweenthe charge of the final-state gluon jet and the lepton from the W. However, in the right diagram, the charge of the final state ¯ q is opposite of the W, and thus the charge of the lepton from the W decay is anti-correlated with that of the leading jet. In 8 TeV pp collisions, the leading jet in W
+ ≥1 jet production is matched to a quark with electric charge sign opposite to that of the boson in approximately 70% of events, as calculated using
ALPGEN.How well the simulation models the data for the jet charge of single jets is explored using the lepton
from the W decay as a charge tag. Candidate W
+jets events are selected using criteria similar to thosedescribed in Section 4: requiring an isolated muon with p
T >25 GeV and
|η|<2.5, missing transverse
momentum E
missT >20 GeV, and the sum of missing transverse momentum and W transverse mass in
BRIEF ARTICLE
THE AUTHOR
q�
q
¯ q
W
g q�
g
q
¯ q W
1
Figure 7: The two leading-order Feynman diagrams that contribute to W
+jet production.
excess of 60 GeV. Events are then selected with at least one anti-k
tjet with p
T >25 GeV and
|η|<2.1.
This selection results in a dataset that is estimated from simulation to contain 79% W
+jets events. Atotal of 15.2 fb
−1of 8 TeV collision data was processed for this study.
Dominant backgrounds to W
+jets production include QCD multijets,Z
+jets, and smaller contribu-tions from t¯ t production. All but the QCD multijets are estimated with Monte Carlo simulation. In multijet events, muons arise from the decay of heavy-flavour hadrons, the decay-in-flight of kaons or pions, and from misreconstructed charged hadrons. These diverse sources of non-prompt or fake muons are modelled using data. First, the efficiency to select a signal muon is measured using signal-enriched samples and the e
fficiency to select a non-prompt or fake muon is measured in background-enriched samples. The signal-enriched sample is Z
→µ+µ−while several background-enriched samples are used:
non-isolated muons, muons in events with low E
Tmiss, and muons with large track impact parameter d
0. The measured set of e
fficiencies is applied to events that fail the muon isolation requirement, but oth- erwise pass the event selection, and these weighted events are used to model the multijet background shapes. To constrain the normalisation of this background, as well as the large uncertainty of the MC prediction for W
+≥1 jet, these two components are simultaneously fit in the signal region, as described below.
To constrain the large uncertainty on the Monte Carlo prediction for W
+ ≥1 jets and the multijet model described above, the normalisation of these two background components are simultaneously fit to the data. The weighted sample of non-isolated muon candidates and the summed Monte Carlo W
/Z
+jet prediction are fit to the
∆φ(µ,jet) distribution in the data, with the diboson and top predictions fixed to their nominal values from the MC prediction. The multijet component is increased by a factor of 1.6 from the uncorrected prediction (pre-fit) while the W
/Z
+jet contribution is reduced by a factor of 0.93.
Further details of the multijet estimation procedure can be found in Appendix A.
Process N
events(15.2 fb
−1) f
quarkf
correctW
→µν+jets5852000
±8500 0.7365
±0.0009 0.960
±0.003 t¯ t 306000
±570 0.9154
±0.0003 0.622
±0.001 Z
→``+jets407000
±1100 0.663
±0.002 0.494
±0.004 W
→τν+jets177000
±1300 0.705
±0.004 0.97
±0.02 Multi-jets 607000
±470
Table 2: Estimated dominant contributions to the selected W
+jets sample. The f
quarkcolumn gives the fraction of events in which the leading jet is expected to be a quark jet and the f
correctcolumn shows the fraction of such events in which the parton charge is opposite the
µcharge. Statistical errors are shown on the predicted number of events.
The sample composition derived after this fit is listed in Table 2, together with the fractions of events
where the leading jet is matched to a quark, f
quark, and where the quark charge sign is correctly identified
by the lepton charge tag, f
correct. For (W
→ µν)+jets,f
correct <1 is due to the contributions of interac-
tions producing more than one final-state parton. As expected, many of the background processes have
significantly weaker correlation between the lepton charge and the expected jet charge than the signal W
+jets process. Figure 8 compares the predicted and observed jet charge for the leading jet in events tagged with positive or negative muons. In each subfigure, the lower plot shows the ratio between data and Monte Carlo, together with bands giving the total uncertainty from the jet energy scale and resolution and the track reconstruction e
fficiency. Jets with no tracks populate the charge
=0 bin. There are more W
+than W
−produced at the LHC because of the valence up to down quark ratio in protons. As expected, the jet charge shows a slight anti-correlation with the charge of the muon, as evidenced in the shift of the histograms relative to each other. The separation of the single quark distributions is weaker than t¯ t events, as expected. The contribution from gluon jets also reduces the magnitude of the anti-correlation between the leading jet charge and the W charge. Figure 9 shows the average and width of the charge distribution in positively and negatively tagged events as a function of the jet p
T. The decrease of the separation as a function of p
Tis partly due to the relative increase in the charge symmetric background in the high p
Tregion. The mean and width of the distributions in the data are well modelled by the simulation.
5.2 Total Dijet and Single Jet Charge
In addition to using leptonic handles, fully hadronic events are studied to understand the modelling and performance of jet charge. Data and MC events are selected from the suite of single-jet triggers with (o
ffline) thresholds ranging from 20 to 520 GeV of transverse momentum. Due to the high trigger rate, all of these triggers are prescaled (in data) except for the highest two (410 GeV and 520 GeV). The jets under study are anti-k
tR
=0.4 jets with
|η| ≤2.1.
5.2.1 Dijet Charge
The distribution of the dijet charge — the sum of the jet charge for the two leading jets - is shown in Fig. 10 for high and low p
Tleading jets, and for data and MC. Since the QCD dijet cross section is not well predicted by the MC, the simulation is normalised here to the areas of the distributions in the data;
therefore, the systematic uncertainty band, which includes the JES, JER, and track e
fficiency (as in t¯ t), reflects shape uncertainties only; the bin by bin fluctuations are such that for a given global systematic shift, the total normalization is constant. In general, the dijet charge is well modelled by PYTHIA, but note that only experimental uncertainties are considered in this preliminary study; uncertainties related to MC modeling of for instance fragmentation, showering, and PDFs are not considered. In Fig. 11, the dijet charge is shown to be an increasing function of the dijet mass in both data and MC. This trend is likely due to the increase in the valence quark PDF at large momentum fraction [23]. The MC tends to underestimate the dijet charge, which may indicate that the valence quark content in the PDF is underestimated at high momentum fraction.
5.2.2 Single Jet Charge
In addition to dijet charge, the charge of single jets is studied and may be used to constrain MC generators
through the relative fractions of quark flavours. Figure 12 shows the mean and width of the single jet
charge distributions for the leading jet in dijet events. To remove the dependence on tails, the mean and
width (defined as the RMS) are computed over a range of
|Qj| <2. As in Fig. 11, the MC undershoots
the data in the left plot of Fig.12. Another observable potentially sensitive to the quark composition is
the di
fference between jet charge in dijet events,
h|Qj1−Q
j2|i, which is shown in Fig. 13. This variableis sensitive because many dijet events correspond to up and gluon or down and gluon jet combinations
and thus the difference may provide a handle on the up/down quark jet composition.
Qjet
-1.5 -1 -0.5 0 0.5 1 1.5
Events/0.06 e
0 100 200 300 400 500 600
3
×10
Data 2012 µ+
Data 2012 µ-
LPGEN +jets A W+
LPGEN +jets A W-
background µ+
background µ-
ATLAS Preliminary fb-1
=15.2 dt
∫L = 8 TeV s
< 100 GeV
T
=1.0; 25 < p κ
Jet Charge [e]
-1.5 -1 -0.5 0 0.5 1 1.5
Data/MC
0.75 1 1.25
(a)
Qjet
-2 -1.5 -1 -0.5 0 0.5 1 1.5 2
Events/0.06 e
0 50 100 150 200 250
3
×10
Data 2012 µ+
Data 2012 µ-
LPGEN +jets A W+
LPGEN +jets A W-
background µ+
background µ-
ATLAS Preliminary fb-1
=15.2 dt
∫ L = 8 TeV s
< 100 GeV
T
=0.3; 25 < p κ
Jet Charge [e]
-2 -1.5 -1 -0.5 0 0.5 1 1.5 2
Data/MC
0.75 1 1.25
(b)
Qjet
-1.5 -1 -0.5 0 0.5 1 1.5
Events/0.06 e
0 2000 4000 6000 8000
10000 µ+ Data 2012
Data 2012 µ-
LPGEN +jets A W+
LPGEN +jets A W-
background µ+
background µ-
ATLAS Preliminary fb-1
=15.2 dt
∫L = 8 TeV s
< 300 GeV
T
=1.0; 200 < p κ
Jet Charge [e]
-1.5 -1 -0.5 0 0.5 1 1.5
Data/MC
0.75 1 1.25
(c)
Qjet
-2 -1.5 -1 -0.5 0 0.5 1 1.5 2
Events/0.06 e
0 500 1000 1500 2000 2500 3000 3500
Data 2012 µ+
Data 2012 µ-
LPGEN +jets A W+
LPGEN +jets A W-
background µ+
background µ-
ATLAS Preliminary fb-1
=15.2 dt
∫ L = 8 TeV s
< 300 GeV
T
=0.3; 200 < p κ
Jet Charge [e]
-2 -1.5 -1 -0.5 0 0.5 1 1.5 2
Data/MC
0.75 1 1.25
(d)
Figure 8: Jet charge measurements in W
+jets events with positive and negative lepton charge for data
(points) and MC (hatched histograms), for
κ=1 (a,c) and
κ=0.3 (b,d) and for two jet p
Tranges. W
+jets
in these figures includes W→
τ+jets; all other processes are classified as background. For each figure,the ratio between data and MC is displayed in the lower plot, together with the total uncertainty on the
prediction.
100 200 300 400 500 600
Average Jet Charge [e]
-0.2 -0.1 0 0.1 0.2 0.3
0.4 W+jets Sample
Data 2012 µ+
Data 2012 µ-
+ MC µ
- MC µ ATLAS Preliminary
fb-1
=15.2 dt
∫L = 8 TeV s
κ=1.0
[GeV]
Jet pT
100 200 300 400 500 600
Data/MC 0.4 1
1.6 100 200 300 400 500 600
Width of Jet Charge Distribution [e]
0 0.05 0.1 0.15 0.2 0.25 0.3 0.35 0.4
W+jets Sample Data 2012 µ+
Data 2012 µ-
+ MC µ
- MC µ ATLAS Preliminary
fb-1
=15.2 dt
∫ L = 8 TeV s
κ=1.0
[GeV]
Jet pT
100 200 300 400 500 600
Data/MC 0.8 1 1.2
Figure 9: Transverse-momentum dependence of the single jet charge in W
+jets events for data and MC.The latter includes the W
+jets signal and backgrounds estimated as described in the text. On the left, the average jet charge in events with positive and negative muons is shown as a function of the jet p
T. The error bars are the statistical uncertainty on the mean of the distribution in each p
Tbin. On the right, the width of the jet charge distribution is shown as a function of the jet p
T. The bands in the lower plots show the total uncertainty on the MC prediction.
The power of the jet charge to differentiate jet flavours can be further investigated using the truth record in the MC. Using the parton-matching scheme described earlier in this section, the truth charge distributions are separated according to the jet flavour (Fig. 14). There is significant discrimination be- tween the charge sign of the quark at the generator level, but not between flavour types with the same charge. The rejection of jets with a flavour corresponding to a negative charged parton as a function of the e
fficiency for jets with a flavour corresponding to a positively charged parton is shown in the left plot of Fig. 15. For an efficiency of about 50%, there is a rejection of about 6, independent of
κ. Thediscrimination between quark and gluon jets is quantified in the right plot of Fig. 15. A rejection of about 3 against gluon jets is expected for an e
fficiency of 50% for quark jets. While not competitive with ded- icated quark/gluon taggers [61] on its own, the jet charge could be used as an additional discriminating variable within a multivariate approach.
The discrimination is slightly degraded for heavy-flavour jets. The distributions of positive and
negative charm and bottom quarks is shown in Fig. 16 where the inclusive samples used for comparison
are the down type quark jets for the b-quark jets and the up type quark jets for c-quark jet charge. Both
plots of Fig. 16 show that the ratio of heavy-quark jet charge to the inclusive jet charge of the same charge
type is low for positive flavour in the positive region (thus high in the negative tail) and vice versa. This
means that the heavy-flavour distributions are shifted towards the centre and thus the separation between
positive and negative charge is reduced. This shift is quantified by noting that the di
fference between
the means of the two bottom-flavour distributions is 0.35
±0.02 (statistical uncertainty only) while the
difference for the inclusive sample is 0.42± 0.01. Likewise for charm-flavour jets, the difference in means
is 0.40
±0.02 while for the inclusive sample the di
fference is 0.58
±0.01. This e
ffect cannot be due to
the selection on the track vertices, as the d
0cut is much larger than the decay length of heavy-flavour
mesons. It might be due to differences in the fragmentation, although further investigations are needed
Reconstructed Jet Charge (e)
Events/0.05e
0 2 4 6 8 10 12 14 16 18
103
×
ATLAS Preliminary L dt = 5.8 fb-1
∫
= 8 TeV, s
κ=1.0
< 410 GeV 250 GeV < pT
Pythia Dijets Data
Reconstructed Jet Charge [e]
-1 0 1
Data/MC 0
1 2
Reconstructed Jet Charge [e]
Events/0.14e
0 2 4 6 8 10 12 14 16
103
×
ATLAS Preliminary L dt = 5.8 fb-1
∫
= 8 TeV, s
κ=0.3
< 410 GeV 250 GeV < pT
Pythia Dijets Data
Reconstructed Jet Charge [e]
-2 0 2
Data/MC 0
1 2
Events/0.05e
0 2 4 6 8 10
103
×
ATLAS Preliminary L dt = 5.8 fb-1
∫
= 8 TeV, s
κ=1.0
< 70 GeV 60 GeV < pT
Pythia Dijets Data
Reconstructed Jet Charge [e]
-1 0 1
Data/MC 0
1 2
Events/0.14e
0 1 2 3 4 5 6 7 8 9
103
×
ATLAS Preliminary L dt = 5.8 fb-1
∫
= 8 TeV, s
κ=0.3
< 70 GeV 60 GeV < pT
Pythia Dijets Data
Reconstructed Jet Charge [e]
-2 0 2
Data/MC 0
1 2
Figure 10: The top (bottom) row shows the sum of the charges of the two leading jets in dijet events for two bins of the leading jet p
T. Two values of the p
Tweighting factor are shown:
κ =1.0 on the left and
κ =0.3 on the right. The lower panels show the ratios between data and MC, with the systematic uncertainty described in the text indicated by the grey band.
15
Dijet Mass [GeV]
Dijet Charge [e]
-0.05 0 0.05 0.1 0.15 0.2 0.25 0.3
ATLAS Preliminary L dt = 5.8 fb-1
∫
= 8 TeV, s
κ=1.0 κ=0.3
Pythia Dijets Data
Dijet Mass [GeV]
0 500 1000 1500
Data/MC
0 1 2
Figure 11: The dependence of the dijet charge on the dijet mass for two di
fferent values of
κin data and MC for a dijet sample. The uncertainty band includes the systematic sources discussed in the text.
[GeV]
Leading Jet pT
0 100 200 300 400 500 600
Average Leading Jet Charge [e]
0 0.005 0.01 0.015 0.02 0.025 0.03 0.035 0.04
ATLAS Preliminary L dt = 5.8 fb-1
∫
= 8 TeV, s
κ=1.0
Pythia Dijets Data
[GeV]
Leading Jet pT
0 100 200 300 400 500 600
Width of Jet Charge Distribution [e]
0.18 0.19 0.2 0.21 0.22 0.23 0.24 0.25 0.26 0.27 0.28
ATLAS Preliminary L dt = 5.8 fb-1
∫
= 8 TeV, s
κ=1.0
Data Pythia Dijets
Figure 12: The average value (left) and width (right) of the jet charge distribution for the leading jet in dijet events, as a function of the jet p
T. The width is defined as the RMS computed over the range
|Qj|<
2 to reduce the dependence on tails. The mean is computed over the same range for consistency.
The uncertainty band includes the systematic sources discussed in the text.
[GeV]
Leading Jet p
T0 100 200 300 400 500 600
Dijet Charge Difference [e]
0.2 0.21 0.22 0.23 0.24 0.25 0.26 0.27 0.28 0.29 0.3
ATLAS Preliminary L dt = 5.8 fb
-1∫
= 8 TeV, s
κ =1.0
Data
Pythia Dijets
Figure 13: Average di
fference between jet charge in dijet events,
h|Qj1−Q
j2|i, as a function of leadingjet p
T. The uncertainty band includes the systematic sources discussed in the text.
to draw firmer conclusions. However since the e
ffect is small, the degradation in separation is expected to be small; this may be important for W
±discrimination as one of the decay products could be a charm quark.
The MC can be used to investigate the performance of jet charge reconstruction. As above, jet charge response is defined as the difference between the (MC) reconstructed jet charge and the truth jet charge.
The mean of the jet charge response is shown as a function of jet p
Tin the left plot of Fig. 17 and as a function of the number of charged tracks (n
track) within the jet in the left plot of Fig. 18. The response is nearly independent of both the p
Tand the number of tracks. There is a slight decreasing trend in the response with p
T. A contributing factor to the trend is the merging of tracks at high p
Tso that
|Qreco|<|Qtrue|. Since the fraction of positive quark jets increases with