ATLAS-CONF-2012-053 30May2012
ATLAS NOTE
ATLAS-CONF-2012-053
May 30, 2012
Probing the measurement of jet energies with the ATLAS detector using Z + jet events from proton-proton collisions at √
s = 7 TeV
The ATLAS Collaboration
Abstract
The energy calibration of jets measured with the ATLAS detector at the LHC is probed
in situusing the direct transverse momentum balance
pjetT /pZTbetween a jet in the central region of the detector (
|η|<1.2) and a
Zboson decaying into an
e+e−pair. Two calibration schemes are studied using a data set corresponding to an integrated luminosity of 4.7 fb
−1of proton-proton collisions at a centre-of-mass energy of
√s =
7 TeV. The analysis is carried out for
pZTbetween 17 GeV and 260 GeV. The
pTbalance measured in the data is a few percent lower than in the simulation. The precision achieved with this
in situmethod is about 10% at low
pTand 1% to 2% for
pT >30 GeV.
c Copyright 2012 CERN for the benefit of the ATLAS Collaboration.
Reproduction of this article or parts of it is allowed as specified in the CC-BY-3.0 license.
Introduction
Jets are the dominant feature of high energy proton-proton interactions at the Large Hadron Collider (LHC) at CERN. They are key ingredients for many physics measurements and for searches for new phe- nomena. Jets are observed as groups of topologically related energy deposits in the ATLAS calorimeters associated with tracks of charged particles as measured in the inner detector. They are reconstructed with the anti-k
talgorithm [1].
An initial calibration of the jet energies was performed using Monte Carlo simulation. The jet energy scale uncertainty, described in Ref. [2], was originally based on information available before the first LHC collisions. It also exploited transverse momentum (p
T) balance in events with only two jets at high transverse momenta produced in situ. A reduced uncertainty of about 2.5% in the central calorimeter region was achieved over a wide momentum range of 60 GeV
<p
T <800 GeV based on the increased knowledge of the detector performance obtained during the analysis of the first year of ATLAS data taking [3]. This estimation used single hadron response measurements [4], systematic Monte Carlo simulation variations, and in situ techniques where the jet p
Tis compared to the p
Tof a reference object such as a photon. These measurements were done based on the 2010 data set corresponding to an integrated luminosity of 38 pb
−1.
In 2011, the ATLAS detector collected proton-proton collision data at a centre-of-mass energy of
√
s
=7 TeV corresponding to an integrated luminosity of 4.7 fb
−1. The larger data set makes it possible to further improve the precision of the energy measurement and to adjust the calibration of jets based on detailed comparisons of data and Monte Carlo (MC) simulation using in situ techniques.
This note presents the results of one of these in situ techniques, which uses events where a Z boson decaying to an e
+e
−pair and a jet are produced that balance each other in the transverse plane. The p
Tbalance is compared in data and in MC simulation, and a study of systematic uncertainties on the data-to-MC ratio is carried out. Previous results from a similar analysis with one-fifth of the data have been reported in Ref. [5]. A similar analysis using the p
Tbalance between a photon and a jet (γ
+jet) is reported in [6]. The advantage of Z
+jet events is the possibility of probing low p
Tjets, which are difficult to reach with
γ+jet events due to trigger thresholds and background contamination in that region. On the other hand,
γ+jet events benefit from larger statistics for p
Tabove 150 GeV. In the Z
+jet and
γ+jet analyses, jets with a pseudorapidity
1|η|<1.2 are probed. Jets beyond
|η|=1.2 are calibrated with respect to jets within
|η|<1.2 using a dijet balance technique, as described in Ref. [7].
1 The ATLAS detector and data sample
The ATLAS detector [8] is a multi-purpose device designed to observe particles produced in proton- proton collisions. It consists of several sub-detectors located at different distances from the interaction point. The innermost layer consists of a tracking system immersed in a 2 T magnetic field created by a solenoid magnet. It covers the pseudorapidity range up to
|η| <2.5 and consists of a silicon pixel detector, a silicon microstrip detector and a transition radiation tracker.
The inner detector is surrounded by electromagnetic and hadronic sampling calorimeters, which pro- vide coverage in the region
|η| <4.9. The electromagnetic calorimeter is a sampling calorimeter with liquid argon (LAr) as active material and lead as absorber material. Its accordion geometry ensures azimuthally uniform energy response. The hadronic calorimeters have an active medium of plastic scin- tillator and steel absorbers for the barrel and extended barrels, which together cover the region
|η|<1.7.
1ATLAS uses a right-handed coordinate system with its origin at the nominal interaction point (IP) in the centre of the detector and thez-axis along the beam pipe. Thex-axis points from the IP to the centre of the LHC ring, and they-axis points upward. Cylindrical coordinates (r, φ) are used in the transverse plane,φbeing the azimuthal angle around the beam pipe. The pseudorapidity is defined in terms of the polar angleθasη=−ln tan(θ/2).
The hadronic endcap calorimeters make use of liquid argon and copper in the region 1.5
<|η|<3.2. The forward calorimeters are LAr/copper and LAr/tungsten detectors which extend the calorimeter coverage to
|η|<4.9.
A muon spectrometer composed of a series of toroidal magnets and tracking chambers is located outside the calorimeter system.
The data sample considered in this note has been collected with all ATLAS sub-detectors operational.
It corresponds to a total integrated luminosity of 4.7 fb
−1of proton-proton collisions at
√s
=7 TeV, collected between April and October of 2011 with a bunch spacing of 50 ns. The average number of interactions per bunch crossing is about 15 for the highest luminosity data used in this analysis.
2 Monte Carlo simulation
A sample of simulated Z
→e
+e
−events is generated using P
v6.425 [9] with the modified leading- order (LO**) parton distribution functions (PDFs) set MRSTMCal [10]. The simulation uses a 2
→1 matrix element to model the hard subprocess, and p
T-ordered parton showers to model additional parton radiation in the leading-logarithmic approximation [11]. In addition, weights are applied to the first branching of the shower, so as to bring agreement with the matrix-element rate in the hard-emission region. Multiple parton interactions (MPI) [12], as well as fragmentation and hadronisation based on the Lund string model [13] are also simulated. Model parameters describing non-perturbative physics effects have been adjusted to data characterizing the underlying event (UE), resulting in the ATLAS AUET2B MRST LO** tune [14].
In addition, a Z(
→e
+e
−)+jets sample is produced using A
v2.13 [15] interfaced to H
-
v6.510 [16] for parton shower and fragmentation into particles, and to J
v4.31 [17] to model UE contributions (with the ATLAS AUET2 CTEQ6L1 tune [18]). CTEQ6L1 [19] PDFs are employed.
A
is a leading-order matrix-element generator for hard multi-parton processes (2
→n) in hadronic collisions. Parton showers are matched to the matrix element with the MLM matching scheme [20]. A cluster model is used by H
for hadronisation [21].
The MC samples are generated with additional minimum bias (pile-up) interactions [18], using P
-
v6.425, overlaid on the hard scattering event in order to account for multiple proton-proton interactions in the same bunch crossing (in-time pile-up). Additional proton-proton collisions from nearby bunch crossings within trains of consecutive bunches (out-of-time pile-up) are also simulated. MC samples are then weighted such that the distribution of the average number of interactions per bunch crossing matches the data distribution.
The MC-generated samples are passed through a full simulation of the ATLAS detector and trigger, based on G
4 [22]. The simulated events are reconstructed and analysed with the same analysis chain as the data.
3 Jet reconstruction and calibration
Jets are reconstructed using the anti-k
talgorithm [1] with distance parameters R
=0.4 and R
=0.6 using the F
J
software [23, 24]. The four-momentum recombination scheme is used. The inputs to the jet algorithm are stable simulated particles (truth jets) or energy deposits in the calorimeter (calorimeter jets). The inputs to calorimeter jets used in this analysis are topological calorimeter clusters (topo-clust- ers) [3, 25, 26]. Only topo-clusters with a positive energy are considered as input to the jet finding.
ATLAS has developed several jet calibration schemes [27] with different levels of complexity and
different sensitivities to systematic effects, which are complementary in their contribution to the jet en-
ergy measurement. Each calibration scheme starts from the measured calorimeter energy at the electro-
magnetic (EM) energy scale [25, 28–35], which is designed to measure the energy deposited by electro- magnetic showers. The local cluster weighting (LCW) calibration method first combines topologically connected calorimeter cells and classifies these clusters as either being of electromagnetic or hadronic origin. Based on this classification, energy corrections are applied which have been derived from sin- gle pion Monte Carlo simulations. Dedicated corrections are derived for the effect of calorimeter non- compensation, for signal losses due to the noise thresholds used in the topo-clusters, and for the energy lost in non-instrumented regions. The final jet energy calibration (or jet energy scale, JES) is derived as a simple correction relating the calorimeter’s response to the true jet energy. It can be applied to EM scale jets with the resulting calibrated jets referred to as EM+JES jets, or to LCW calibrated jets with the resulting jets referred to as LCW+JES jets.
The JES correction is derived from a MC sample including pile-up events. The dependence of the jet response on the number of primary vertices (N
PV) and the average number of interactions per bunch- crossing (µ) is removed by applying a pile-up offset correction at the EM or LCW scale before applying the JES correction. A correction depending on both N
PVand
µis needed in order to take into account effects from both in-time and out-of-time pile-up.
4 Description of the p
Tbalance method
In events where one Z boson and only one jet are produced, the jet recoils against the Z boson, ensuring approximate momentum balance between them in the transverse plane. The direct p
Tbalance technique exploits this relationship in order to improve the jet energy calibration. If the Z boson decays into electrons, its four-momentum is reconstructed using the electrons, which are accurately measured in the electromagnetic calorimeter and the inner detector [35]. Ideally, if the jet includes all the particles that recoil against the Z boson, and if the electron energies are perfectly measured, the response of the jet in the calorimeters can be determined by using p
ZTas the reference truth jet p
T. However, this measurement is affected by the following:
1. uncertainty on the electron energy measurements;
2. particles from the fragmentation of the leading parton that are not included in the jet cone (out-of- cone radiation);
3. additional parton radiation contributing to the recoil against the Z boson;
4. contribution from the underlying event; and 5. in-time and out-of-time pile-up.
Therefore, the p
Tbalance between a Z boson and a jet (p
jetT /prefT) is not used to estimate the jet response, but only to assess how well the MC simulation can reproduce the data. Here, the reference p
refT =p
ZT× |cos(∆φ(jet, Z))
|, where
∆φ(jet,Z) is the azimuthal angle between the Z boson and the jet, is used instead of p
ZTin order to partly correct for additional parton radiation transverse to the jet axis in the transverse plane.
The direct p
Tbalance technique is used to adjust the jet calibration in the data by comparing the
p
jetT/p
refTratio in the data with this ratio in the simulation, for the two calibration schemes EM+JES and
LCW+JES described in Section 3. The effects altering the data-to-MC ratio are evaluated by changing
selection cuts and event generators.
5 Event selection
5.1 Selection of Z events
Events are selected online using a trigger logic that requires the presence of at least one well-identified electron with transverse energy (E
eT) above 20 GeV (or 22 GeV, depending on the data taking period) or two well-identified electrons with E
eT >12 GeV, in the region
|η|<2.5 [36]. Events are also required to have a primary hard scattering vertex with at least three tracks associated to it. The hard scattering vertex is chosen to be the primary vertex with the largest
Σ(p
trackT)
2, where the sum runs over all tracks used in the vertex fit. This renders the contribution from fake vertices due to beam backgrounds to be negligible.
Details of electron reconstruction and identification can be found in Ref. [35]. Three levels of electron identification quality are defined, based on different requirements on shower shapes, track quality, and track-cluster matching. The intermediate one (“medium”) is used in this analysis. Events are required to contain exactly two such electron candidates with E
eT >20 GeV and pseudorapidity in the range
|ηe| <2.47 (where the transition region between calorimeter sections 1.37
< |ηe| <1.52 has been excluded, as well as small regions where an accurate energy measurement is not possible due to temporary hardware failures). If these electrons have opposite-sign charge and an invariant mass in the range 66 GeV
<M
e+e− <116 GeV, the event is kept and the four-momentum of the Z boson candidate is reconstructed from the four-momenta of the two electrons. The transverse momentum distribution of these Z boson candidates is shown in Figure 1.
[GeV]
Z
pT
20 30 40 50 60 100 200 300
]-1 [GeVZ TdN / dp
10 102
103
104
105 Data 2011
) (PYTHIA) e-
e+
→ Z(
ATLAS Preliminary s = 7 TeV,
∫
L dt = 4.7 fb-1Figure 1: The Z boson p
Tdistribution in selected Z events. Data and prediction from the Z
→e
+e
−P
simulation, normalized to the observed number of events, are compared.
5.2 Jet selection
All jets within the full calorimeter acceptance and with a JES-corrected transverse momentum p
jetT >12 GeV are considered. For each jet, a quantity called jet vertex fraction (JVF) is computed. Tracks are
matched to the jet and to each reconstructed primary vertex. For each vertex, denoted by the index i, the
scalar sum of the p
Tof these tracks,
Σi, is calculated. The JVF variable is defined as the p
Tsum for the
hard scattering vertex,
Σ0, divided by the sum of
Σiover all primary vertices. This variable is used to
estimate the degree of pile-up contamination of a jet based on the vertex information.
The highest p
T(leading) jet must pass quality criteria [37], have a JVF
>0.5, and be in the fiducial region
|ηjet| <1.2. Regions where an accurate energy measurement is not possible due to temporary hardware failures are excluded. Furthermore, the leading jet is required to be isolated from the two electrons stemming from the Z boson. The distance
∆R = p(∆η)
2+(∆φ)
2between the jet and each of the two electrons is required to be
∆R>0.35 (0.5) for anti-k
tjets with R
=0.4 (0.6).
The presence of additional high-p
Tparton radiation altering the balance between the Z boson and the leading jet is suppressed by requiring that the sub-leading jet has a calibrated p
Tless than 20% of the p
Tof the Z boson, with a minimal p
Tof 12 GeV. For sub-leading jets within the tracking acceptance, this cut is only applied if the jet has a JVF
>0.75.
Variable Cut
E
eT >20 GeV
|ηe| <
2.47, excluding calorimeter transition regions p
jetT >12 GeV
|ηjet| <
1.2
∆R(jet,electrons) >
0.35 (0.5) for anti-k
tjets with R
=0.4 (0.6) p
jet2T /pZT <0.2
Table 1: Summary of the event selection criteria applied in this analysis.
A summary of the event selection is presented in Table 1.
6 Measurement of the p
Tbalance
The mean value of the p
jetT /p
refTratio distribution is computed in bins of p
refTand
∆φ(jet,Z). This mean value is obtained with two methods, depending on p
refT.
1. In the low p
refTregion (17 GeV
≤p
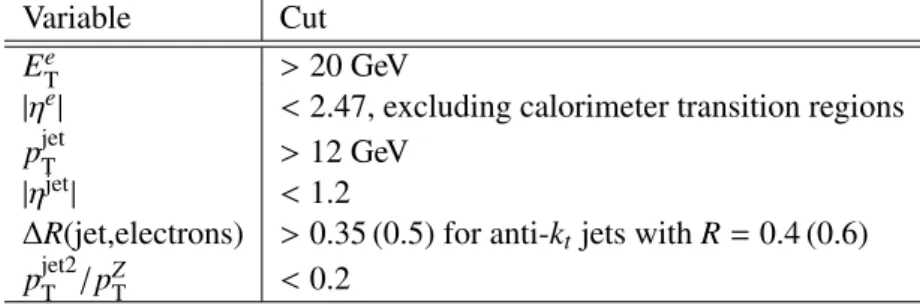
refT <35 GeV), it is obtained by a maximum likelihood fit applied to the distribution of the p
jetT /prefTratio. The function used, hereafter denoted as the “fit function”, is a Poisson distribution extended to non-integer values and multiplied by a turn-on curve to model the effect of the p
jetTthreshold (see Figure 2(a)). For a given [p
ref,minT ,p
ref,maxT] bin, the turn-on curve is equal to 1 above 12 GeV/p
ref,minTand equal to 0 below 12 GeV/p
ref,maxT, and a linear function is used between these two values. The mean value of the underlying Poisson distribution is taken as the mean p
Tbalance. A fit is preferred to an arithmetic mean calculation because of the jet p
Tcut, which biases the mean value of the balance distribution at low p
refTdue to the jet energy resolution [38].
2. For larger p
refT( p
refT ≥35 GeV), the arithmetic mean calculation is not sensitive to the jet threshold, and it gives results equivalent to those obtained with a fit. In this p
refTregion, an arithmetic mean is therefore used as it leads to smaller uncertainties.
In the region where the fit is used, 17 GeV
≤p
refT <35 GeV, the fit is actually performed twice, as follows, in order to reduce the impact of statistical fluctuations:
1. in each bin of p
refTand
∆φ, the mean and the width of the Poisson distribution are fitted simultane-ously;
ref
/ pT jet
pT
0 0.5 1 1.5 2 2.5 3
Events / 0.1
50 100 150 200 250 300
Data 2011 Fit function Underlying Poisson ATLAS Preliminary s = 7 TeV,
∫
L dt = 4.7 fb-1R=0.4, EM+JES anti-kt
< 25 GeV
ref
pT
≤ 20 GeV
< 0.05 φ
∆ π -
(a) Balance distribution and fit
[GeV]
ref
pT
20 30 40 50 60 100 200
)ref T / pjet T (pσ
0.1 0.15 0.2 0.25 0.3 0.35 0.4 0.45 0.5
Data 2011 ) (PYTHIA) e-
e+
→ Z(
Fit on Data Fit on MC
ATLAS Preliminary s = 7 TeV,
∫
L dt = 4.7 fb-1 R=0.4, EM+JES anti-kt< 0.05 φ
∆ π -
(b) Balance width as a function ofprefT
Figure 2: (a) The p
jetT/p
refTdistribution in the data for 20 GeV
≤p
refT <25 GeV and
π−∆φ(jet,Z)
<0.05.
The black solid histogram represents the fit function: a Poisson distribution, extended to non-integer values, multiplied by a turn-on curve. The value used in each bin is the mean value of that function in the bin. The gray dashed line shows the underlying Poisson distribution, from which the mean is taken as the measurement of the p
Tbalance. (b) Measured widths of the p
jetT /prefTdistributions as a function of p
refTin the data and in the simulation, for events with
π−∆φ(jet,Z)
<0.05. The fitted functional form defined by Equation 1 is superimposed. In both figures, anti-k
tjets with distance parameter R
=0.4 calibrated with the EM+JES scheme are used. Only statistical uncertainties are shown.
2. the distribution of the widths is parametrized as a function of p
refTin each
∆φbin according to:
w(prefT
)
=a
p
refT ⊕b
qp
refT⊕
c (1)
The parameters a, b, and c are obtained from a fit to the widths of the fitted Poisson distributions for p
T<35 GeV and to the arithmetic RMS for larger p
T(see Figure 2(b)). It has to be noted that this measured width is not to be directly compared to the resolution determined in [38] since no extrapolation to a topology without radiation is performed here;
3. the fits to the p
jetT /p
refTdistributions are repeated, but now with the widths fixed to the values resulting from the parametrizations.
In order to estimate the mean balance for a topology where the jet and the Z boson are back-to-back, the mean balances in
∆φbins are extrapolated to
∆φ = π, for eachp
refTbin, using a linear function (see Figure 3). This extrapolation reduces the sensitivity of the mean balance to additional parton radiation transverse to the leading jet axis.
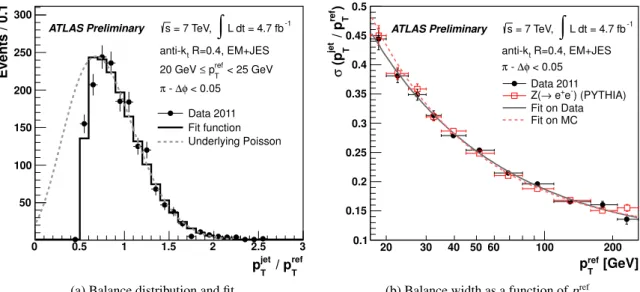
The extrapolated mean balances for the data and P
MC samples are shown in Figure 4 for anti-
k
tjets with a distance parameter of R
=0.4 and R
=0.6, calibrated with the EM+JES scheme. The
mean balance obtained for jets with R
=0.6 is larger compared to jets with R
=0.4, which is a direct
consequence of the larger jet size, and has smaller variations with the transverse momentum.
(jet,Z) φ
∆ π -
0 0.05 0.1 0.15 0.2 0.25 0.3
〉ref T / pjet T p〈
0.65 0.7 0.75 0.8 0.85 0.9
Data 2011 ) (PYTHIA) e-
e+
→ Z(
ATLAS Preliminary s = 7 TeV,
∫
L dt = 4.7 fb-1 R=0.4, EM+JES anti-kt< 25 GeV
ref
pT
≤ 20 GeV
Figure 3: Mean p
jetT /p
refTbalance vs
∆φ(jet,Z) for 20 GeV
≤p
refT <25 GeV in the data and in the simulation. A linear function used to extrapolate the balance to
∆φ=πis superimposed. Anti-k
tjets with distance parameter R
=0.4 calibrated with the EM+JES scheme are used. Only statistical uncertainties are shown.
[GeV]
ref
pT
20 30 40 50 60 100 200
〉ref T / pjet T p〈
0.7 0.75 0.8 0.85 0.9 0.95 1
1.05 ATLAS Preliminary
L dt = 4.7 fb-1
∫
= 7 TeV, s
R=0.4, EM+JES anti-kt
Data 2011 ) (PYTHIA) e-
e+
→ Z(
(a) Anti-ktR=0.4
[GeV]
ref
pT
20 30 40 50 60 100 200
〉ref T / pjet T p〈
0.7 0.75 0.8 0.85 0.9 0.95 1
1.05 ATLAS Preliminary
L dt = 4.7 fb-1
∫
= 7 TeV, s
R=0.6, EM+JES anti-kt
Data 2011 ) (PYTHIA) e-
e+
→ Z(
(b) Anti-ktR=0.6
Figure 4: Mean p
Tbalance obtained in the data and with the P
simulation. Results for anti-k
tjets with distance parameter R
=0.4 (a) and R
=0.6 (b) calibrated with the EM+JES scheme are shown.
Only statistical uncertainties are shown.
7 Systematic uncertainties
The differences between the balances observed in data and those observed in Monte Carlo simulation
may be due to physics or detector effects directly influencing the calorimeter response to jets (e.g. frag-
mentation or material in front of the calorimeter), and which are not correctly modelled in the simulation
that is used. They can also be due to effects that have an influence on the direct p
Tbalance method itself (e.g. estimation of the mean balance or higher order parton emission). The following systematic effects are studied:
1. the uncertainty on the width parametrization is propagated to the mean estimation;
2. the fit range used for the
∆φextrapolation is varied;
3. the cut on sub-leading jets is varied to assess the effect of additional high-p
Tparton radiation altering the balance;
4. the effect of soft particles produced outside the jet cone and the underlying event contribution to the jet energy is compared in data and simulation;
5. the impact of additional (pile-up) interactions is studied;
6. the uncertainty in the electron energy measurement is propagated to the p
Tbalance;
7. the results obtained with P
and A
+H+Jare compared.
7.1 Fitting procedure
For p
refT <35 GeV, the mean balance in a given bin of p
refTand
∆φis first obtained using the nominal parametrized width given in Equation 1. The fit is then performed again with a larger and a smaller width according to the uncertainty on the parametrization. The differences obtained in the resulting mean balances for data and simulation are propagated independently, after
∆φextrapolation, to the data-to-MC ratio. The positive and negative deviations are summed quadratically and symmetrized.
7.2 Extrapolation procedure
The nominal extrapolated balance is determined with a linear fit from
∆φ=π−0.3 to
∆φ=π. The lowerlimit is decreased to
π−0.4 and increased to
π−0.2, and the average of the absolute values of the two deviations is taken as a systematic uncertainty on the data-to-MC ratio.
7.3 Additional radiation suppression
To reduce the effect of additional radiation on the balance between the Z boson and the leading jet, events with energetic sub-leading jets are vetoed. Systematic uncertainties associated with this second jet veto are studied, and the mean p
Tbalances in the data and the simulation are compared when applying different second jet vetoes. The nominal p
jet2, nomT =max
{12 GeV, 0.2
×p
ZT}is varied up and down to
p
jet2, looseT =
p
jet2, nomT +0.1
×p
ZTand p
jet2, tightT =
max
{10 GeV, 0.1
×p
ZT}, and the average of the absolute values of the two deviations is taken as a systematic uncertainty on the data-to-MC ratio.
7.4 Out-of-cone radiation and underlying event
The transverse momentum of the Z boson is only approximately equal to the transverse momentum of the truth jet, because of out-of-cone radiation and contributions from the underlying event:
1. the Z boson balances against all particles inside and outside the jet cone, whereas the truth jet clusters particles inside the jet cone only;
2. the truth jet p
Tincludes any UE particles that are clustered in the jet, whereas the Z boson p
Treceives almost no such contribution.
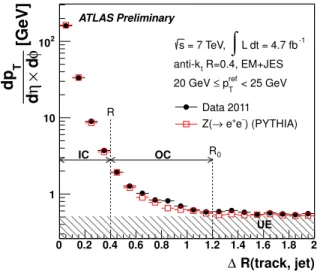
These two contributions are estimated by measuring the transverse momentum profile of tracks around the leading jet axis (see Figure 5). Tracks associated to the hard scattering vertex are used instead of calorimeter clusters in order to reduce the sensitivity to pile-up interactions. Tracks associated to the two electrons stemming from the Z boson are removed when computing the transverse momentum profiles.
R(track, jet)
∆
0 0.2 0.4 0.6 0.8 1 1.2 1.4 1.6 1.8 2
[GeV] φ d×ηd
Tdp
1 10 102
R
R0
UE
IC OC
ATLAS Preliminary
L dt = 4.7 fb-1
∫
= 7 TeV, s
R=0.4, EM+JES anti-kt
< 25 GeV
ref
pT
≤ 20 GeV
Data 2011 ) (PYTHIA) e-
e+
→ Z(
Figure 5: Transverse momentum profile of tracks around the leading jet axis for events with 20 GeV
≤p
refT <25 GeV. The radii R and R
0are those used in Equation 2 to define the IC and IC+OC regions.
The hatched area indicates the contribution from the underlying event (UE). Anti-k
tjets with R
=0.4 calibrated with the EM+JES scheme are considered.
A factor is calculated from the out-of-cone and underlying event contributions:
k
ooc =p
IC, ALLTp
IC+OC, ALLT −p
IC+OC, UET ,(2)
where p
IC, ALLTis the average scalar p
Tsum of all the tracks inside the jet cone with radius R, p
IC+OC, ALLTis the average scalar p
Tsum of all the tracks inside and outside the jet cone, and p
IC+OC, UETis the average contribution of the underlying event to p
IC+OC, ALLT. The transverse momenta p
IC+OC, ALLTand p
IC+OC, UETare estimated in a cone of radius R
0above which only the UE contributes to p
IC+OC, ALLTand where the transverse momentum density is constant (see Figure 5). In practice, R
0is the value where the logarithmic derivative of k
oocwith respect to R
0is equal to 0.05.
This k
oocfactor indicates how the Z boson p
Tdiffers from the truth jet p
T. In order to evaluate
the systematic uncertainties coming from out-of-cone radiation and the underlying event, this factor is
applied to the Z boson p
T. It is measured in the data and in the simulation in bins of p
refT. Its value
depends on the p
Tas well as on the jet size. For jets with R
=0.4, k
oocincreases from about 0.93 at
low p
Tto about 0.99 at high p
T. For jets with R
=0.6, it varies between 1 and 1.02 without any clear
p
Tdependence. A modified data-to-MC ratio of the balance is calculated using the k
oocfactors and the
difference with respect to the nominal ratio is taken as a systematic uncertainty.
7.5 Impact of additional pile-up interactions
The impact of in-time and out-of-time pile-up is studied by comparing the p
Tbalance in two samples with different numbers of primary vertices (N
PV ≤5 and N
PV >5), and two samples with different average number of interactions per bunch crossing (µ < 8 and
µ >8). The differences observed between the samples are small compared to the uncertainty on the pile-up offset correction [39]. Therefore, they are not taken into account in this analysis in order to avoid double-counting between the different steps of the jet calibration procedure.
The direct impact of additional interactions on the leading jet is also studied by relaxing, for the leading jet, the JVF cut introduced in Sec. 5.2. The difference with respect to the nominal result is taken as an additional uncertainty.
7.6 Electron energy scale
The p
Tof the Z boson, measured from the energy of the electrons, is used as a reference to probe the jet energy scale. The electron energy is shifted upwards and downwards according to the uncertainty on its measurement [35], updated using data recorded in 2011.
7.7 Impact of the Monte Carlo generator
The mean balances are obtained from P
and A
samples, using the procedure described in section 6. The difference between the data-to-P
and the data-to-A
ratios is taken as a sys- tematic uncertainty. The A
Monte Carlo uses different theoretical models for all steps of the event generation and therefore gives a reasonable estimate of the systematic variations. However, the possible compensation of modelling effects that shift the jet response in opposite directions cannot be excluded.
7.8 Summary of systematic uncertainties Other sources of uncertainties have been considered:
1. The main background to Z
+1 jet events is from multi-jet events, and its fraction in the selected events is only of the order of 3% [40]. Furthermore, jets passing the electron identification cuts contain an important electromagnetic component and the detector response should therefore be similar to the response for true electrons. No additional systematic uncertainty is considered for the contamination of Z
+jet events with background events.
2. As already mentioned, the uncertainty on the pile-up offset correction is addressed elsewhere [39].
3. The uncertainty induced by quark and gluon response differences as well as different quark and gluon compositions in data and in the simulation is addressed elsewhere [3, 41].
In the final evaluation of systematic uncertainties, only effects that are significant with respect to
their statistical uncertainties are taken into account [42]. The systematic effects and their statistical
uncertainties are first evaluated using the initial binning. Then the results in neighbouring bins are itera-
tively combined until the observed effects become significant. The quadratic sum of all the components
previously described is taken as the overall systematic uncertainty. Figure 6 summarizes the different
contributions to the total uncertainty, for EM+JES jets, in the whole p
Trange. For R
=0.4 jets and
25 GeV
<p
refT <260 GeV, uncertainties are typically between 1% and 2%, and increase up to 10% for
low transverse momenta.
[GeV]
ref
pT
20 30 40 50 60 100 200
Uncertainty
0 0.005 0.01 0.015 0.02 0.025 0.03 0.035 0.04 0.045 0.05
Total Stat.
Extrapolations Pile-up jet rejection MC generators Radiation suppression Width
Out-of-cone Electron energy scale ATLAS Preliminary s = 7 TeV,
∫
L dt = 4.7 fb-1R=0.4, EM+JES anti-kt
(a) Anti-ktR=0.4
[GeV]
ref
pT
20 30 40 50 60 100 200
Uncertainty
0 0.005 0.01 0.015 0.02 0.025 0.03 0.035 0.04 0.045 0.05
Total Stat.
Extrapolations Pile-up jet rejection MC generators Radiation suppression Width
Out-of-cone Electron energy scale ATLAS Preliminary s = 7 TeV,
∫
L dt = 4.7 fb-1R=0.6, EM+JES anti-kt
(b) Anti-ktR=0.6
Figure 6: Summary of the uncertainties on the data-to-MC ratio of the mean p
Tbalance, for anti-k
tjets with distance parameter R
=0.4 (a) and R
=0.6 (b) calibrated with the EM+JES scheme.
8 Results
Figure 7 shows the data-to-MC ratio of the mean p
Tbalance for jets calibrated with the EM+JES scheme, with statistical and systematic uncertainties. For R
=0.4 jets and p
refT >25 GeV, this ratio is shifted by at most
−4% from unity, and typically by
−2% over most of the Z boson p
Trange. Uncertainties are typically between 1% and 2% for 25 GeV
<p
refT <260 GeV, and increase up to 10% for low transverse momenta.
The corresponding results for the LCW+JES calibration are shown in Figure 8. They are qualitatively similar to those of jets calibrated with the EM+JES scheme, except in the very first bin for R
=0.6 jets, which is affected by large uncertainties.
9 Conclusion
Two jet energy calibration schemes have been probed using the direct p
Tbalance between a central jet
and a Z boson. The data are from a 4.7fb
−1sample of proton-proton collisions at 7 TeV recorded by the
ATLAS detector. The responses measured in the data and in the simulation have been compared for jets
defined by the anti-k
tclustering algorithm with distance parameters of R
=0.4 and R
=0.6. The data-
to-MC ratios, shown in Figures 7 and 8, are shifted by at most
−8% from unity, and typically by
−2% in
the range 45 GeV
<p
refT <160 GeV, for both jet sizes and both calibration schemes. The uncertainty of
the method has been estimated to be between 1% and 2% for 30 GeV
<p
refT <260 GeV. The results of
this study demonstrate that the direct p
Tbalance technique provides a method that can be used to correct
the jet energies in situ.
[GeV]
ref
pT
20 30 40 50 60 100 200
PYTHIA〉ref T/pjet T p〈 / Data〉ref T/pjet T p〈
0.86 0.88 0.9 0.92 0.94 0.96 0.98 1 1.02 1.04
Data 2011 Total uncertainty ATLAS Preliminary
L dt = 4.7 fb-1
∫
= 7 TeV, s
R=0.4, EM+JES anti-kt
(a) Anti-ktR=0.4
[GeV]
ref
pT
20 30 40 50 60 100 200
PYTHIA〉ref T/pjet T p〈 / Data〉ref T/pjet T p〈
0.86 0.88 0.9 0.92 0.94 0.96 0.98 1 1.02 1.04
Data 2011 Total uncertainty ATLAS Preliminary
L dt = 4.7 fb-1
∫
= 7 TeV, s
R=0.6, EM+JES anti-kt
(b) Anti-ktR=0.6
Figure 7: Data-to-MC ratio of the mean p
Tbalance as a function of p
refTfor anti-k
tjets with distance parameter R
=0.4 (a) and R
=0.6 (b) calibrated with the EM+JES scheme. The total uncertainty on this ratio is depicted by gray bands. Dashed lines show the
−1%,
−2%, and
−5% shifts.
[GeV]
ref
pT
20 30 40 50 60 100 200
PYTHIA〉ref T/pjet T p〈 / Data〉ref T/pjet T p〈
0.86 0.88 0.9 0.92 0.94 0.96 0.98 1 1.02 1.04
Data 2011 Total uncertainty ATLAS Preliminary
L dt = 4.7 fb-1
∫
= 7 TeV, s
R=0.4, LCW+JES anti-kt
(a) Anti-ktR=0.4
[GeV]
ref
pT
20 30 40 50 60 100 200
PYTHIA〉ref T/pjet T p〈 / Data〉ref T/pjet T p〈
0.86 0.88 0.9 0.92 0.94 0.96 0.98 1 1.02 1.04
Data 2011 Total uncertainty ATLAS Preliminary
L dt = 4.7 fb-1
∫
= 7 TeV, s
R=0.6, LCW+JES anti-kt
(b) Anti-ktR=0.6
Figure 8: Data-to-MC ratio of the mean p
Tbalance as a function of p
refTfor anti-k
tjets with distance parameter R
=0.4 (a) and R
=0.6 (b) calibrated with the LCW+JES scheme. The total uncertainty on this ratio is depicted by gray bands. Dashed lines show the
−1%,
−2%, and
−5% shifts.
References
[1] M. Cacciari, G. P. Salam, and G. Soyez, The Anti-k
tjet clustering algorithm, JHEP
04(2008) 063,
arXiv:0802.1189 [hep-ph].
[2] ATLAS Collaboration, Measurement of inclusive jet and dijet cross sections in proton-proton collisions at 7 TeV centre-of-mass energy with the ATLAS detector, Eur. Phys. J.
C 71(2011) 1512, arXiv:1009.5908 [hep-ex].
[3] ATLAS Collaboration, Jet energy measurement with the ATLAS detector in proton-proton collisions at
√s
=7 TeV, submitted to EPJ (2011) , arXiv:1112.6426 [hep-ex].
[4] ATLAS Collaboration, Single hadron response measurement and calorimeter jet energy scale uncertainty in the ATLAS detector at the LHC, submitted to EPJC (2012) , arXiv:1203.1302 [hep-ex].
[5] ATLAS Collaboration, Validating the measurement of jet energies with the ATLAS detector using Z
+jet events from proton-proton collisions at
√s
=7 TeV, Tech. Rep. ATLAS-CONF-2011-159, December, 2011.
[6] ATLAS Collaboration, Probing the measurement of jet energies with the ATLAS detector using photon+jet events in proton-proton collisions at
√s
=7 TeV, Tech. Rep. in preparation, 2012.
[7] ATLAS Collaboration, In situ jet pseudorapidity intercalibration of the ATLAS detector using dijet events in
√s
=7 TeV pp 2011 data, Tech. Rep. in preparation, 2012.
[8] ATLAS Collaboration, The ATLAS experiment at the CERN Large Hadron Collider, JINST
3(2008) S08003.
[9] T. Sjostrand, S. Mrenna, and P. Skands, PYTHIA 6.4 physics and manual, JHEP
05(2006) 026, arXiv:hep-ph/0603175.
[10] A. Sherstnev and R. S. Thorne, Parton Distributions for LO Generators, Eur. Phys. J. C
55(2008) 553–575, arXiv:0711.2473 [hep-ph].
[11] R. Corke and T. Sjostrand, Improved Parton Showers at Large Transverse Momenta, Eur. Phys. J.
C
69(2010) 1–18, arXiv:1003.2384 [hep-ph].
[12] T. Sjostrand and P. Z. Skands, Transverse-momentum-ordered showers and interleaved multiple interactions, Eur. Phys. J. C
39(2005) 129–154, arXiv:hep-ph/0408302.
[13] B. Andersson et al., Parton fragmentation and string dynamics, Phys. Rep.
97(1983) 31–145.
[14] ATLAS Collaboration, ATLAS tunes of Pythia6 and Pythia8 for MC11, Tech. Rep.
ATLAS-PHYS-PUB-2011-009, July, 2011.
[15] M. Mangano et al., ALPGEN, a generator for hard multiparton processes in hadronic collisions, JHEP
07(2003) 001, arXiv:hep-ph/0206293.
[16] G. Corcella et al., HERWIG 6.5: an event generator for hadron emission reactions with interfering gluons (including supersymmetric processes), JHEP
0101(2001) 010, arXiv:hep-ph/0011363.
[17] J. Butterworth, J. Forshaw, and M.Seymour, Multiparton interactions in photoproduction at HERA, Z. Phys. C
72(1996) 637–646, arXiv:hep-ph/9601371.
[18] ATLAS Collaboration, New ATLAS event generator tunes to 2010 data, Tech. Rep.
ATL-PHYS-PUB-2011-008, May, 2011.
[19] D. Stump et al., Inclusive jet production, parton distributions, and the search for new physics,
JHEP
10(2003) 046, arXiv:hep-ph/0303013.
[20] M. L. Mangano, M. Moretti, and R. Pittau, Multijet matrix elements and shower evolution in hadronic collisions: Wb b ¯
+n jets as a case study, Nucl. Phys. B
632(2002) 343–362, arXiv:hep-ph/0108069.
[21] B. R. Webber, A QCD model for jet fragmentation including soft gluon interference, Nucl. Phys.
B 238(1984) 492.
[22] GEANT4 Collaboration, S. Agostinelli et al., GEANT4: A simulation toolkit, Nucl. Instrum. Meth.
A 506
(2003) 250–303.
[23] M. Cacciari and G. P. Salam, Dispelling the N
3myth for the k
tjet-finder, Phys. Lett. B
641(2006) 57–61.
[24] G. Cacciari and G. Salam. http://fastjet.fr/.
[25] C. Cojocaru et al., Hadronic calibration of the ATLAS liquid argon end-cap calorimeter in the pseudorapidity region 1.6
<|η|<1.8 in beam tests, Nucl. Instrum. Meth.
A 531(2004) 481–514.
[26] W. Lampl et al., Calorimeter Clustering Algorithms: Description and Performance, Tech. Rep.
ATL-LARG-PUB-2008-002, April, 2008.
[27] ATLAS Collaboration, Expected Performance of the ATLAS Experiment - Detector, Trigger and Physics, arXiv:0901.0512 [hep-ex]. CERN-OPEN-2008-020.
[28] E. Abat et al., Combined performance studies for electrons at the 2004 ATLAS combined test-beam, JINST
5(2010) P11006.
[29] M. Aharrouche et al., Measurement of the response of the ATLAS liquid argon barrel calorimeter to electrons at the 2004 combined test-beam, Nucl. Instrum. Meth.
A 614(2010) 400–432.
[30] M. Aharrouche et al., Response Uniformity of the ATLAS Liquid Argon Electromagnetic Calorimeter, Nucl. Instrum. Meth.
A 582(2007) 429–455, arXiv:0709.1094
[physics.ins-det].
[31] M. Aharrouche et al., Energy Linearity and Resolution of the ATLAS Electromagnetic Barrel Calorimeter in an Electron Test-beam, Nucl. Instrum. Meth.
A 568(2006) 601–623.
[32] P. Adragna et al., Testbeam studies of production modules of the ATLAS Tile Calorimeter, Nucl.
Instrum. Meth.
A 606(2009) 362–394.
[33] J. Pinfold et al., Performance of the ATLAS liquid argon endcap calorimeter in the pseudorapidity region 2.5
<|η|<4.0 in beam tests, Nucl. Instrum. Meth.
A 593(2008) 324–342.
[34] M. Aharrouche et al., Study of the response of ATLAS electromagnetic liquid argon calorimeters to muons, Nucl. Instrum. Meth.
A 606(2009) 419–431.
[35] ATLAS Collaboration, Electron performance measurements with the ATLAS detector using the 2010 LHC proton-proton collision data, Eur. Phys. J. C
72(2012) 1909, arXiv:1110.3174 [hep-ex].
[36] ATLAS Collaboration, Performance of the Electron and Photon Trigger in p-p Collisions at
√