ATLAS-CONF-2017-004 08February2017
ATLAS CONF Note
ATLAS-CONF-2017-004
Measurement of jet fragmentation in 5.02 TeV proton-lead and proton-proton collisions with the
ATLAS detector
The ATLAS Collaboration
5th February 2017
A measurement of the fragmentation functions of jets into charged particles in p
+Pb colli- sions and pp collisions is presented. The analysis utilizes 28 nb
−1of p
+Pb data and 26 pb−1of pp data, both at
√s
NN =5.02 TeV, collected in 2013 and 2015, respectively, with the ATLAS detector at the LHC. The measurement is reported in the centre-of-mass frame of the nucleon–nucleon system for jets in the rapidity range
|y∗| <1.6 and with transverse mo-mentum 45
<p
T<260 GeV. Results are presented both as a function of the charged particle transverse momentum and as a function of the longitudinal momentum fraction of the parti- cle with respect to the jet. The pp fragmentation functions are compared with results from Monte Carlo generators and two theoretical models. The ratios of the p
+Pb topp fragmen- tation functions are found to be consistent with unity.
c
2017 CERN for the benefit of the ATLAS Collaboration.
Reproduction of this article or parts of it is allowed as specified in the CC-BY-4.0 license.
1 Introduction
Heavy ion collisions at the Large Hadron Collider (LHC) are performed in order to produce and study the quark-gluon plasma (QGP), a phase of strongly interacting matter which emerges at very high energy densities; a recent review can be found in Ref. [1]. Measurements of jets and the modifications to their properties in heavy ion collisions are sensitive to the properties of the QGP. In order to quantify jet modifications in heavy ion collisions, proton-proton (pp) collisions are often used as a reference system.
Using this reference, the rates of jet production are observed to be reduced in lead-lead (Pb
+Pb) collisions compared to expectations from the jet production cross section measured in pp interactions scaled by the nuclear thickness function of Pb
+Pb collisions [2, 3]. Charged particle longitudinal fragmentation functions are also observed to be modified in Pb
+Pb collisions compared to pp collisions [4, 5].
In addition to final state differences, Pb+Pb collisions also differ from pp collisions in the initial state due to the participation of the lead nucleus in the collision. Proton-nucleus collisions are used to pro- vide measurements of modifications from pp collisions that would be present in the initial conditions of Pb+Pb collisions as well. The inclusive jet production rate in proton-lead (p
+Pb) collisions at 5.02 TeVwas measured [6–8] and found to have only small modifications after accounting for the partonic over- lap in p
+Pb compared topp collisions. Measurements made at the Relativistic Heavy Ion Collider with deuteron-gold collisions yield similar results [9]. At high p
T, charged hadrons originate from the frag- mentation of jets and provide a complementary observable to reconstructed jets. The CMS collaboration observes a small excess in the charged particle spectrum measured in p
+Pb forp
T >20 GeV compared to pp collisions [10]. It is of great interest to measure the charged particle fragmentation functions in p
+Pb and pp collisions for di
fferent intervals of jet p
Tat the LHC to connect the jet and charged particle results. These measurements are necessary to both determine modifications to jet fragmentation in p
+Pb collisions and to establish a reference for jet fragmentation measurements in Pb+Pb.
In this note, the jet momentum structure in pp and p
+Pb collisions is studied using the distributions of charged particles associated with jets which have a transverse momentum in the range 45–260 GeV. Jets are reconstructed with the anti-k
talgorithm [11] using a distance parameter R
=0.4. The association is done via an angular matching
∆R <0.4
1, where
∆Ris the angular distance between the jet axis and the charged particle position. Results on fragmentation functions are presented as a function of both, the charged particle transverse momentum with respect to the beam direction, p
T, and the longitudinal momentum fraction with respect to the jet direction, z
≡p
Tcos
∆R/p
jetT:
D(p
T)
≡1 N
jetdN
chdp
T ,(1)
and
D( z)
≡1 N
jetdN
chdz
,(2)
where N
chis the number of charged particles and N
jetis the number of jets under consideration. The D( p
T) distributions are the transverse momentum spectra of charged particles within a jet without the
1 ATLAS uses a right-handed coordinate system with its origin at the nominal interaction point (IP) in the centre of the detector and thez-axis along the beam pipe. Thex-axis points from the IP to the centre of the LHC ring, and theyaxis points upward. Cylindrical coordinates (r, φ) are used in the transverse plane,φbeing the azimuthal angle around the beam pipe.
The pseudorapidity is defined in terms of the polar angleθasη =−ln tan(θ/2). Angular distance is measured in units of
∆R≡ q
(∆η)2+(∆φ)2.
projection onto the jet axis as the D( z) distributions have. The D( p
T) distributions di
ffer from typical fragmentation functions but have been studied in Pb+Pb collisions at the LHC [4, 5].
The fragmentation functions in p
+Pb are compared to
√s
=5.02 TeV pp data. In order to quantify any differences between p
+Pb andpp collisions, the ratios of the fragmentation functions are measured:
RD (z)
≡D( z)
pPbD( z)
p p(3)
and
RD( p
T)
≡D( p
T)
pPbD( p
T)
p p .(4)
The fragmentation functions as a function of z are more commonly used, but the distributions as a function of p
Tare less sensitive to jet-related uncertainties and are also used in Pb
+Pb measurements [4].
2 Experimental Setup
The measurements presented here are performed using the ATLAS calorimeter, inner detector, trigger, and data acquisition systems [12]. The calorimeter system consists of a sampling liquid argon (LAr) electromagnetic (EM) calorimeter covering
|η| <3.2, a steel–scintillator sampling hadronic calorimeter covering
|η| <1.7, a LAr hadronic calorimeter covering 1.5
< |η| <3.2, and two LAr forward calorime- ters (FCal) covering 3.2
< |η| <4.9. The hadronic calorimeter has three sampling layers longitudinal in shower depth. The EM calorimeters are segmented longitudinally in shower depth into three layers plus an additional pre-sampler layer. The EM calorimeter has a granularity that varies with layer and pseudorapidity, but which is generally much finer than that of the hadronic calorimeter. The minimum- bias trigger scintillators (MBTS) [12] detect charged particles over 2.1
< |η| <3.9 using two segmented counters placed at z
= ±3.6 m. Each counter provides measurements of both, the pulse heights and thearrival times of ionization energy deposits.
A two-level trigger system was used to select the p
+Pb and pp collisions analyzed here. The first, the hardware-based trigger stage Level-1, is implemented with custom electronics. The second level is the software-based High Level Trigger (HLT). Jet events were selected by the HLT with Level-1 seeds from jet, minimum bias, and total-energy triggers. The total-energy trigger required a total transverse energy measured in the calorimeter of greater than 5 GeV. The HLT jet trigger operated a jet reconstruction algorithm similar to that applied in the offline analysis and selected events containing jets with transverse energy thresholds ranging from 20 GeV to 75 GeV in p
+Pb collisions and up to 85 GeV in pp collisions.
In both, pp and p
+Pb collisions, the highest threshold jet trigger sampled the full delivered luminosity.
Minimum-bias p
+Pb events were required to have at least one hit in a counter in each side of the MBTSdetector at Level-1 trigger.
The inner detector measures charged particles within the pseudorapidity interval
|η| <2.5 using a combi-
nation of silicon pixel detectors, silicon microstrip detectors (SCT), and a straw-tube transition radiation
tracker (TRT), all immersed in a 2 T axial magnetic field [12]. Each of the three detectors are composed
of a barrel and two symmetric end-cap sections. The pixel detector is composed of three layers of sensors
with a nominal pixel size of 50
µm ×400
µm. Following thep
+Pb data taking and prior to the 5 TeVpp data-taking an additional silicon tracking layer, the "insertable B-layer" (IBL) [13, 14], was installed
closer to the interaction point than the other three layers. The SCT barrel section contains four layers of
modules with 80
µm pitch sensors on both sides, and each end-cap consists of nine layers of double-sidedmodules with radial strips having a mean pitch of 80
µm. The two sides of each SCT layer in both thebarrel and the end-caps have a relative stereo angle of 40 mrad. The TRT contains up to 73 (160) layers of staggered straws interleaved with fibres in the barrel (end-cap).
3 Event Selection and Data Sets
The p
+Pb data used in this analysis were recorded in 2013. The LHC was configured with a 4 TeV protonbeam and a 1.57 TeV per nucleon Pb beam producing collisions with
√s
NN =5.02 TeV and a rapidity shift of the centre-of-mass frame,
∆y =0.465, relative to the lab frame. The data collection was split into two periods with opposite beam configurations. The first period consists of approximately 55% of the integrated luminosity with the Pb beam traveling to positive rapidity and the proton beam to negative rapidity. The remaining data was taken with the beams of protons and Pb nuclei swapped. The total p
+Pb integrated luminosity is 28 nb
−1. Approximately 26 pb
−1of
√s
=5.02 TeV pp data from 2015 was used.
The instantaneous luminosity conditions provided by the LHC resulted in an average number of p
+Pbinteractions per bunch crossing of 0.03. During pp data taking, the average number of interactions per bunch crossing varied from 0.6 to 1.3.
The p
+Pb events selected are required to have a reconstructed vertex, at least one hit in each MBTS detector, and a time di
fference measured between the two MBTS sides of less than 10 ns. The pp events used in this analysis are required to have a reconstructed vertex; no requirement on the signal in the MBTS detector is imposed. In p
+Pb collisions the event centrality is determined by the FCal in the Pb-going direction as in Ref. [6]. The p
+Pb events used here belong to the 0–90% centrality interval.
The performance of the detector for measuring fragmentation functions in p
+Pb collisions is evaluatedusing a sample of Monte Carlo (MC) events obtained by overlaying simulated hard-scattering events generated with P
ythiaversion 6.423 (P
ythia6) [15] onto minimum-bias p
+Pb events recorded during the same data-taking period. A sample consisting of 2.4×10
7P
ythia6 pp events using the AUET2B tune [16] and the CTEQ6L1 parton distribution function (PDF) set [17], at 5.02 TeV and a rapidity shift equivalent to that in the p
+Pb collisions is generated. Half of the events are simulated with one beam configuration and the second half with the other. The detector response is simulated using GEANT4 [18, 19], and the simulated hits are combined with those from the data event. A separate sample of 2.6×10
7simulated 5.02 TeV P
ythiaversion 8.212 (P
ythia8) pp hard scattering events with the A14 tune [20] and NNPDF23LO PDF set [21] is used to evaluate the performance for measuring fragmentation functions in the 2015 pp data. Finally, the fragmentation functions at the generator level in 1.5×10
75.02 TeV H
erwig++events [22] using the UEEE5 tune [23] and the CTEQ6L1 PDFs [17] are compared to the fragmentation function measurement in 5.02 TeV pp data.
4 Jet and Track Selection
Jets are reconstructed via the same heavy ion jet reconstruction algorithm used in previous measurements in p
+Pb collisions [6]. The anti-k
talgorithm [11] is first run in four-momentum recombination mode, on
∆η×∆φ=
0.1
×0.1 calorimeter towers with the anti-k
tdistance parameter R set to 0.4 and 0.2 (R
=0.4
jets are used for the main analyisis and the R
=0.2 jets are used to improve the jet position resolution
as discussed below). The energies in the towers are obtained by summing the energies of calorimeter
cells at electromagnetic energy scale within the tower boundaries. Then, an iterative procedure is used to estimate the layer- and
η-dependent underlying event (UE) transverse energy density, while excluding theregions populated by jets. The UE transverse energy is subtracted from each calorimeter cell within the towers included in the reconstructed jet and the four-momentum of the jet is updated accordingly. Then, a jet
η- andp
T-dependent correction factor derived from the simulation samples is applied to correct for the calorimeter response. An additional correction based on in situ studies of the momentum balance of jets recoiling against photons, Z bosons, and jets in other regions of the calorimeter is applied [24, 25].
Jets are required to have
|yjet∗ | <1.6 (y
∗jet ≡ y− ∆y), which is the largest symmetric overlap betweenthe two collision systems for which there is full charged particle tracking coverage within a jet cone of R
=0.4. To prevent neighbouring jets from distorting the measurement of the fragmentation functions, jets are rejected if there is another jet with higher p
Twithin a distance
∆R <1.0. To reduce the effects of the broadening of the jet position measurement due to the UE, for R
=0.4 jets, the jet direction was taken from that of the closest matching R
=0.2 jet within
∆R=0.3 when such a matching jet was found.
All jets included in the analysis are required to have a p
Tjetsuch that the jet trigger efficiency was greater than 99%. Jets originating from high-p
Telectrons [26] are excluded from this analysis.
The MC samples are used to evaluate the jet reconstruction performance and to correct the measured distributions. The p
+Pb jet performance is described in Ref. [6]; the jet performance inpp collisions is found to be similar to that in p
+Pb collisions. In the MC samples, the kinematics of the truth jets are reconstructed from primary particles2 with the anti-k
talgorithm with radius R
=0.4. In these studies, generator level “truth jets” are matched to reconstructed jets with a
∆R<0.2.
Tracks used in the analysis of p
+Pb collisions are required to have at least one hit in the pixel detector and at least six hits in the SCT. Tracks used in the analysis of pp collisions are required to have at least 9 or 11 total silicon hits for
|η| <1.65 and
|η| >1.65, respectively, including both the pixel layers and the SCT. This includes a hit in the first (first or second) pixel layer if expected by the track model for the p
+Pb (pp) data. All tracks used in this analysis are required to havep
T >1 GeV. In order to suppress a contribution of secondary particles, the distance of closest approach of the track to the primary vertex is required be less than a value which varies from approximately 0.6 mm at p
T =1 GeV to approximately 0.2 mm at p
T=20 GeV in the transverse plane and less than 1.5 mm in the longitudinal plane.
The e
fficiency for reconstructing charged particles within jets in p
+Pb and pp collisions is evaluated using P
ythia6 and P
ythia8 MC samples, respectively, based on matching the tracks to MC primary
“truth" particles. The efficiencies are determined separately for the two p
+Pb running configurationsbecause the
ηregions of the detector used for the track measurement are di
fferent between the beam configurations. The charged particle reconstruction e
fficiencies as a function of the primary particle transverse momentum, p
truthT, are shown in Figure 1 in pp and p
+Pb collisions. The tracking efficienciesare determined in coarse
ηtruthintervals. The p
truthTdependence of the e
fficiencies is parameterized using a fifth order polynomial in log(p
truthT) which describes trends in the range of particle p
Ttruthfrom 1.0 to 150 GeV. A constant efficiency value is used for particles with p
truthT >150 GeV due to the limited size of the MC samples. To account for the finer scale variations of the tracking e
fficiency with pseudorapidity, the parameterizations are multiplied by an
η-dependent scale factor evaluated inηtruthintervals of 0.1 units in coarse p
Ttruthintervals. The dependence of the charged particle efficiency on p
jetTis found to be negligible for the p
Tjetselections used here. The contribution of reconstructed tracks which cannot be associated to a generated primary particle in the MC samples produced without data overlay and the residual contribution
2Primary particles are defined as particles with a mean lifetimeτ >0.3×10⁻¹⁰s either directly produced inppinteractions or from subsequent decays of particles with a shorter lifetime. All other particles are considered to be secondary.
[GeV]
truth
pT
1 10 102
Tracking Efficiency
0.4 0.5 0.6 0.7 0.8 0.9 1
1.1 ATLAS Simulation Preliminary
= 5.02 TeV pp s
< -1.0
truth
η -2.0 <
< 1.0
truth
η -1.0 <
< 2.0
truth
η 1.0 <
[GeV]
truth
pT
1 10 102
Tracking Efficiency
0.4 0.5 0.6 0.7 0.8 0.9 1
1.1 ATLAS Simulation Preliminary
= 5.02 TeV sNN
p+Pb
< -2.0
truth
η -2.5 <
< -1.0
truth
η -2.0 <
< 1.0
truth
η -1.0 <
< 2.0
truth
η 1.0 <
Figure 1: Tracking efficiency as a function ofpTtruthinppcollisions (left) and inp+Pb collisions (first beam config- uration). The different sets of points show theηtruthregions selected to determine the track reconstruction efficiency as a function of pTtruth. The different ηtruth selections between the ppand p+Pb efficiencies reflect the different regions of the tracking system used in the two systems due to the boostedp+Pb system. The solid curves show parameterizations of efficiencies.
of tracks associated to secondary particles are together called the contribution from “fake” tracks. The fraction of fake tracks is found to be below 2% of the tracks that pass the selection in any track and jet kinematic region. The contribution from these tracks to the fragmentation functions is subtracted from the measured fragmentation functions in both pp and p
+Pb collisions.5 Analysis Procedure
Reconstructed charged tracks are associated with a reconstructed jet if they fall within
∆R <0.4 of the jet axis. For each of these particles the longitudinal momentum fraction, z , is calculated. The measured fragmentation functions are constructed as:
D( z)
mea s ≡1 N
jet1
ε(η,p
T)
∆Nch
(z )
∆z
(5)
and
D(p
T)
mea s ≡1 N
jet1
ε(η,p
T)
∆Nch
( p
T)
∆pT ,
(6)
where
ε(η,p
T) is the track reconstruction e
fficiency, and N
jetis the total number of jets in a given p
jetTbin. The quantities
∆Nch( z) and
∆Nch(p
T) are the numbers of associated tracks within the given z or p
Trange, respectively. The efficiency correction is applied on a track-by-track basis, assuming p
T =p
truthT. While that assumption is not strictly valid, the e
fficiency varies su
fficiently slowly with p
truthTthat the error introduced by this assumption is negligible.
In p
+Pb collisions contribution to the fragmentation functions from the UE charged particles needs to
be subtracted. This background is determined event-by-event for each measured jet by using a grid of
R
=0.4 cones that span the full coverage of the inner detector. The cones have a fixed distance between
their centers chosen such that the coverage of the inner detector is maximized while the cones do not
overlap each other. Any such cone having a charged particle with p
T >3.5 GeV is assumed to be
associated with a real jet and is excluded from the UE contribution. The estimated contribution from UE particles is corrected to account difference in the average UE particle yield at given p
Tbetween the
ηposition of the cone and
ηpositions of the jet. The UE contribution is further corrected for the correlation between the actual UE yield underneath the jet and the jet energy resolution. This e
ffect is corrected for by a multiplicative correction factors, dependent on p
T(track z) and jet p
T. The correction is estimated in MC samples as the ratio of the UE contribution calculated from tracks within the area of a jet that does not have an associated truth particle and the UE contribution estimated by the cone method. Corrected UE contributions are then subtracted from measured distributions. The maximum size of the UE contribution is 20% for the lowest p
T(track z). No UE subtraction is performed for the pp measurement due to negligible UE contribution.
The measured D(z ) and D( p
T) distributions are corrected for detector effects by means of a two-dimensional Bayesian unfolding procedure [27] using the RooUnfold package [28]. The unfolding procedure removes the e
ffect of bin migration due to the finite jet energy resolution and the track momentum resolution.
Using the MC samples, four-dimensional response matrices are created using the truth and reconstructed p
Tjet, and the truth and reconstructed z (or p
T). Separate unfolding matrices are constructed for the p
+Pb and pp data. An independent bin-by-bin unfolding is used to correct the measured p
Tjetspectra, which is needed to normalize the unfolded fragmentation functions by the number of jets. To achieve better corre- spondence with the data, the simulated jet spectra and fragmentation functions are re-weighted to match the shapes of the reconstructed data. The number of iterations in the Bayesian unfolding is selected to be the minimum number for which the relative change in the fragmentation function at z
=0.1 is smaller than 0.2% per additional iteration in all p
jetTbins. This condition ensures the stability of the unfolding and minimizes fluctuations due to the unfolding in the high z and p
Tregions. The resulting number of iteration is driven by the low p
jetTintervals, which require the most iterations to converge. The systematic uncertainty due to the unfolding is typically much larger than the impact of the stability requirement, especially for the lowest p
Tjetvalues used in this analysis (discussed in Section 6). Following this crite- rion, fourteen iterations are used for both the p
+Pb and pp datasets. The analysis procedure is tested by dividing the MC events in half and using one half to generate response matrices with which the other half is unfolded. Good recovery of the truth MC distributions is observed for the unfolded events and the deviations from perfect closure are incorporated into the systematic uncertainties.
6 Systematic Uncertainties
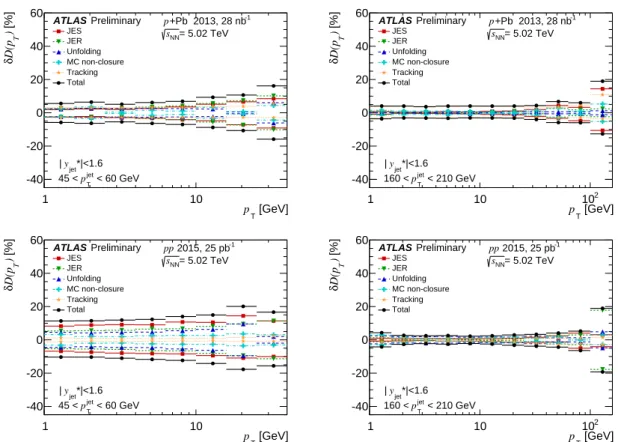
The systematic uncertainties in the measurement of the fragmentation functions and their ratios are de- scribed in this section. The following sources of systematic uncertainty are considered: the jet energy scale (JES), the jet energy resolution (JER), the sensitivity of the unfolding to the prior, the residual non- closure of the unfolding and the tracking-related uncertainties. For each systematic variation the frag- mentation functions are re-evaluated and the difference between the varied and nominal fragmentation functions is used as an estimate of the uncertainty. The systematic uncertainties on the D( z) and D(p
T) measurements in both collision systems are summarized in Figures 2 and 3, respectively, for two di
fferent jet p
Tbins. The systematic uncertainties from each source are taken as uncorrelated and combined in quadrature to obtain the total systematic uncertainty.
The JES uncertainty is determined from in situ studies of the calorimeter response [24, 25, 29], and studies
of the relative energy scale difference between the jet reconstruction procedure in heavy-ion collisions and
the procedure used in pp collisions [30]. Each component that contributes to the JES uncertainty is varied
z
10-1 1
[%]D(z)δ
-40 -20 0 20 40 60
JES JER Unfolding MC non-closure Tracking Total
*|<1.6 yjet
|
ATLAS Preliminary
= 5.02 TeV sNN
+Pb 2013, 28 nb-1
p
< 60 GeV
jet
pT
45 <
z
10-2 10-1 1
[%]D(z)δ
-40 -20 0 20 40 60
JES JER Unfolding MC non-closure Tracking Total
*|<1.6 yjet
|
ATLAS Preliminary
= 5.02 TeV sNN
+Pb 2013, 28 nb-1
p
< 210 GeV
jet
pT
160 <
z
10-1 1
[%]D(z)δ
-40 -20 0 20 40 60
JES JER Unfolding MC non-closure Tracking Total
*|<1.6 yjet
|
ATLAS Preliminary
= 5.02 TeV sNN
2015, 25 pb-1
pp
< 60 GeV
jet
pT
45 <
z
10-2 10-1 1
[%]D(z)δ
-40 -20 0 20 40 60
JES JER Unfolding MC non-closure Tracking Total
*|<1.6 yjet
|
ATLAS Preliminary
= 5.02 TeV sNN
2015, 25 pb-1
pp
< 210 GeV
jet
pT
160 <
Figure 2: Summary of the systematic uncertainties on theD(z) distributions inp+Pb collisions (top) andppcol- lisions (bottom) for jets in the 45–60 GeV pjetT interval (left) and in the 160–210 GeV pjetT interval (right). The systematic uncertainties due to JES, JER, unfolding, MC non-closure and tracking are shown along with the total systematic uncertainty from all sources.
separately by
±1 standard deviation for each p
jetTand the response matrix is computed accordingly. The data are unfolded with these matrices. The JES uncertainty increases with increasing z and particle p
Tat fixed p
jetTand decreases with increasing p
jetT.
The uncertainty on the fragmentation functions due to the JER is evaluated by repeating the unfolding procedure with modified response matrices, where an additional increase to the resolution of the recon- structed jet p
jetTis added with a Gaussian smearing. The smearing factor is evaluated using an in situ technique involving studies of dijet energy balance [31, 32]. The systematic uncertainty due to the JER increases with increasing z and particle p
Tat fixed p
jetTand decreases with increasing p
Tjet.
The unfolding uncertainty is estimated by generating the response matrices from the MC distributions without re-weighting in p
jetTand D(z ). A separate uncertainty for residual limitations in the unfolding procedure was assigned by evaluating the non-closure of the unfolded distributions in simulations, as described in Sec. 5. The magnitude of both of these uncertainties is typically below 5% except for the highest z and track p
Tbins.
The uncertainties related to track reconstruction and selection originate from several sources. Uncertain-
ties related to the fake rate, the material description in the simulation, and the track momentum were
obtained from studies in data and simulation described in Ref. [33]. The systematic uncertainty on the
fake track rate is 30% in pp collisions and 50% in p
+Pb. Since the contamination of fake tracks is at most
[GeV]
pT
1 10
[%]) TD(pδ
-40 -20 0 20 40 60
JES JER Unfolding MC non-closure Tracking Total
*|<1.6 yjet
|
ATLAS Preliminary
= 5.02 TeV sNN
+Pb 2013, 28 nb-1
p
< 60 GeV
jet
pT
45 <
[GeV]
pT
1 10 102
[%]) TD(pδ
-40 -20 0 20 40 60
JES JER Unfolding MC non-closure Tracking Total
*|<1.6 yjet
|
ATLAS Preliminary
= 5.02 TeV sNN
+Pb 2013, 28 nb-1
p
< 210 GeV
jet
pT
160 <
[GeV]
pT
1 10
[%]) TD(pδ
-40 -20 0 20 40 60
JES JER Unfolding MC non-closure Tracking Total
*|<1.6 yjet
|
ATLAS Preliminary
= 5.02 TeV sNN
2015, 25 pb-1
pp
< 60 GeV
jet
pT
45 <
[GeV]
pT
1 10 102
[%]) TD(pδ
-40 -20 0 20 40 60
JES JER Unfolding MC non-closure Tracking Total
*|<1.6 yjet
|
ATLAS Preliminary
= 5.02 TeV sNN
2015, 25 pb-1
pp
< 210 GeV
jet
pT
160 <
Figure 3: Summary of the systematic uncertainties on the D(pT) distributions in p+Pb collisions (top) and pp collisions (bottom) for jets in the 45–60 GeVpTjetinterval (left) and in the 160–210 GeVpjetT interval (right). The systematic uncertainties due to JES, JER, unfolding, MC non-closure and tracking are shown along with the total systematic uncertainty from all sources.
2%, the resulting uncertainty on the fragmentation functions is at most 1%. The sensitivity of the tracking
efficiency to the description of the inactive material in the MC samples is evaluated by varying the mate-
rial description. This uncertainty is between 0.5 and 2% (depending on track
η) in the trackp
Trange used
in the analysis. The uncertainty on the track momentum from a possible detector mis-alignment results in
an at most 1% uncertainty on the fragmentation functions. Measurements of muons in the inner detector
and in the muon spectrometer show that the track p
Tscale di
ffers by up to 2% between the data and the
MC simulations in pp collisions. This e
ffect introduces additional uncertainty on fragmentation functions
in pp collisions up to 10%. Uncertainty on the tracking efficiency due to the high local track density in the
core of jets is 0.4% [34] for all p
Tjetselections in this analysis. The uncertainty due to the track selection is
evaluated by repeating the analysis with an additional requirement on the significance of the distance of
closest approach of the track to the primary vertex. This uncertainty affects both the track reconstruction
e
fficiency and the rate of fake tracks. The resulting uncertainty typically varies from 1% at low track p
Tto 5% at high track p
T. Additionally, there is a systematic uncertainty due to the parameterization of the
efficiency corrections. The size of the uncertainty is less than 1% on the fragmentation functions. Finally,
the track-to-particle association requirements are varied. This variation a
ffects the track reconstruction
e
fficiency, the track momentum resolution, and the rate of fake tracks. After deriving new response ma-
trices and efficiency corrections, the resulting systematic uncertainty on the fragmentation functions is
found to be less than 0.5%. Figures 2 and 3 present the total tracking uncertainty where all track-related
z
10-1 1
[%]D(z)Rδ
-40 -20 0 20 40 60
JES JER Unfolding MC non-closure Tracking Total
*|<1.6 yjet
|
ATLAS Preliminary p+Pb, sNN= 5.02 TeV, 28 nb-1
= 5.02 TeV, 25 pb-1
s , pp
< 60 GeV
jet
pT
45 <
z
10-2 10-1 1
[%]D(z)Rδ
-40 -20 0 20 40 60
JES JER Unfolding MC non-closure Tracking Total
*|<1.6 yjet
|
ATLAS Preliminary p+Pb, sNN= 5.02 TeV, 28 nb-1
= 5.02 TeV, 25 pb-1
s , pp
< 210 GeV
jet
pT
160 <
Figure 4: Summary of the systematic uncertainties forRD(z)ratios, for jets in the 45–60 GeVpTinterval (left) and in the 160–210 GeVpTinterval (right). The systematic uncertainties due to JES, JER, unfolding, MC non-closure and tracking are shown along with the total systematic uncertainty from all sources.
[GeV]
pT
1 10
[%])TD(pRδ
-40 -20 0 20 40 60
JES JER Unfolding MC non-closure Tracking Total
*|<1.6 yjet
|
ATLAS Preliminary p+Pb, sNN= 5.02 TeV, 28 nb-1
= 5.02 TeV, 25 pb-1
s , pp
< 60 GeV
jet
pT
45 <
[GeV]
pT
1 10 102
[%])TD(pRδ
-40 -20 0 20 40 60
JES JER Unfolding MC non-closure Tracking Total
*|<1.6 yjet
|
ATLAS Preliminary p+Pb, sNN= 5.02 TeV, 28 nb-1
= 5.02 TeV, 25 pb-1
s , pp
< 210 GeV
jet
pT
160 <
Figure 5: Summary of the systematic uncertainties forRD(pT)ratios, for jets in the 45–60 GeVpTinterval (left) and in the 160–210 GeVpTinterval (right). The systematic uncertainties due to JES, JER, unfolding, MC non-closure and tracking are shown along with the total systematic uncertainty from all sources.
systematic uncertainties are added in quadrature.
The correlations between the various systematic components in the two collision systems are considered when taking the ratios of p
+Pb to pp fragmentation functions. For the JES uncertainty each source of uncertainty is classified as either correlated or uncorrelated between the two systems depending on its origin. The JER, unfolding and MC non-closure uncertainties are taken to be uncorrelated. For the tracking-related uncertainties the variation in the selection requirements, tracking in dense environments, fake rates, and parameterization of the e
fficiency corrections are taken as uncorrelated. The first three of these are conservatively considered as uncorrelated because the tracking system was augmented with the IBL and the tracking algorithm changed between the p
+Pb and pp data-taking periods. For the correlated uncertainties the ratios are reevaluated applying the variation to both collision systems; the resulting variation in the ratio from the central values is used as the correlated systematic uncertainty.
The uncertainties due to the track-to-particle matching and the inactive material in the MC samples are
taken as correlated between p
+Pb and pp collisions. The total systematic uncertainties on the R
D(z)and
R
D(pT)distributions are shown in Figures 4 and 5, respectively for two p
jetTintervals.
z
−2
10 10−1 1
) zD(
−4
10
−2
10 1 102
104
106
108 -1
= 5.02 TeV, 26 pb s
, pp
|<1.6 *jet
y
|
ATLAS Preliminary
z
−2
10 10−1 1
< 60 GeV x 10 0 jet
T
p 45 <
< 80 GeV x 10 1 jet
T
p 60 <
< 110 GeV x 10 2 jet
p T
80 <
< 160 GeV x 10 3 jet
T
p 110 <
< 210 GeV x 10 4 jet
p T
160 <
< 260 GeV x 10 5 jet
p T
210 <
= 5.02 TeV, 28 nb-1
sNN
+Pb, p
0-90%
|<1.6 *jet
y
|
ATLAS Preliminary
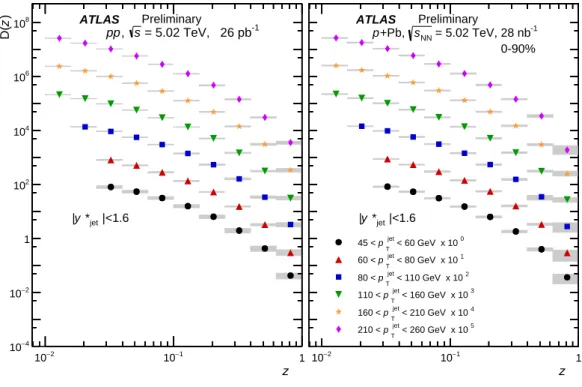
Figure 6: Fragmentation functions as a function of the trackzinpp(left) andp+Pb collisions (right) for thepjetT selections used in this analysis. The fragmentation functions in both collision systems are offset by multiplicative factors for clarity as noted in the legend. The statistical uncertainties are shown as error bars and the systematic uncertainties are shown as shaded boxes. In many cases the statistical uncertainties are smaller than the marker size.
7 Results
The D(z ) and D( p
T) distributions in both collision systems are shown in Figures 6 and 7, respec- tively. Figure 8 compares the D(z ) distribution in pp collisions at 5.02 TeV to the three event gener- ators (Pythia6, Pythia8, and Herwig++) using the tune and PDF sets described in Sec. 3 for the six p
Tjetintervals. The P
ythia8 generator provides the best description of the data, generally agreeing within about 5% except for some deviations of 10% over the kinematic range used here. P
ythia6 agrees within approximately 25% when compared with the central values of the data and Herwig++ agrees within ap- proximately 20% except for the highest z region where there are some larger deviations. Qualitatively similar agreement with these generators was reported by ATLAS in the measurement of fragmentation functions in 7 TeV pp collisions [35]. Figure 9 shows the pp fragmentation functions compared to two theoretical calculations. These predictions use a slightly di
fferent definition of z that can introduce a dis- crepancy between the fragmentation functions of approximately 1%. The calculation in Ref. [36, 37]
provides fragmentation functions with next-to-leading order (NLO) accuracy as well as a resummation
of logarithms in the jet radius. The calculation in Ref. [38] is at NLO and uses the approximation that
the jet cone is narrow. For the parton to charged hadron fragmentation functions, both calculations use
DSS07 [39]. The uncertainties on the theoretical calculation are not evaluated, including the uncertainty
on DSS07 which is common to both calculations. The calculations are systematically higher than the data
[GeV]
pT
1 10 102
) TpD(
−4
10
−2
10 1 102
104
106
108
| <1.6 *jet
y
| ATLAS
= 5.02 TeV s
, pp 25 pb -1
Preliminary
< 260 GeV x 10 5 jet
p T 210 <
< 210 GeV x 10 4 jet
p T 160 <
< 160 GeV x 10 3 jet
p T 110 <
< 110 GeV x 10 2 jet
p T 80 <
< 80 GeV x 10 1 jet
p T 60 <
< 60 GeV x 10 0 jet
p T 45 <
[GeV]
pT
1 10 102
) TpD(
| <1.6 *jet
y
| ATLAS
= 5.02 TeV, 0-90%
sNN
+Pb, p 28 nb -1
Preliminary
Figure 7: Fragmentation functions as a function of the trackpTinpp(left) andp+Pb collisions (right) for thepjetT selections used in this analysis. The fragmentation functions in both collision systems are offset by multiplicative factors for clarity as noted in the legend. The statistical uncertainties are shown as error bars and the systematic uncertainties are shown as shaded boxes. In many cases the statistical uncertainties are smaller than the marker size.
and agree generally within 20–30%. Larger deviations are observed at low and high z regions. The DSS07 fragmentation functions have a minimum z of 0.05 and the calculations use extrapolated fragmentation functions in the region below z
=0.05.
Figures 10 and 11 show the ratios of fragmentation functions in p
+Pb collisions to those inpp collisions,
as a function of z and p
Trespectively for p
Tjetfrom 45 to 260 GeV. Over the kinematic range selected
here, the D( z) and D( p
T) distributions show deviations from unity of up to approximately 5% (up to
10% for 60–80 GeV jet selections) for z
<0.1 and p
T <10 GeV. The deviations are outside the reported
systematic uncertainties by at most a couple of percent and always less than 1.5
σof the systematic
uncertainties. At higher z and p
Tvalues the ratios are consistent with unity. At the highest z points for the
160–210 GeV and 210–260 GeV jet selections deviations from unity of approximately 1.4
σand 2.4
σof combined statistic and systematic uncertainties, respectively are observed. This is not observed in the
D( p
T) distributions. In some p
Tjetbins there is a slight decrease of the values of RD (z ) and RD (p
T) with
increasing z and p
T; however, the effect is not significant within the systematic uncertainties.
z
−1
10 1
simulation / data
0.5 1 1.5
PYTHIA6 AUET2B CTEQ6L1 < 60 GeV
jet
p T
45 <
ATLAS Preliminary
= 5.02 TeV, 25 pb -1
pp s
z
−1
10 1
simulation / data
PYTHIA8 A14 NNPDF23LO < 80 GeV
jet
p T
60 <
| < 1.6 *jet
y
|
ATLAS Preliminary
z
−1
10 1
simulation / data
HERWIG++ UEEE5 CTEQ6L1 < 110 GeV
jet
p T
80 <
ATLASPreliminary
z
−2
10 10−1 1
simulation / data
0.5 1 1.5
PYTHIA6 AUET2B CTEQ6L1 < 160 GeV
jet
p T
110 <
ATLAS Preliminary
= 5.02 TeV, 25 pb -1
s pp
z
−2
10 10−1 1
simulation / data
PYTHIA8 A14 NNPDF23LO < 210 GeV
jet
p T
160 <
| < 1.6 *jet
y
|
ATLAS Preliminary
z
−2
10 10−1 1
simulation / data
HERWIG++ UEEE5 CTEQ6L1 < 260 GeV
jet
p T
210 <
ATLAS Preliminary
Figure 8: Ratios of the truth levelD(z) distributions from Pythia6, Pythia8, and Herwig++to the unfolded pp data for the sixpjetT selections used in this analysis. The statistical uncertainties are shown as error bars and the systematic uncertainties on the data are shown as the shaded region around unity.
z
−1
10 1
theory / data
0.5 1
1.5 jet < 60 GeV
p T
45 <
ATLAS Preliminary
= 5.02 TeV, 25 pb -1
s pp
z
−1
10 1
theory / data
< 80 GeV
jet
p T
60 <
| < 1.6 *jet
y
|
ATLAS Preliminary
z
−1
10 1
theory / data
Kang et al.
Kaufmann et al.
< 110 GeV
jet
p T
80 <
ATLASPreliminary
z
−2
10 10−1 1
theory / data
0.5 1
1.5 jet < 160 GeV
p T
110 <
ATLAS Preliminary
= 5.02 TeV, 25 pb -1
s pp
z
−2
10 10−1 1
theory / data
< 210 GeV
jet
p T
160 <
| < 1.6 *jet
y
|
ATLAS Preliminary
z
−2
10 10−1 1
theory / data
Kang et al.
Kaufmann et al.
< 260 GeV
jet
p T
210 <
ATLAS Preliminary
Figure 9: Ratios of theoretical calculations from Ref. [36, 37] (solid points) and Ref. [38] (open points) to the unfolded pp D(z) distributions for the six pTjet selections used in this analysis. The statistical uncertainties are shown as error bars and the systematic uncertainties on the data are shown as the shaded region around unity. The uncertainties on the theoretical calculations are not shown.
z
−1
10 1
)zD(
R
0.6 0.8 1 1.2
1.4 jet < 60 GeV
p T
45 <
|<1.6 *jet
y ATLAS Preliminary |
z
−1
10 1
)zD(
R
< 80 GeV
jet
p T
60 <
ATLAS Preliminary
, 0-90%
= 5.02 TeV, 28 nb-1
sNN
+Pb, p
= 5.02 TeV, 25 pb-1
, s pp
z
−1
10 1
)zD(
R
< 110 GeV
jet
p T
80 <
ATLAS Preliminary
z
−2
10 10−1 1
)zD(
R
0.6 0.8 1 1.2 1.4
< 160 GeV
jet
p T
110 <
|<1.6 *jet
y ATLAS Preliminary |
z
−2
10 10−1 1
)zD(
R
< 210 GeV
jet
p T
160 <
ATLAS Preliminary
, 0-90%
= 5.02 TeV, 28 nb-1
sNN
+Pb, p
= 5.02 TeV, 25 pb-1
s , pp
z
−2
10 10−1 1
)zD(
R
< 260 GeV
jet
p T
210 <
ATLAS Preliminary
Figure 10: Ratios of fragmentation functions as a function ofz inp+Pb to those inppcollisions for the sixpjetT intervals. The statistical uncertainties are shown as error bars and the total systematic uncertainties are shown as shaded boxes.
[GeV]
pT
1 10
) TpD(
R
0.6 0.8 1 1.2 1.4
< 60 GeV
jet
p T
45 <
|<1.6 *jet
y ATLAS Preliminary |
[GeV]
pT
1 10
) TpD(
R
< 80 GeV
jet
p T
60 <
ATLAS Preliminary
, 0-90%
= 5.02 TeV, 28 nb-1
sNN
+Pb, p
= 5.02 TeV, 25 pb-1
s , pp
[GeV]
pT
1 10
) TpD(
R
< 110 GeV
jet
p T
80 <
ATLAS Preliminary
[GeV]
pT
1 10 102
) TpD(
R
0.6 0.8 1 1.2 1.4
< 160 GeV
jet
p T
110 <
|<1.6 *jet
y ATLAS Preliminary |
[GeV]
pT
1 10 102
) TpD(
R
< 210 GeV
jet
p T
160 <
ATLAS Preliminary
, 0-90%
= 5.02 TeV, 28 nb-1
sNN
+Pb, p
= 5.02 TeV, 25 pb-1
s , pp
[GeV]
pT
1 10 102
) TpD(
R
< 260 GeV
jet
p T
210 <
ATLAS Preliminary
Figure 11: Ratios of fragmentation functions as a function ofpTinp+Pb to those inppcollisions for the sixpjetT intervals. The statistical uncertainties are shown as error bars and the total systematic uncertainties are shown as shaded boxes.