ATLAS-CONF-2013-105 04November2013
ATLAS NOTE
ATLAS-CONF-2013-10
November 2, 2013
Measurement of the centrality dependence of inclusive jet production in p + Pb data at √
s
NN= 5.02 TeV with the ATLAS detector
The ATLAS Collaboration
Abstract
ATLAS has measured the centrality dependence of jet production in
√sNN =
5.02 TeV
p+Pb collisions at the LHC. The
p+Pb collision centrality was characterized using the total transverse energy measured in the pseudorapidity interval 3.2
< η <4.9 in the direction of the lead beam. Jets were reconstructed from energy deposits measured in the ATLAS calorimeter using the anti-k
talgorithm with
R=0.4. The per-event jet yields were measured in di
fferent centrality selections as a function of jet rapidity and transverse momentum (
pT).
The ratios of jet spectra between different centrality selections, corrected for the centrality dependent partonic luminosities, show a strong suppression of jet production at all
pTat forward rapidities and at large
pTat mid-rapidity.
c
Copyright 2013 CERN for the benefit of the ATLAS Collaboration.
Reproduction of this article or parts of it is allowed as specified in the CC-BY-3.0 license.
1 Introduction
Proton–lead ( p
+Pb) collisions at the Large Hadron Collider (LHC) provide a unique opportunity to study possible violations of factorisation in hard scattering processes involving a nuclear projectile [1].
Previous studies in deuteron-gold (d
+Au) collisions at RHIC showed such violations in the suppressedproduction of very forward hadrons with transverse momenta up to 4 GeV [2, 3, 4]. Studies of forward dihadron angular correlations at RHIC also showed a much weaker dijet signal in d
+Au collisions than inpp collisions [4, 5]. These effects have been attributed to saturation of the parton distributions in the gold nucleus [6, 7, 8], to the nuclear parton distribution function [9], or to the higher-twist contributions to the cross-section enhanced by the forward kinematics of the measurement [10] or the presence of a large nucleus [11]. The extended kinematic reach of p
+Pb measurements at the LHC allows the study of hardscattering processes that produce forward hadrons or jets over a much wider rapidity and p
Trange. Such measurements can determine whether the factorisation violations observed at RHIC persist at higher energy and, if so, how the resulting modifications vary as a function of particle or jet p
T. The results of such measurements could test the competing descriptions of the RHIC results, and, more generally, provide new insight into the physics of hard scattering processes involving a nuclear target.
ATLAS has measured the centrality dependence of high-p
Tjet production in p
+Pb collisions at√
s
NN =5.02 TeV. The measurement was performed using a data set corresponding to an integrated luminosity of 31 nb
−1recorded in 2013. Jets were reconstructed from energy deposits measured in the ATLAS calorimeter using the anti-k
talgorithm with R
=0.4 [12]. The centrality of p
+Pb collisions wascharacterised using the total transverse energy measured in the pseudorapidity interval 3.2 < η < 4.9 in the direction of the lead beam. A Glauber model [13] was used to determine the average number of nucleon-nucleon collisions,
hNcolli, in each centrality interval. The centrality dependence of per-eventjet yields, (1/N
evt)(d
2N
jet/d p
Tdy), was evaluated using the central-to-peripheral ratio,
R
centCP ≡1 R
coll1/N
evtcentd
2N
jetcent/d p
Tdy 1/N
evtperiphd
2N
jetperiph/d p
Tdy , (1) where R
collrepresents the ratio of the
hNcollivalue in a given centrality interval to that in the most pe- ripheral interval included in the analysis, R
coll≡ hNcolli/hNcollperiphi. TheR
CPmeasurements are presented as a function of the centre-of-mass rapidity, y
∗, and jet transverse momentum. The R
CPis sensitive to relative modifications in the jet rate between the p
+Pb event centralities and the geometric expectation.In addition to R
CP, results are presented for the nuclear modification factor R
PYTHIA,centpPb ≡
1
T
pA1/N
evtcentd
2N
jetcent/d p
Tdy
d
2σ
jetpp/d p
Tdy , (2) where T
pAis the mean value of the nuclear overlap function T
pA(b)
=R+∞−∞
ρ(b, z)dz in the given central- ity interval, where ρ(b, z) is the nucleon density at impact parameter b and longitudinal position z, and d
2σ
jetpp/d p
Tdy is a PYTHIA MC reference for the pp jet cross-section at
√s
=5.02 TeV. The R
PYTHIApPbquantifies the absolute modification in the jet rate relative to the geometric expectation.
For the 2013 p
+Pb run, the LHC was configured with a 4 TeV proton beam and a 1.57 TeV per- nucleon Pb beam that together produced collisions with a nucleon–nucleon centre-of-mass energy of
√
s
NN=5.02 TeV and a rapidity shift of
−0.47 relative to the ATLAS rest frame1. The run was split into
1ATLAS uses a right-handed coordinate system with its origin at the nominal interaction point (IP) in the centre of the detector and thez-axis along the beam pipe. Thex-axis points from the IP to the centre of the LHC ring, and they-axis points upward. Cylindrical coordinates (r, φ) are used in the transverse plane,φbeing the azimuthal angle around the beam pipe. For the p+Pb collisions, the incident Pb beam travelled in the+zdirection for the first period of data-taking and in the reverse direction for the second period. The pseudorapidity is defined in laboratory coordinates in terms of the polar angleθas η=−ln tan(θ/2).
two periods, with the directions of the proton and lead beams being reversed at the end of the first period.
The first period provided approximately 55% of the integrated luminosity with the Pb beam travelling to positive rapidity and the proton beam to negative rapidity, and the remainder with the beams reversed.
The data analysed in this note are comprised from both periods of data-taking, and the centre-of-mass rapidity, y
∗, is defined so that y
∗< 0 always refers to the downstream proton direction.
2 Experimental setup
The measurements presented in this note are performed using the ATLAS calorimeters, inner detector (ID), minimum-bias trigger scintillators (MBTS), and trigger and data acquisition systems [14]. The ID measures charged particles within
|η|< 2.5 using a combination of silicon pixel detectors, silicon micro- strip detectors, and a straw-tube transition radiation tracker, all immersed in a 2 T axial magnetic field [15]. The ATLAS calorimeter system consists of a liquid argon (LAr) electromagnetic (EM) calorimeter covering
|η|< 3.2, a steel-scintillator sampling hadronic calorimeter covering
|η|< 1.7, a LAr hadronic calorimeter covering 1.5 <
|η|< 3.2, and two LAr electromagnetic and hadronic forward calorimeters (FCal) covering 3.2 <
|η|< 4.9. The EM calorimeters are longitudinally segmented into three compart- ments with an additional pre-sampler layer. The EM calorimeter has a granularity that varies with layer and pseudorapidity. The middle sampling layer, which typically has the largest energy deposit in EM showers, has a
∆η
×∆φ granularity of 0.025
×0.025 over
|η|< 2.5. The hadronic calorimeter has three longitudinally segments with cell sizes
∆η
×∆φ
=0.1
×0.1 for
|η|< 2.5 and 0.2
×0.2 for 2.5 <
|η|< 4.9
2. The FCal consists of two sections that cover 3.1 <
|η|< 4.9. The FCal modules are composed of tung- sten and copper absorbers with liquid argon as the active medium, which together provide 10 interaction lengths of material. The MBTS detect charged particles over 2.1 <
|η|< 3.9 using two hodoscopes of 16 counters positioned at z
= ±3.6 m. The events used in this analysis were recorded using a combinationof minimum-bias and jet triggers [16]. The minimum-bias trigger required hits in at least one counter in each side of the MBTS detector. The jet triggers were formed from a combination of minimum-bias or jet Level-1 triggers and high-level jet triggers implemented with a reconstruction algorithm similar to that applied in the o
ffline analysis. Multiple jet trigger thresholds ranging from 20 GeV to 75 GeV were used with pre-scales that varied with time to accommodate the evolution of the luminosity within an LHC fill.
3 Data selection
In the offline analysis, charged particle tracks were reconstructed in the ID using an algorithm optimised for pp minimum-bias measurements [17]. The p
+Pb events used for this analysis were required to have a reconstructed vertex containing at least two associated tracks, at least one hit in each of the two MBTS hodoscopes, and a difference between times measured on the two sides of less than 10 ns. Events containing multiple p
+Pb collisions (pileup) were suppressed by rejecting events with two reconstructed vertices which were associated with
Σp
T> 5 GeV of reconstructed tracks. Events with a rapidity gap (defined by the absence of calorimeter clusters) of greater than two units on the Pb-going side of the detector were also removed from the analysis. Such events arise primarily from electromagnetic or di
ffractive excitation of the proton. The integrated luminosity after event selection corresponds to approximately 25 nb
−1.
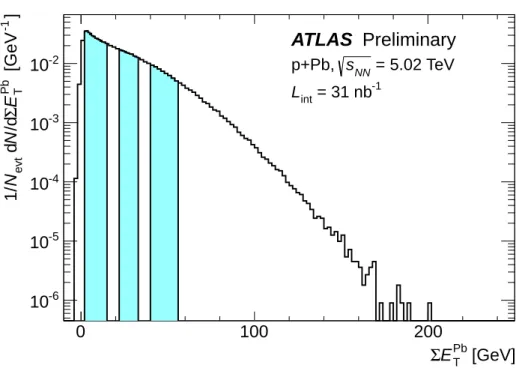
The centrality of the p
+Pb events selected for analysis was characterised by the total transverse energy in the Pb-going FCal,
ΣETPb. The
ΣEPbTdistribution for minimum-bias p
+Pb collisions passing the above-described event selections is presented in Fig. 1. Following standard techniques [18], centrality
2An exception is the third (outermost) sampling layer, which has a segmentation of 0.2×0.1 up to|η|=1.7.
[GeV]
Pb
E
TΣ
0 100 200
]
-1[GeV
Pb TE Σ /d N d
evtN 1/
10
-610
-510
-410
-310
-2ATLAS Preliminary
= 5.02 TeV sNNp+Pb, = 31 nb-1
Lint
Figure 1:
ΣETPbdistribution for minimum-bias p
+Pb collisions recorded during the 2013 run. The vertical divisions correspond to the six centrality intervals used in this work. The right-most region corresponds to the 0-10% events, and the second from left region is the 60-90%.
intervals were defined in terms of percentiles of the
ΣEPbTdistribution after accounting for an estimated ine
fficiency of 2
±2% for inelastic p
+Pb collisions to pass the applied event selections. The following centrality intervals were used in this analysis, in order from most central to most peripheral: 0–10%, 10–20%, 20–30%, 30–40%, 40–60%, 60–90%, with the 60-90% interval serving as the reference in the R
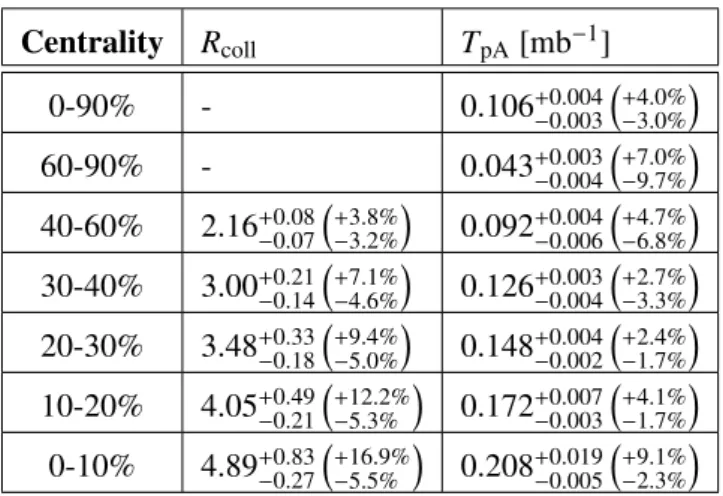
CP. Using procedures from Ref. [19] a Glauber Monte Carlo [13, 20] analysis was used to calculate the average number of nucleon-nucleon collisions,
hNcolli, and T
pAfor each of the centrality intervals. The resulting R
colland T
pAvalues and corresponding uncertainties are shown in Table 1. These values agree with those obtained for the 2012 pilot p
+Pb run [19] to better than 1%.
4 Monte Carlo sample
The performance of the jet reconstruction algorithms was evaluated using Monte Carlo (MC)
√s
=5.02 TeV pp dijet events generated using PYTHIA6 [21] (version 6.425, AMBT2 tune [22], CTEQ6L1 PDFs) and fully simulated using GEANT4 [23, 24]. Several samples of such events were produced for di
fferent intervals of generator-level R
=0.4 “truth” jet p
Tthat spanned 10 < p
T< 800 GeV. Separate sets of 3.25 million events each were generated for the two di
fferent beam directions. For each beam di- rection, the momentum four-vectors of the generated particles were longitudinally boosted by a rapidity of
±0.465 to match the corresponding beam conditions. The simulated events were digitised using dataconditions appropriate to the two periods of the 2013 p
+Pb run and reconstructed using the same algo- rithms that were applied to the experimental data. A separate sample of 12 million events was obtained by overlaying simulated
√s
=5.02 TeV pp dijet collisions on to minimum-bias p
+Pb events recorded
during the 2013 run. These events were used to evaluate the impact of the underlying event (UE) on the
jet reconstruction for jet p
T< 200 GeV.
Centrality
R
collT
pA[mb
−1] 0-90% - 0.106
+−0.0030.004+4.0%−3.0%
60-90% - 0.043
+−0.0040.003+7.0%−9.7%
40-60% 2.16
+−0.080.07+3.8%−3.2%
0.092
+−0.0060.004+4.7%−6.8%
30-40% 3.00
+0.21−0.14+7.1%−4.6%
0.126
+0.003−0.004+2.7%−3.3%
20-30% 3.48
+0.33−0.18+9.4%−5.0%
0.148
+0.004−0.002+2.4%−1.7%
10-20% 4.05
+0.49−0.21+12.2%−5.3%
0.172
+0.007−0.003+4.1%−1.7%
0-10% 4.89
+0.83−0.27+16.9%−5.5%
0.208
+0.019−0.005+9.1%−2.3%
Table 1: Average R
colland T
pAvalues for the centrality intervals used in this analysis along with total systematic uncertainties expressed both as absolute and relative uncertainties. The R
collvalues are with respect to 60-90% events, where
hNcolli=2.98
+−0.290.21.
5 Jet reconstruction
The jet reconstruction and UE subtraction procedures were adapted from those used by ATLAS in Pb+Pb collisions, which are described in detail in Refs. [25, 26], and are summarised in the following. Calorime- ter cells were combined into towers with segmentation
∆η
×∆φ
=0.1
×0.1, and the anti-k
talgorithm was applied to the towers. A two-step iterative procedure was used to obtain an event-by-event estimate of the UE energy density while excluding contributions from jets to that estimate. This estimate of the UE was constructed separately in each calorimeter layer and in
∆η
=0.1 strips to accommodate the
η-dependent variations in UE activity present in p
+Pb collisions. For each tower included in a given jet,the UE energy for cells in the tower was subtracted to correct the cell energy. The jet kinematics were then constructed to be the four-vector sum of all such cells, taking the four-vectors to be massless. The mean subtracted UE energy was 2.4 GeV (1.4 GeV) for jets with
|y∗|< 1 (y
∗<
−3).At the analysis stage, a small correction, typically a few per cent, was applied to the transverse momentum of those jets which were erroneously included in the background estimate. Finally, the jet energies were corrected to account for the calorimeter energy response using an η- and E
T-dependent multiplicative factor that was derived from the MC simulations [27].
6 Performance
The jet reconstruction capabilities were evaluated in the MC samples by applying the same subtraction and reconstruction procedure as was applied to data. The resulting set of reconstructed jets was compared with their corresponding generator jets, which were produced by applying the anti-k
talgorithm to the final-state particles produced by PYTHIA. Each generator jet was matched to a reconstructed jet and the di
fference in p
Tbetween the two jets was studied as a function of jet p
Tand η. The reconstruction efficiency for p
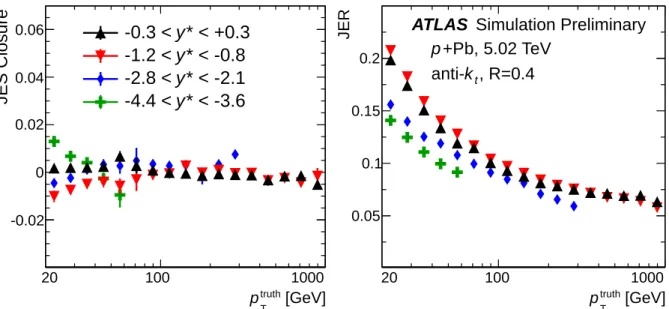
T> 25 GeV jets is > 99%. The performance is quantified by the means and standard deviations of the
∆p
T/ p
Tdistributions, referred to as the jet energy scale (JES) closure and jet energy resolution (JER), respectively. The JES and JER are shown in Figure 2 for selected rapidity bins. The closure is better than
≤1% at all p
T> 25 GeV, and
≤0.5% in the majority of the p
Tand rapidity bins.
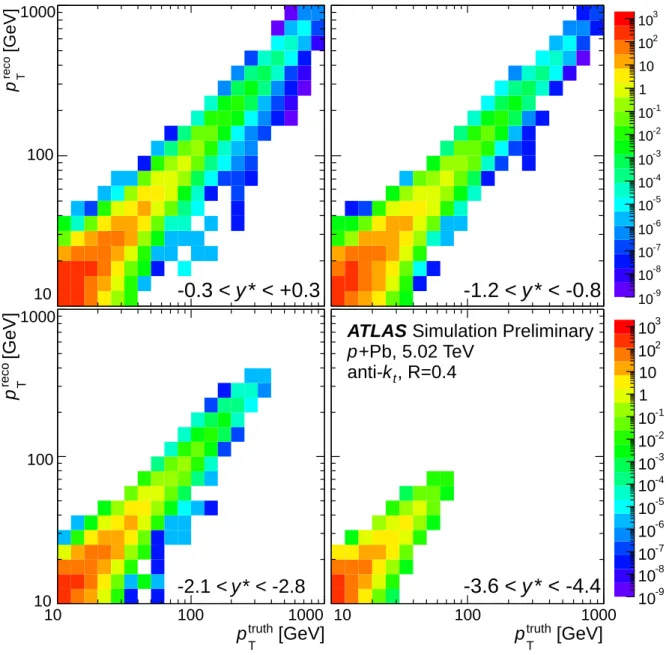
Response matrices were populated by recording each generator-reconstructed jet pair and were con-
structed separately for each y
∗interval used in the analysis. These are shown in Figure 3 for a selection
[GeV]
truth
pT
JES Closure
-0.02 0 0.02 0.04 0.06
20 100 1000
* < +0.3 y
-0.3 <
* < -0.8 y
-1.2 <
* < -2.1 y
-2.8 <
* < -3.6 y
-4.4 <
[GeV]
truth
pT
JER
0.05 0.1 0.15 0.2
20 100 1000
ATLAS Simulation Preliminary +Pb, 5.02 TeV
p
, R=0.4 k
tanti-
Figure 2: Jet energy scale closure (JES Closure, left plot) and jet energy resolution (JER, right plot) for
√
s
=5.02 TeV, R
=0.4 jets in select rapidity bins.
of rapidity bins in the pure PYTHIA
√s
NN =5.02 TeV MC. These matrices quantify the amount of p
Tmigration introduced by the reconstruction procedure and detector response. For the p
Tranges studied in these results, the proportion of jets with reconstructed p
Tin the same bin as their truth p
Tmonotoni- cally increases with truth p
Tand is 50-70%. The effects of the UE on the jet response in different p
+Pbcentralities has been evaluated using the MC overlay sample. The centrality dependence in the response decreases with increasing jet p
T, and the MC overlay sample is used to determine the p
Trange for which the UE effects are negligible in all centrality intervals studied.
7 Data Analysis
Jets in p
+Pb collisions are selected by the minimum-bias triggers and jet triggers described above. Intotal, six trigger thresholds are used in p
+Pb data-taking for jets in
|η|< 3.2 and a low-threshold trigger for jets in
|η|> 3.2. The sampled luminosity (defined as the luminosity divided by the mean prescale) of the jet triggers increases with increasing trigger threshold. The efficiency of the various triggers was determined with respect to the minimum-bias trigger and to low-p
Tjet triggers, requiring the same association of the o
ffline jet to an online trigger jet as is used to select triggered o
ffline jets. For simplicity, each p
Tbin is filled with jets selected by only one trigger. In a given p
Tbin, jets are selected by the lowest-threshold jet trigger for which the e
fficiency has been determined to be > 99%. No additional corrections for the trigger e
fficiency are applied.
The detector level per-event jet yields in p
+Pb collisions are constructed via1
N
evtd
2N
jetd p
Tdy
∗ =1
N
evtN
jet∆
p
T∆y
∗(3)
where N
evtis the total (unprescaled) number of MB events sampled by ATLAS, N
jetis the trigger-selected
yield of jets, corrected for the instantaneous trigger prescale during data-taking, and
∆p
Tand
∆y
∗are the
widths of the p
Tand y
∗bins. The centrality-dependent yields are constructed by restricting N
evtand N
jetto come from p
+Pb events with a given range ofΣE
PbT.
102 103
[GeV]
reco Tp
10 100 1000
* < +0.3 y
-0.3 <
[GeV]
antikt4Truth pT
102 103
[GeV] Tantikt4HIItrEM p
102
103
10-9
10-8
10-7
10-6
10-5
10-4
10-3
10-2
10-1
1 10 102
103
* < -0.8 y
-1.2 <
[GeV]
truth
p
T[GeV]
reco Tp
* < -2.8 y
-2.1 <
10 100 1000
10 100 1000
[GeV]
truth
p
T102
103
10-9
10-8
10-7
10-6
10-5
10-4
10-3
10-2
10-1
1 10 102
103
10 100 1000
* < -4.4 y
-3.6 <
ATLAS Simulation Preliminary +Pb, 5.02 TeV
p
, R=0.4 k
tanti-
Figure 3: R
=0.4 jet p
Tresponse matrices in indicated rapidity intervals obtained from simulations of the ATLAS detector response to PYTHIA-generated jets (see text).
Furthermore, the per-event yields in p
+Pb collisions are restricted to thep
Trange where the MC studies described above have determined that the jet response in the calorimeter is independent of the p
+Pb centrality. This range is rapidity-dependent. This range is p
T> 100 GeV for jets in
−0.3< y
∗<
+0.3, but the lower
p
Tcutoff decreases monotonically with more forward rapidity bins. In the most forward rapidity interval,
−4.4< y
∗<
−3.6, where the centrality dependence of the underlying evente
ffects is vanishing at all p
T, yields are reported for jets with p
T> 25 GeV.
The detector level measurements of the p
+Pb yields are corrected for jet energy resolution and resid-ual distortions of the jet energy scale in each rapidity interval by the use of p
T-dependent bin-by-bin
correction factors C
pPb( p
T, y
∗) obtained from the ratio of the reconstructed and truth jet distributions,
according to
C
pPb( p
T, y
∗)
=N
truthjet(p
T, y
∗) N
recojet(p
T, y
∗)
(4) where N
truthjet(N
recojet) is the number of truth jets in the given p
truthT( p
recoT) bin in the 5.02 TeV MC.
Since the determination of the correction factors is sensitive to the shape of the MC truth jet distri- bution, the transfer matrices used to generate them were re-weighted to provide a better match between the reconstructed MC and data distributions. A separate reweighting was performed for the p
+Pb jetyield in each centrality interval, resulting in changes of 1-5% from the original correction factors be- fore reweighting. The final correction on the p
+Pb yields is at most 20%, and is typically
≤10% for p
T> 50 GeV. These corrections are applied to give the particle-level per-event yield in p
+Pb collisions,1 N
evtd
2N
jetd p
Tdy
∗corr
=
C
pPb( p
T, y
∗) 1 N
evtd
2N
jetd p
Tdy
∗uncorr
(5)
8 Systematic Uncertainties
The R
CPand R
PYTHIApPbmeasurements are subject to systematic uncertainties due to uncertainties in the jet energy scale (JES) and resolution (JER), uncertainties on the bin-by-bin corrections from the di
ffer- ences in the spectral shape between data and MC, an uncertainty from residual ine
fficiency in the trigger selection, and the uncertainty on estimates of the geometric quantities R
coll(in the R
CP) and T
pA(in the R
PYTHIApPb).
Uncertainties in the JES and JER influence the correction of the p
+Pb spectra. The uncertainty in the JES is taken from in situ ATLAS studies of the calorimeter response and systematic variations in the jet response in MC simulation [27], and the uncertainty in the JER is taken from in situ studies of the dijet energy balance [28]. The JES uncertainty is
.4% for jets in the measured p
Trange in
|y∗|< 2.8, and
.11% for jets in
|y∗|> 2.8. The JER uncertainty is 10-20% for the kinematic range of jets used in this work. The resulting systematic uncertainties in the R
CP(δR
sysCP) and R
PYTHIApPb(δR
PYTHIA,syspPb) were evaluated by producing new response matrices, generating new correction factors, and calculating the new R
CPand R
PYTHIApPbresults. Since the correction factors for the p
+Pb spectra are affected to a similardegree by variations in the JES and JER, the e
ffects tend to cancel in the R
CPratio, and the resulting δR
sysCPare small. This is not the case for the R
PYTHIApPb. Since the p
+Pb yields are only measured in a p
Trange where the response has been determined to be independent of the p
+Pb event centrality, nocentrality-dependent uncertainties in the JES or JER are considered.
Furthermore, di
fferences in the spectral shape between data and MC create the need for bin-by-bin correction factors to reweight the MC for better correspondence with the data. Conservatively, the entire change in the results introduced by the reweighting is taken as a systematic uncertainty. Thus, the R
CPand R
PYTHIApPbare determined using the correction factors before and after reweighting, with the di
fferences δR
sysCPand δR
PYTHIA,syspPbadded to the total systematic uncertainty.
As the jet triggers used for the data selection have been evaluated to have > 99% efficiency in the respective p
Tregions where they are used to select jets, an uncertainty of 1% is chosen for the centrality selected p
+Pb yields in the range 20< p
T< 125 GeV. This uncertainty is taken to be uncorrelated between the p
+Pb centralities, resulting in a 1.4% uncertainty on theR
CPwhen added in quadrature from the numerator and denominator in these quantities and 1% on the R
PYTHIApPb.
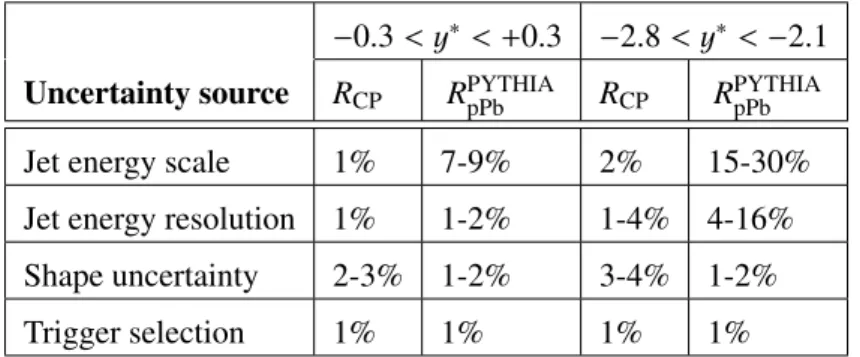
Table 2 shows the typical size of the systematic uncertainty from the various sources described above on the R
CPand the R
pPbin two rapidity bins.
The geometric quantities R
colland T
pAand their uncertainties are listed in Table 1. In general, the
uncertainties are asymmetric. Uncertainties in R
collare largest for the most central to most peripheral
−0.3
< y
∗<
+0.3 −2.8< y
∗<
−2.1 Uncertainty sourceR
CPR
PYTHIApPbR
CPR
PYTHIApPbJet energy scale 1% 7-9% 2% 15-30%
Jet energy resolution 1% 1-2% 1-4% 4-16%
Shape uncertainty 2-3% 1-2% 3-4% 1-2%
Trigger selection 1% 1% 1% 1%
Table 2: Summary of the various sources of systematic uncertainty and their estimated impact on the R
CPand R
pPbmeasurement in two rapidity bins.
ratio (0-10%/60-90%), where they are
+16/−6%, and smallest in the 40-60%/60-90% ratio, where they are
+4/
−3%. Uncertainties in T
pAare largest in the most central (0-10%) and most peripheral (60-90%) centrality intervals, where they reach
±9%, and smaller for intervals in the middle of thep
+Pb centrality range, where the reach a minimum of
+3/−2% for the 20-30% interval.
9 Results
The corrected R
CPand R
PYTHIApPbare presented in Figures 4, 5, 6 and 7. In each figure, the systematic uncertainties from the energy scale and resolution, the MC corrections and trigger efficiency are shown as boxes around each data point. The systematic uncertainties from R
coll(in the R
CP) and T
pA(in the R
PYTHIApPb) are independent of p
Tand y
∗and are shown as shaded boxes on the edges of the horizontal dotted line at 1.
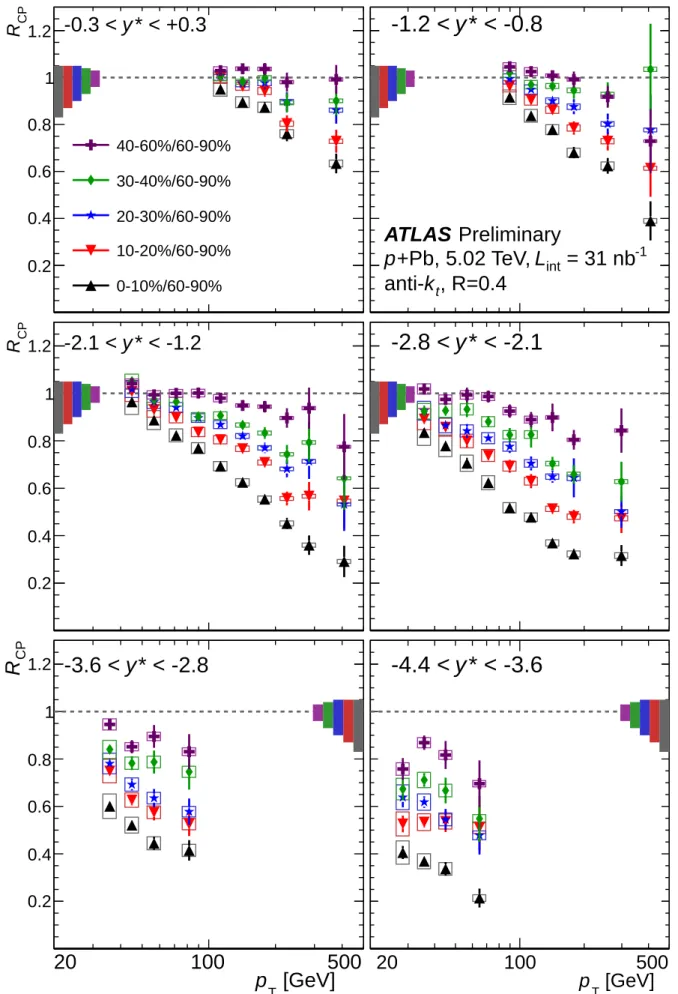
Figure 4 shows the R
CPfor R
=0.4 jets in fixed rapidity bins. The R
CPshows a strong variation with centrality relative to the geometric expectation. The 0-10%/60-90% R
CPis suppressed at mid-rapidity for p
T> 150 GeV jets and at all p
Tat sufficiently forward rapidity. Near mid-rapidity, the 40-60%/60-90%
R
CPis consistent with unity up to 100-200 GeV, but indicates a small suppression at higher p
T. In all rapidity bins studied, the R
CPdecreases with increasing p
Tand in more central collisions.
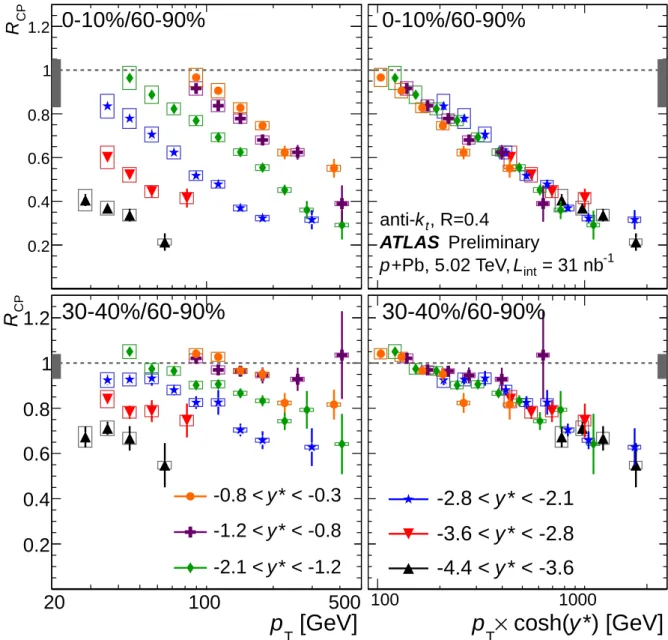
To illustrate better the rapidity dependence of the R
CP, Figure 5 shows the R
CPin fixed centrality windows with multiple rapidities in each panel. The plots on the left side show that at fixed p
T, the R
CPsystematically decreases with more forward rapidity. Given the suppression pattern as a function of rapidity, a natural question is if it is possible to find a single relationship in the rapidity bins as a function of jet kinematics alone. To test this, the R
CPin each rapidity bin is plotted against the quantity p
T×cosh(y
∗)
≈p, where y
∗is the centre of the rapidity bin, and p is therefore approximately the total energy of the jet. This is plotted on the right plots in Figure 5. When plotted against this variable, the R
CPin each of the rapidity bins shown falls along the same line. The slope of the common R
CPvs.
p
T×cosh(y
∗) curve is di
fferent in each centrality interval (two of which are shown in the Figure).
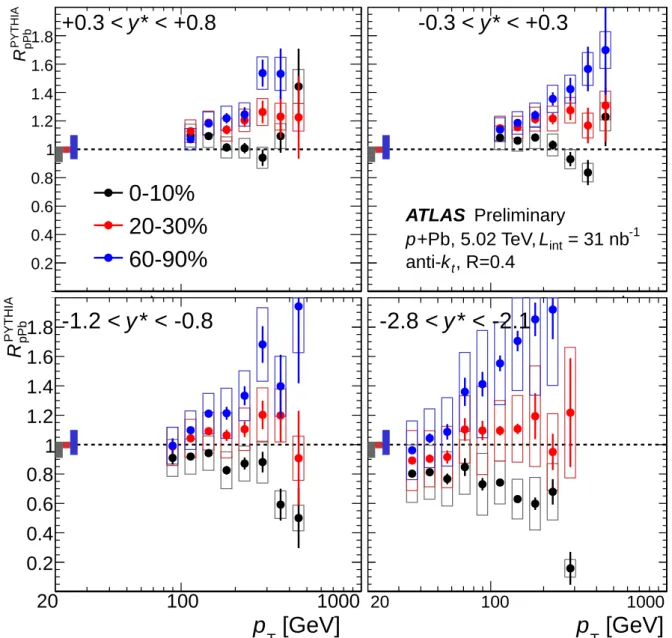
As an evaluation of the total jet rate in p
+Pb, theR
pPbis made using a PYTHIA truth jet spectrum as the reference (called the R
PYTHIApPb) and is shown in Figure 6. In all rapidity bins studied, the R
PYTHIApPbis slowly increasing with p
Tdue to a slight di
fference in the spectra shape between data and MC, rang- ing from
≈0.8-1.2 depending on the jet p
T. This shows that despite the strong effects observed in the centrality-dependent R
CP, we do not observe a modification of the total yield of jets relative to the geometric expectation.
Figure 7 shows the R
PYTHIApPbin different centrality intervals. The central (0-10%) and peripheral
(60-90%) R
PYTHIApPbare observed to have a larger and smaller slope than the inclusive R
PYTHIApPb. Thus,
CP
R
0.2 0.4 0.6 0.8 1
1.2 -0.3 < y * < +0.3
40-60%/60-90%
30-40%/60-90%
20-30%/60-90%
10-20%/60-90%
0-10%/60-90%
CP
R
0.2 0.4 0.6 0.8 1 1.2
ATLAS Preliminary
= 31 nb
-1L
int+Pb, 5.02 TeV, p
, R=0.4 k
tanti-
* < -0.8 y
-1.2 <
CP
R
0.2 0.4 0.6 0.8 1
1.2 -2.1 < y * < -1.2 R
CP0.2 0.4 0.6 0.8 1
1.2 -2.8 < y * < -2.1
CP
R
0.2 0.4 0.6 0.8 1 1.2
20 100 500
[GeV]
p
T* < -2.8 y
-3.6 < R
CP0.2 0.4 0.6 0.8 1 1.2
[GeV]
p
T* < -3.6 y
-4.4 <
20 100 500
Figure 4: R
CPfor R
=0.4 jets in
√s
NN =5.02 TeV p
+Pb collisions. Each panel shows the jetR
CPin multiple centrality intervals at a fixed rapidity bin. Error bars on data points represent statistical
9
CP
R
0.2 0.4 0.6 0.8 1
1.2
0-10%/60-90%
RCP0.2 0.4 0.6 0.8 1
1.2
0-10%/60-90%
, R=0.4 k
tanti-
ATLAS Preliminary
= 31 nb
-1L
int+Pb, 5.02 TeV, p
CP
R
0.2 0.4 0.6 0.8 1
1.2 30-40%/60-90%
[GeV]
p
T20 100 500
* < -0.3 y
-0.8 <
* < -0.8 y
-1.2 <
* < -1.2 y
-2.1 <
CPR
0.2 0.4 0.6 0.8 1
1.2
30-40%/60-90%
*) [GeV]
y cosh(
T
× p
100 1000
* < -2.1 y
-2.8 <
* < -2.8 y
-3.6 <
* < -3.6 y
-4.4 <
Figure 5: R
CPfor R
=0.4 jets in
√s
NN =5.02 TeV p
+Pb collisions. Each panel shows theR
CPin jets in multiple rapidity bins at a fixed centrality interval. The top row show the R
CPfor 0-10%
/60-90%
and the bottom row show the R
CPfor 30-40%/60-90%. In the left column, the R
CPis plotted against jet
p
T. In the right column, the R
CPis plotted against the quantity p
Tcosh(y
∗) where y
∗is the midpoint of
the rapidity bin. Error bars on data points represent statistical uncertainties, boxes represent systematic
uncertainties, and the shaded box on the R
CP=1 dotted line indicates the systematic uncertainty on R
collfor that centrality interval.
pPbR
0.2 0.4 0.6 0.8 1
0-10%
RCP0.2 0.4 0.6 0.8 1
0-10%
* < -1.2 y
-0.8 <
* < -2.8 y
-2.1 <
* < -3.6 y
-4.4 <
pPbR
0.2 0.4 0.6 0.8 1 1.2 1.4 1.6 1.8 2 2.2 2.4
60-90%
[GeV]
p
T20 100 500
CPR
0.2 0.4 0.6 0.8 1 1.2 1.4 1.6 1.8 2 2.2
2.4
60-90%
*) [GeV]
y cosh(
T
× p
100 1000
, R=0.4 k
tanti-
ATLAS for Approval
= 31 nb
-1L
int+Pb, 5.02 TeV, p
PYTHIA pPb
R
0.2 0.4 0.6 0.8 1 1.2 1.4 1.6
1.8
+0.3 < y * < +0.8
0-90%
PYTHIA pPb
R
0.2 0.4 0.6 0.8 1 1.2 1.4 1.6
1.8
-0.3 < y * < +0.3
ATLAS Preliminary
= 31 nb
-1L
int+Pb, 5.02 TeV, p
, R=0.4 k
tanti-
PYTHIA pPb
R
0.2 0.4 0.6 0.8 1 1.2 1.4 1.6
1.8 -1.2 < y * < -0.8
[GeV]
p
T20 100 1000
PYTHIA pPb
R
0.2 0.4 0.6 0.8 1 1.2 1.4 1.6
1.8 -2.8 < y * < -2.1
[GeV]
p
T20 100 1000
Figure 6: R
PYTHIApPbfor R
=0.4 jets for 0-90% events in
√s
NN =5.02 TeVp
+Pb collisions. Each panel
shows the R
PYTHIApPbin jets in a di
fferent centre-of-mass rapidity bin. Error bars on data points represent
statistical uncertainties, boxes represent systematic uncertainties, and the shaded box on the R
PYTHIApPb =1
dotted line indicates the systematic uncertainty on T
pA.
pPbR
0.2 0.4 0.6 0.8 1
0-10%
RCP0.2 0.4 0.6 0.8 1
0-10%
* < -1.2 y
-0.8 <
* < -2.8 y
-2.1 <
* < -3.6 y
-4.4 <
pPbR
0.2 0.4 0.6 0.8 1 1.2 1.4 1.6 1.8 2 2.2 2.4
60-90%
[GeV]
p
T20 100 500
CPR
0.2 0.4 0.6 0.8 1 1.2 1.4 1.6 1.8 2 2.2
2.4
60-90%
*) [GeV]
y cosh(
T
× p
100 1000
, R=0.4 k
tanti-
ATLAS for Approval
= 31 nb
-1L
int+Pb, 5.02 TeV, p
PYTHIA pPb
R
0.2 0.4 0.6 0.8 1 1.2 1.4 1.6
1.8
+0.3 < y * < +0.8
0-90%
PYTHIA pPb
R
0.2 0.4 0.6 0.8 1 1.2 1.4 1.6
1.8
-0.3 < y * < +0.3
ATLAS Preliminary
= 31 nb
-1L
int+Pb, 5.02 TeV, p
, R=0.4 k
tanti-
PYTHIA pPb
R
0.2 0.4 0.6 0.8 1 1.2 1.4 1.6
1.8 -1.2 < y * < -0.8
[GeV]
p
T20 100 1000
PYTHIA pPb
R
0.2 0.4 0.6 0.8 1 1.2 1.4 1.6
1.8 -2.8 < y * < -2.1
[GeV]
p
T20 100 1000
PYTHIA pPb
R
0.2 0.4 0.6 0.8 1 1.2 1.4 1.6
1.8
+0.3 < y * < +0.8
0-10%
20-30%
60-90%
PYTHIA pPb
R
0.2 0.4 0.6 0.8 1 1.2 1.4 1.6
1.8
-0.3 < y * < +0.3
ATLAS Preliminary
= 31 nb
-1L
int+Pb, 5.02 TeV, p
, R=0.4 k
tanti-
PYTHIA pPb
R
0.2 0.4 0.6 0.8 1 1.2 1.4 1.6
1.8 -1.2 < y * < -0.8
[GeV]
p
T20 100 1000
PYTHIA pPb