ATLAS-CONF-2021-001 08January2021
ATLAS CONF Note
ATLAS-CONF-2021-001
6th January 2021
Measurement of flow and transverse momentum correlations in Pb+Pb collisions at √
s NN = 5.02 TeV and Xe+Xe collisions at √
s NN = 5.44 TeV with the ATLAS detector
The ATLAS Collaboration
The measurement of the correlation between flow harmonics v
nand average transverse momentum p
Tfor n = 2, 3 and 4 with the ATLAS detector at the LHC is presented, based on 3 µ b
−1Xe+Xe collisions at
√ s
NN= 5 . 44 TeV and 22 µ b
−1Pb+Pb collisions at
√ s
NN= 5 . 02 TeV. This correlation is characterized by the Pearson correlation coefficient, ρ( v
n2, [ p
T]) , which quantifies the strength of the correlation between v
n2and event-by-event average p
T, [p
T] . The results are obtained for several ranges in p
Tand pseudorapidity η and they are also compared between two different methods to characterize the event activity: the number of charged particles at mid-rapidity and transverse energy at the forward pseudorapidity. The strength of the correlation is found to depend on centrality, p
Tand η range, harmonic number n , and the collisions systems. Significant differences are observed between results using the two different event class definitions, indicating a strong influence of the centrality fluctuations on these observables. Current theoretical models describe some of the observed centrality dependent trends qualitatively but cannot describe the data quantitatively. This measurement provides insights on the initial-state geometry and final-state dynamics in heavy ion collisions.
© 2021 CERN for the benefit of the ATLAS Collaboration.
Reproduction of this article or parts of it is allowed as specified in the CC-BY-4.0 license.
1 Introduction
Heavy-ion collisions at RHIC and the LHC produce quark-gluon plasma (QGP) whose space-time evolution is well described by relativistic viscous hydrodynamics [1, 2]. Driven by the large pressure gradients, the QGP expands rapidly in the transverse plane, and converts the spatial anisotropy in the initial state into momentum anisotropy in the final state. The collective expansion in each event is quantified by Fourier expansions of particle distributions in azimuth given by
d Ndφ=
2πN( 1 + 2 Í
∞n=1
v
ncos n(φ − Φ
n)) , where v
nand Φ
nrepresent the amplitude and phase of the n
th-order azimuthal flow vector V
n= v
ne
inΦn. They are driven by the hydrodynamic response to the initial spatial anisotropy characterized by eccentricity vectors E
n= ε
ne
inΨn[3, 4]. Model calculations show that V
nare approximately proportional to E
nfor n = 2 and 3, as well as for n = 4 in central collisions [3, 5, 6]. The measurements of v
nand Φ
n[7–13] have placed important constraints on the properties of the medium and on the density fluctuations in the initial state [4–6, 14–16].
In addition to generating anisotropic flow, the hydrodynamic response to the fluctuations in the overall size of the overlap also leads to fluctuations in the "radial flow", reflected by an event-by-event fluctuation of [p
T] , the average transverse momentum of particles in each event. In particular, events with similar total energy but smaller transverse size in the initial state are expected to have a stronger radial expansion and therefore larger [p
T] [17, 18]. Furthermore, correlated fluctuations between the E
nand the size in the initial state is expected to generate dynamical correlations between v
nand [p
T] in the final state. A correlator has been proposed to study this correlation [19]:
ρ( v
n2, [ p
T]) = v
2nδp
Tr v
n4− v
n22p
hhδp
Tδp
Tii
(1)
where δp
T= p
T− [p
T] and the “ hhii ” denotes averaging over all particle pairs or triplets for events with comparable particle multiplicity, while the “ hi ” denotes averaging over events. The numerator quantifies the correlation between v
nand p
T, while the denominator normalizes out the variance of v
n2and p
Tfluctuations.
The form of Eq.(1) is known as Pearson coefficient. ATLAS published a measurement of ρ( v
2n, [p
T]) for n = 2, 3 and 4 in Pb+Pb collisions at
√ s
NN= 5 . 02 TeV [20]. The results show positive correlations for all harmonics, except in the peripheral region where the ρ(v
22
, [p
T]) is negative. These behaviors have been qualitatively reproduced by recent hydrodynamic model calculations [21, 22].
This note presents the system-size dependence of the v
n- [p
T] correlation by performing measurements in
129
Xe+
129Xe collisions and comparing them with those in
208Pb+
208Pb collisions. Recent measurements [23–
25] show significant differences in the v
nvalues between these two systems, especially in central collisions.
These differences are found to be compatible with the expected ordering of the eccentricities and roles
of viscous effects in the two systems [26, 27]. In particular, large differences for v
nin central Xe+Xe
collisions are found to receive contribution from a possible deformation of the
129Xe nuclei, which was
recently predicted to have a strong influence on the v
n- [p
T] correlations [28, 29]. It is of great interest
to compare the v
n- [p
T] correlation between the two systems and contrast with model predictions, which
should provide insight into the nature of the initial sources responsible for both the transverse harmonic
flow and radial flow. Such correlations are also studied as a function of p
Tand pseudorapidity η , which are
sensitive to the subleading modes in the fluctuations of the density profile in the radial and longitudinal
directions [21, 30–35]. These subleading fluctuations are predicted to result in strong decorrelation effects
in the v
n- [p
T] correlation in both the transverse and longitudinal directions [21, 36, 37]. In order to explore
the influence of non-flow correlations such as resonance decays and jets, a comparison has been made between the standard cumulant and subevent cumulant methods [38, 39].
This note also explores the issue of "centrality fluctuations". Experimental collision centrality defined based on the final-state particle multiplicity in an η range is subject to smearing due to fluctuations in the particle production process. Since the v
nand [p
T] values vary with centrality, the smearing in centrality can lead to additional fluctuations of these two quantities. Such centrality fluctuations, also known as volume fluctuations, have been shown to contribute significantly to event-by-event fluctuations of conserved quantities [40–42]. They have been shown to affect flow fluctuations and the covariance between different flow harmonics [43, 44], and possibly also the correlation between v
nand [p
T] [21, 45]. This analysis explores the influence of centrality fluctuations on v
n- [p
T] using two reference event classes: the total transverse energy in the forward pseudorapidity range 3 . 2 < |η| < 4 . 9 and the number of reconstructed charged particles in mid-rapidity range |η| < 2 . 5 and 0 . 5 < p
T< 5 GeV. This measurement extends the previous ATLAS measurement in Pb+Pb collisions [20], which studied the p
Tdependence using the event class based on the number of charged particles.
The note is organized as follows. Sections 2 and 3 describe details of the detector, event and track selections.
Section 4 introduces the observables and subevent methods used in this analysis. The correlation analysis and systematic uncertainties are described in Sections 5 and 6, respectively. Section 7 presents the results of v
n- [p
T] correlations in the two collision systems, discusses the role of centrality fluctuations, and compares the results with model predictions. A summary is given in Section 8.
2 ATLAS detector and trigger
The ATLAS detector [46] provides nearly full solid-angle coverage with tracking detectors, calorimeters, and muon chambers, and is well suited for measurements of multi-particle correlations over a large pseudorapidity range.
1The measurements are performed using the inner detector (ID), the forward calorimeters (FCal), and the zero-degree calorimeters (ZDC). The ID detects charged particles within
|η| < 2 . 5 using a combination of silicon pixel detectors, silicon microstrip detectors (SCT), and a straw-tube transition-radiation tracker, all immersed in a 2 T axial magnetic field [47]. The FCal consists of three sampling layers, longitudinal in shower depth, and covers 3 . 2 < |η| < 4 . 9. The ZDC are positioned at
± 140 m from the IP, detecting neutrons and photons with |η| > 8 . 3.
The ATLAS trigger system [48] consists of a level-1 (L1) trigger implemented using a combination of dedicated electronics and programmable logic, and a high-level trigger (HLT) which uses software algorithms similar to those applied in the offline event reconstruction. In the Pb+Pb run, the minimum-bias trigger required either more than 50 GeV of transverse energy recorded in the whole calorimeter system at L1 ( E
L1T
) or the presence of at least one neutron on both sides of the ZDC and a track identified by the HLT.
In the Xe+Xe run, the minimum-bias trigger is designed to select events with either E
L1T
> 4 GeV or a reconstructed track with p
T> 0 . 2 GeV at the HLT. The rate of events containing more than one inelastic interaction (pileup) is around 0 . 003 in Pb+Pb and around 0 . 0002 in Xe+Xe collisions.
1ATLAS uses a right-handed coordinate system with its origin at the nominal Interaction Point (IP) in the centre of the detector and thez-axis along the beam pipe. Thex-axis points from the IP to the centre of the LHC ring, and they-axis points upward. Cylindrical coordinates(r, φ)are used in the transverse plane,φbeing the azimuthal angle around the beam pipe. The pseudorapidity is defined in terms of the polar angleθasη=−ln tan(θ/2).
3 Event and track selection
The analysis is based on ATLAS datasets corresponding to integrated luminosities of 22 µ b
−1of Pb+Pb data recorded at
√ s
NN= 5 . 02 TeV in 2015, and 3 µ b
−1of Xe+Xe data recorded at
√ s
NN= 5 . 44 TeV in 2017. The offline event selection requires a reconstructed primary vertex with its z position satisfying
| z
vtx| < 100 mm. For the Pb+Pb dataset, pileup events are suppressed by exploiting the expected correlation between the estimated number of neutrons in the ZDC and N
recch
, the number of tracks associated with a primary vertex with 0 . 5 < p
T< 5 GeV and |η| < 2 . 5. For both Pb+Pb and Xe+Xe datasets, a requirement is also imposed on the correlation between the transverse energy ΣE
FCalT
and N
recch
to further reduce the background events. The events are classified into centrality intervals based on the ΣE
FCalT
in the FCal.
A Glauber model [49, 50] is used to parameterize the ΣE
FCalT
distribution and provide a correspondence between the ΣE
FCalT
distribution and sampling fraction of the total inelastic Pb+Pb or Xe+Xe cross section, allowing centrality percentiles to be set. A centrality interval refers to a percentile range, starting at 0% relative to the most central collisions at the largest ΣE
FCalT
value. This analysis is restricted to the 0–80% most central collisions where the triggers are fully efficient and the contribution from photo-nuclear processes is small [51].
Charged-particle tracks [52] are reconstructed from hits in the ID, which are then used to construct the primary vertices. Tracks are required to have p
T> 0 . 5 GeV and |η| < 2 . 5 in Pb+Pb collisions and p
T> 0 . 3 GeV and |η| < 2 . 5 in Xe+Xe collisions. They are required to satisfy the “loose” selection criteria, which requires at least one pixel hit, with the additional requirement of a hit in the first pixel layer when one is expected, and at least six SCT hits. In addition, the point of closest approach of the track in both the transverse and longitudinal directions, | d
0| and |z
0sin θ | , is required to be within 1.5 mm of the primary vertex [53]. For evaluation of systematic uncertainties, the “tight” selection criteria is also used, which further requires at least two pixel hits, eight SCT hits, no missing hits in the pixel or SCT, and smaller than 1 mm on the |d
0| and |z
0sin θ | . Note that the previous measurement [20] uses the “tight” selection as default track selection, but use the “loose” selection for systematic uncertainties.
The efficiency, (p
T, η) , of the track reconstruction and track selection criteria is evaluated using Pb+Pb and Xe+Xe Monte Carlo events produced with the HIJING event generator [54]. The generated particles in each event are rotated in azimuthal angle according to the procedure described in Ref. [55] to produce a harmonic flow consistent with the previous ATLAS measurements [9, 53]. This procedure does not impose event-by-event fluctuations nor correlations between different flow harmonics. The response of the detector is simulated using Geant4 [56, 57] and the resulting events are reconstructed with the same algorithms applied to the data. At mid-rapidity ( |η| < 1), the efficiency for central Pb+Pb collisions is about 67% at 0.5 GeV and increases to 71% at higher p
T, while the efficiency for central Xe+Xe collisions is about 61% at 0.3 GeV and increases to 73% at higher p
T[25]. For |η| > 1, the efficiency decreases to about 40–60% depending on the p
Tand centrality. The rate of falsely reconstructed tracks (“fakes”) is also estimated and found to be significant only at p
T< 1 GeV in central collisions, where it ranges from 2% for
|η| < 1 to 8% at larger |η| . The fake rate drops rapidly for higher p
Tand for more peripheral collisions.
The fake rate is accounted for in the tracking efficiency correction following the procedure in Ref. [58].
4 Observables and cumulant method
In the experimental analysis, the measurement of ρ( v
n2, [p
T]) in Eq. (1) requires a calculation of the individual components in the numerator and denominator. For this purpose, Eq. (1) is re-expressed as
ρ(v
2n, [p
T]) = cov (v
2n, [p
T]) p
var (v
n2) √ c
k, (2)
cov (v
2n, [p
T]) = v
n2δp
T, var (v
n2) = v
4n− v
n22, c
k= hhδp
Tδp
Tii . (3)
The covariance cov (v
2n, [p
T]) is a three-particle correlator, which is obtained by averaging over unique triplets in each event, and then over all events in an event class:
cov (v
n2, [p
T]) =
* Í
i,j,k,i,j,kw
iw
jw
ke
in(φi−φj)( p
T,k− h[p
T]i) Í
i,j,k,i,j,kw
iw
jw
k+
(4) where the indices i , j and k loop over distinct charged particles to account for all unique triplets, the particle weight w
jis constructed to correct for both detector non-uniformities and tracking inefficiency as explained in Section 5, and the hi denotes average over events. In order to reduce short-range “non-flow” correlations from resonance decays and jets, pseudorapidity gaps are often explicitly required between the particles in each triplet. This analysis uses the so-called standard, two-subevent and three-subevent methods to explore the influence of non-flow correlations as detailed below.
In the standard method, all charged particles within |η| < 2 . 5 are used. In the two-subevent method, triplets are constructed by combining particles from two subevents labeled as a and c with a ∆ η gap in between to reduce non-flow effects: − 2 . 5 < η
a< − 0 . 75 , 0 . 75 < η
c< 2 . 5. The two particles contributing to the flow vector are chosen as one particle each from a and c , while the third particle providing the p
Tweight is taken from either a or c . In the three-subevent method, three non-overlapping subevents a , b and c are chosen: − 2 . 5 < η
a< − 0 . 75 , |η
b| < 0 . 5 , 0 . 75 < η
c< 2 . 5. The particles contributing to flow are chosen from subevents a and c while the third particle is taken from subevent b .
A direct calculation of the nested-loop in Eq. (4) is computationally expensive. Instead, it can be expanded algebraically within the multi-particle cumulant framework [38, 39, 59–61] into a polynomial function of flow vectors and momentum scalar quantities:
q
n;k= Í
i
w
ike
inφiÍ
i
w
ki, p
m;k= Í
i
w
ki(p
T,i− h[p
T]i)
mÍ
i
w
ki, [p
T] = Í
i
w
ip
T,iÍ
i
w
i(5)
where the sum runs over particles in a given event or subevent and “k” and “m” are integer powers.
In the large collision systems considered in this analysis, the effect of non-flow is important only in peripheral collisions. The cov (v
2n, [p
T]) from the two- and three-subevent agree within a few percent for n = 2 and within 10–20% for n = 3 and 4. These differences are expected since the particle triplets for these methods are taken from different phase spaces in η and ∆η , and the corresponding η -dependent single particle v
nand ∆ η -dependent decorrelations of v
nand [p
T] can be different [19, 33, 62]. For the final results, the cov (v
22
, [ p
T]) , cov (v
23
, [p
T]) and cov (v
24
, [p
T]) are obtained by averaging the two- and three-subevent methods, which represent the average signal of the all triplets from the combined phase space of the two methods. Results from this averaging procedure are denoted as “combined-subevent”
method.
The statistical uncertainty of the measurement is obtained using a standard Poisson bootstrap method commonly employed in cumulant analysis [63, 64]. Fifty pseudo-datasets were generated by assigning to each event a random Poisson weight with a mean of one, and the quantities in Eq. (2) are calculated for each pseudo-dataset. This method is mathematically justified when the number of events in a given event class is large enough. The standard deviations of the 50 values for each quantity were used to set the statistical uncertainties in the final result.
To obtain the Pearson coefficient in Eq. (2), one also needs to calculate the variances c
kand var (v
2n) . The c
kvalues are obtained using all the pairs in the full event |η | < 2 . 5,
c
k=
Í
i,j,i,jw
iw
j(p
T,i− h[p
T]i)(p
T,j− h[p
T]i) Í
i,j,i,jw
iw
j(6)
The variances var ( v
2n) are calculated in terms of two-particle cumulant c
n{ 2 } and four-particle cumulant c
n{ 4 } [65],
var (v
n2) = c
n{ 4 }
standard+ c
n{ 2 }
2two−sub
. (7)
The c
n{ 4 } , being four-particle correlators, are known to be relatively insensitive to non-flow correlations but usually has poor statistical precision [59]. Therefore it is obtained from the standard cumulant method using the full event. On the other hand, the two-particle cumulants c
n{ 2 } are more susceptible to non-flow correlations but usually have much better statistical precision. Therefore, the c
n{ 2 } are calculated from the two-subevent method with the η choices discussed above. The calculation of c
n{ 2 } and c
n{ 4 } follow the standard procedure used in previous analyses [38, 59], i.e. they are expressed in terms of flow vectors q
n;kdefined in Eq. (5).
The default η ranges for the standard and subevent methods discussed above are listed in Table 1. In addition to these default values, the analysis is also repeated for η ranges that are closer to mid-rapidity, matching the detector acceptance of the ALICE experiment at the LHC or the STAR experiment at RHIC.
This choice, listed in Table 1, could be useful for comparison of the results with other experiments and with model predictions.
In the analysis, the charged particles are also restricted to some predefined p
Tranges similar to previous measurement [20]. For the analysis of Pb+Pb data, two ranges, 0 . 5 < p
T< 5 GeV and 0 . 5 < p
T< 2 GeV, are used. For the analysis of Xe+Xe data, one additional range with a lower threshold, 0 . 3 < p
T< 2 GeV is used. These p
Tranges are listed in Table 1. However, the main results are based on the range 0 . 5 < p
T< 5 GeV.
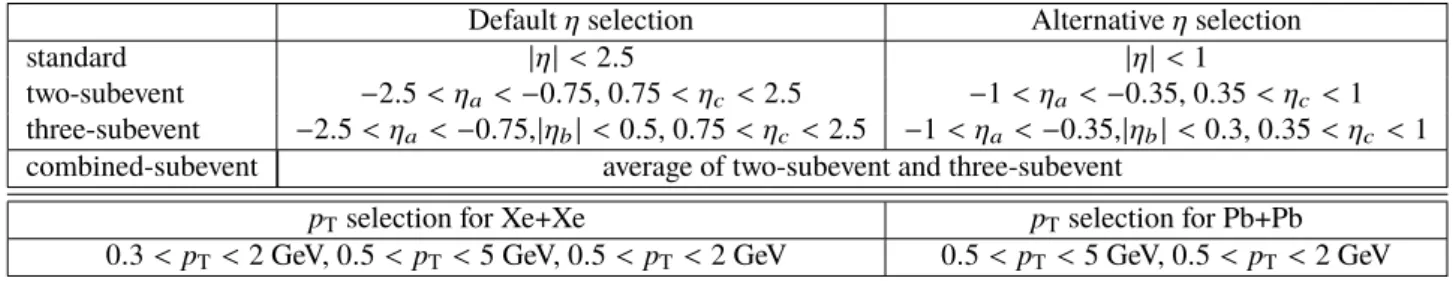
Table 1: The choices of theηandpTranges for the standard and subevent methods.
Defaultηselection Alternativeηselection
standard |η|<2.5 |η|<1
two-subevent −2.5< ηa <−0.75, 0.75< ηc<2.5 −1< ηa <−0.35, 0.35< ηc<1 three-subevent −2.5< ηa <−0.75,|ηb|<0.5, 0.75< ηc<2.5 −1< ηa<−0.35,|ηb|<0.3, 0.35< ηc<1 combined-subevent average of two-subevent and three-subevent
pTselection for Xe+Xe pTselection for Pb+Pb
0.3<pT<2 GeV, 0.5<pT<5 GeV, 0.5<pT<2 GeV 0.5<pT<5 GeV, 0.5<pT<2 GeV
5 Analysis procedure
The measurement of the cov ( v
n2, [p
T]) , var ( v
n2) and c
kfollows a similar procedure as detailed in Ref. [20, 66]. In the first step, these correlators are calculated in each event as the average over all combinations among particles from a η and p
Trange listed in Table 1.
In the second step, the values obtained in each event are averaged over events with comparable multiplicity, defined as events with either similar ΣE
FCalT
value ( |∆ΣE
FCalT
| < 0.002 TeV) or the same N
recch
. They are then combined in broader multiplicity ranges of the event ensemble to obtain statistically more precise results. The Pearson coefficient ρ(v
2n, [p
T]) are then obtained via Eq. (2). The event averaging procedure is necessary to reduce the effects of centrality fluctuation within each event class definition [21, 43, 45].
However, effects of centrality fluctuations between different event classes can be revealed by comparing the results obtained from ΣE
FCalT
and N
recch
. To reduce the contribution from photo-nuclear events, which may have different physics for the v
n- [ p
T] correlation, this analysis is restricted to 0-80% centrality range which corresponds to ΣE
FCalT
> 0 . 06 TeV in Pb+Pb collisions and ΣE
FCalT
> 0 . 05 TeV in Xe+Xe collisions. The average N
recch
for these thresholds are N
0= 37 and N
0= 27 in Pb+Pb and Xe+Xe collisions, respectively.
The requirements of N
recch
> N
0are imposed for the N
recch
dependence study.
In the third step, the N
recch
dependence of each observable is converted into a dependence on the centrality percentile. This is accomplished by calculating the average ΣE
FCalT
for each a given N
recch
, which is then mapped to the centrality percentile. The mapping procedure is necessary such that results obtained for ΣE
FCalT
and N
recch
can be compared using a common x -axis.
In order to account for detector inefficiencies and non-uniformity, particle weights defined in Eq. (5) are calculated in practice as:
w (φ, η, p
T) = d(φ, η)/(η, p
T) . (8)
The additional weight factor d(φ, η) accounts for non-uniformities in the azimuthal acceptance of the detector as a function of η , which is on the order of 5–20% variation. All reconstructed charged particles for a given p
Tselection are filled into a two-dimensional histogram N(φ, η) , and the weight factor is then obtained as d(φ, η) ≡ hN(η)i /N(φ, η) , where hN(η)i is the track density averaged over φ in the given η bin. This procedure removes most φ -dependent non-uniformity from track reconstruction [67], and the resulting flow vectors in Eq.(5) should be uniformly distributed in azimuthal angle. Any residual offsets are further subtracted by an event-averaged offset q
n;k−
q
n;kevts
[12], which was implemented as an improvement over the previous measurement [20].
6 Systematic Uncertainties
The systematic uncertainties in this analysis arise from track selection, reconstruction efficiency, acceptance reweighting and centrality selection, which are calculated for each observable: cov (v
n2, [p
T]) , var (v
2n) , c
kand ρ( v
2n, [p
T]) . Many of the systematic uncertainties enter the analysis through the particle weights in Eq. (5).
Since signals in the peripheral collisions are often small and dominated by large statistical uncertainties, the
uncertainty numbers are mainly quoted for the 0–50% centrality range. The contributions from different
sources of uncertainties are discussed as follows with a focus on the key observables cov ( v
n2, [ p
T]) and
ρ(v
2n, [p
T]) .
From previous measurements [9], the v
nsignal has been shown to have a strong dependence on p
Tbut relatively weak dependence on η . Therefore, a p
T-dependent uncertainty in the track reconstruction efficiency (η, p
T) could affect the measured signal, through the particle weights. The uncertainty in the track reconstruction efficiency is due to differences in the detector conditions and known differences in the material between data and simulations. The uncertainty in the efficiency varies up to 4%, depending on η and p
T[25]. The resulting systematic uncertainty for each observable is evaluated by repeating the analysis with the tracking efficiency varied up and down by its corresponding uncertainty. The corresponding uncertainties are less than 2% for n = 2 and 4, but increases to 6% for n = 3 due to the fact that the cov (v
23
, [p
T]) values decrease towards zero in the peripheral region. In Xe+Xe collisions, the uncertainties are slightly smaller in the central collisions, but are larger in peripheral collisions for n = 3 and n = 4 due to limited event statistics.
The contamination from fake tracks varies with the tracking selection. The change of the results with respect to the default track selection is obtained by varying the requirements imposed on the reconstructed tracks. The loose and tight track selection discussed in Section 3 are used for this purpose. The difference is observed to be larger in the most central and peripheral collisions where the correlation signals are smaller and the influence of fake tracks is higher. In Pb+Pb collisions, the differences are up to 3% for n = 2, up to 6% for n = 3 and up to 9% for n = 4. This uncertainty is smaller in Xe+Xe collisions due to smaller rates of fake tracks, except in peripheral collisions for n = 3 and 4.
Table 2: Systematic uncertainties in percent for cov(v2n,[pT])andρ(v2n,[pT])for Pb+Pb collisions.
Centrality Sources cov
2ρ
2cov
3ρ
3cov
4ρ
4Efficiency 2 0.9 1.3 2.2 2 1.5
Trk quality 3 0.5 < 0 . 5 0.6 8 9
0-10% φ non-uniformity < 0 . 5 0.5 0.5 < 0 . 5 0.9 0.9 Centrality 1.4 < 0 . 5 < 0 . 5 < 0 . 5 1.7 1.5
Total 4 2 2 3 9 10
Efficiency 1.2 1.2 1.6 3 1.6 0.9
Trk quality 0.8 1.6 3.5 3.6 0.5 1.5
20-30% φ non-uniformity < 0 . 5 < 0 . 5 < 0 . 5 < 0 . 5 0.5 0.6
Centrality 1.5 < 0 . 5 1.8 3 3.0 1.5
Total 2 2 4 6 4 3
Efficiency < 0 . 5 1.3 5 6 1.3 0.8
Trk quality 1.5 1.9 7 7.5 1.7 1.1
40-50% φ non-uniformity < 0 . 5 < 0 . 5 < 0 . 5 < 0 . 5 < 0 . 5 < 0 . 5
Centrality < 0 . 5 1.4 2.0 1.5 1.3 0.8
Total 2 3 9 10 3 2
The effect of detector azimuthal non-uniformity is accounted for by the weight factor d(η, φ) in Eq. (8). The effect of reweighting is studied by setting the weight to unity and repeating the analyses but still applying the residual offset correction on the flow vectors. The unweighted results generally agree with the weighted results within 1–3%, except for peripheral Xe+Xe collisions where the uncertainties are larger.
The minimum-bias trigger is fully efficient for the 0–80% centrality interval considered in this analysis
for both systems. However, the centrality definitions used to classify the events into centrality percentiles
have a 1% uncertainty due to trigger inefficiency on selecting the fraction of inelastic Pb+Pb or Xe+Xe
Table 3: Systematic uncertainties in percent for cov(v2n,[pT])andρ(v2n,[pT])for Xe+Xe collisions.
Centrality Sources cov
2ρ
2cov
3ρ
3cov
4ρ
4Efficiency 1.4 0.5 0.7 1.4 1.8 1.2
Trk quality 1.2 0.6 2.5 4.9 1.7 0.7
0-10% φ non-uniformity 0.5 1 0.7 < 0 . 5 4.2 2.3 Centrality 0.9 < 0 . 5 < 0 . 5 < 0 . 5 0.7 0.5
Total 2 2 3 6 5 3
Efficiency 0.7 1.0 1 3.2 0.9 0.8
Trk quality < 0 . 5 < 0 . 5 1.9 2.3 1.5 2.5 20-30% φ non-uniformity < 0 . 5 < 0 . 5 1.6 1.5 1.5 < 0 . 5
Centrality 1.1 < 0 . 5 1 1.5 1.7 0.6
Total 2 2 3 4 3 3
Efficiency 0.7 < 0 . 5 14 15 18 15
Trk quality 1.4 1.2 15 15 0.6 0.6
40-50% φ non-uniformity < 0 . 5 < 0 . 5 2 1.5 8 7
Centrality 0.8 1.8 8 6 1 < 0 . 5
Total 2 3 23 22 20 18
cross-section. The impact of this uncertainty is evaluated by varying the centrality interval definitions by ± 1%, and recalculating all the observables. The impact for all observables is small in central and mid-central collisions, but becomes the dominating uncertainty in the more peripheral region. This uncertainty is also used when results are presented as a function of centrality percentiles. The uncertainties are 0–3% in central and mid-central collisions and increase to 2–8% in the more peripheral collisions depending on the harmonic number n and collision system.
The systematic uncertainties from the different sources described above are added in quadrature to give the total systematic uncertainty for each observable. The relative uncertainties are larger in central and peripheral collisions, where the values of ρ(v
2n, [p
T]) are very small compare to statistical uncertainties.
These uncertainties are summarized in Tables 2 and 3 for the default choice of 0 . 5 < p
T< 5 GeV, |η| < 2 . 5 and method based on the average of the two- and three-subevent as described in Section 4.
7 Results
The results for c
k, var (v
2n) , cov (v
n2, [p
T]) and ρ(v
2n, [p
T]) for n = 2, 3 and 4 can be calculated for each choice of p
Tand η ranges in Pb+Pb and Xe+Xe collisions as shown in Table 1. In each case, they can be obtained with the event averaging procedure based on either N
recch
or ΣE
FCalT
. However, given the large amount of information, this note focuses on a selected set of results that summarize the main findings of this analysis.
Section 7.1 shows the N
recch
dependence of c
kand var (v
n2) , and comparisons between standard and subevent methods for cov (v
n2, [p
T]) and ρ(v
n2, [p
T]) . Section 7.2 discusses the dependence of ρ(v
2n, [p
T]) on the selected p
Tand η ranges. The main results shown are calculated for charged particles with transverse momentum in the range 0 . 5 < p
T< 5 GeV via the event averaging procedure based on N
recch
. Section 7.3 studies the influence of centrality fluctuations by comparing the result obtained using the N
recch
-based event
0 1000 2000 3000 rec
Nch
−0.05 0 0.05
0.1 3 10−
× ]) [GeV]T,[p2 2cov (v
Preliminary ATLAS
b-1 µ = 5.02 TeV, 22 sNN Pb+Pb
| < 2.5 η < 5.0 GeV, | 0.5 < pT Standard
Two-subevent Three-subevent
0 1000 2000 3000
rec
Nch
−2 0 2 4 6
−6
×10
]) [GeV]T,[p2 3cov (v
Preliminary ATLAS
b-1 µ = 5.02 TeV, 22 sNN Pb+Pb
| < 2.5 η < 5.0 GeV, | 0.5 < pT Standard
Two-subevent Three-subevent
0 1000 2000 3000
rec
Nch 0
2 4
6 6
10−
× ]) [GeV]T,[p2 4cov (v
Preliminary ATLAS
b-1 µ = 5.02 TeV, 22 sNN Pb+Pb
| < 2.5 η < 5.0 GeV, | 0.5 < pT
Standard Two-subevent Three-subevent
0 500 1000 1500
rec
Nch
−0.05 0 0.05
0.1 3 10−
× ]) [GeV]T,[p2 2cov (v
Preliminary ATLAS
b-1 µ = 5.44 TeV, 3 sNN Xe+Xe
| < 2.5 η < 5.0 GeV, | 0.5 < pT Standard
Two-subevent Three-subevent
0 500 1000 1500
rec
Nch
−2 0 2 4 6
−6
×10
]) [GeV]T,[p2 3cov (v
Preliminary ATLAS
b-1 µ = 5.44 TeV, 3 sNN Xe+Xe
| < 2.5 η < 5.0 GeV, | 0.5 < pT Standard
Two-subevent Three-subevent
0 500 1000 1500
rec
Nch 0
2 4
6 6
10−
× ]) [GeV]T,[p2 4cov (v
Preliminary ATLAS
b-1 µ = 5.44 TeV, 3 sNN Xe+Xe
| < 2.5 η < 5.0 GeV, | 0.5 < pT
Standard Two-subevent Three-subevent
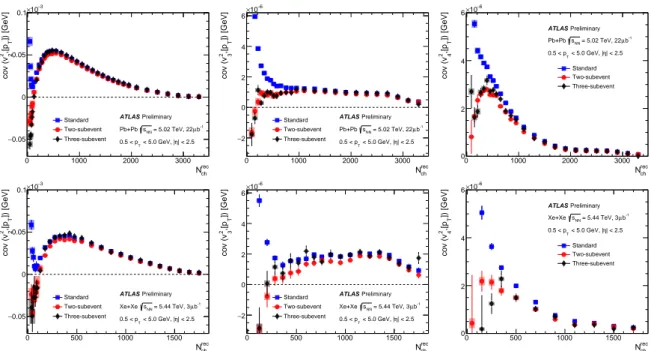
Figure 1: TheNrec
ch dependence of cov(vn2,[pT])forn=2 (left), 3 (middle) and 4 (right) in Pb+Pb (top) and Xe+Xe (bottom) collisions calculated for the standard, two-subevent and three-subevent methods. They are calculated using charged particles in 0.5<pT<5 GeV and event averaging procedure based onNrec
ch . The error bars and shaded boxes represent statistical and systematic uncertainties, respectively.
class with those obtained using the ΣE
FCalT
-based event class. The comparison with theoretical models is discussed in Section 7.4.
7.1 The ρ(v
2n, [ p
T]) and its constituents
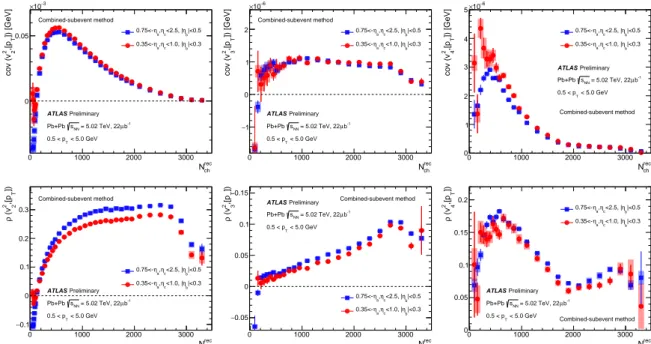
Figure 1 shows the cov (v
2n, [p
T]) obtained from the standard, two-subevent, and three-subevent methods for charged particles in 0 . 5 < p
T< 5 GeV in Pb+Pb and Xe+Xe collisions. They are obtained with the event averaging procedure based on N
recch
and plotted as a function of N
recch
. The results are close to each other in central and mid-central collisions. However in peripheral collisions (50-80% centrality range), the values from the standard method are significantly larger than those obtained for the subevent methods. This is consistent with the significant non-flow correlations associated with resonance decays and jets which have positive contributions to both v
nand [p
T] in the standard method. Smaller differences, albeit weakly dependent on N
recch
, are also observed between two-subevent and three-subevent methods. These differences are expected because the v
nsignal, as well as the decorrelations of v
nand [p
T] , depend on the phase spaces in η and ∆ η , which are different for the triplets from the two subevent methods [19, 33, 62]. The Pb+Pb and Xe+Xe data from the subevent methods also show similar N
recch
dependences: the cov (v
22
, [p
T]) values are negative at low N
recch
, increase to a positive maximum value and then decrease towards more central collisions; the cov (v
23
, [p
T]) values show a mild dependence on N
recch
; the cov (v
24
, [p
T]) values are always positive. As discussed in Section 4, the triplets from the two-subevent and three-subevent methods are combined to give default result for cov ( v
n2, [p
T]) , and a Poisson bootstrap method is used to calculate the statistical uncertainties for this combination.
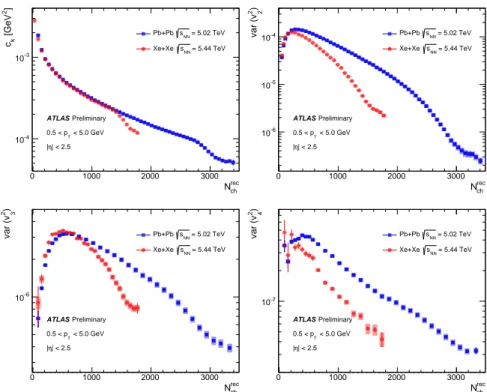
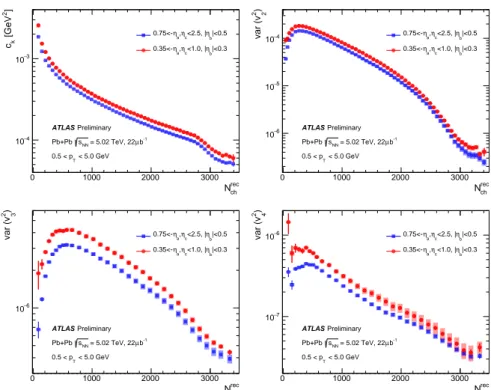
Figure 2 compares the values of c
kcalculated via Eq. (6) and var (v
n2) calculated via Eq. (7) for n = 2, 3, and
4 between Pb+Pb and Xe+Xe collisions. The variance of the [p
T] fluctuations, shown by c
k, largely follows
0 1000 2000 3000 rec
Nch
−4
10
−3
10 ]2 [GeVkc
Preliminary ATLAS
< 5.0 GeV 0.5 < pT
| < 2.5 η
|
= 5.02 TeV sNN Pb+Pb
= 5.44 TeV sNN Xe+Xe
0 1000 2000 3000
rec
Nch
−6
10
−5
10
−4
10 )2 2var (v
Preliminary ATLAS
< 5.0 GeV 0.5 < pT
| < 2.5 η
|
= 5.02 TeV sNN Pb+Pb
= 5.44 TeV sNN Xe+Xe
0 1000 2000 3000
rec
Nch
−6
10 )2 3var (v
Preliminary ATLAS
< 5.0 GeV T 0.5 < p
| < 2.5 η
|
= 5.02 TeV sNN Pb+Pb
= 5.44 TeV sNN Xe+Xe
0 1000 2000 3000
rec
Nch
−7
10 )2 4var (v
Preliminary ATLAS
< 5.0 GeV T 0.5 < p
| < 2.5 η
|
= 5.02 TeV sNN Pb+Pb
= 5.44 TeV sNN Xe+Xe
Figure 2: TheNrec
ch dependence ofck (top-left) and var(vn2)forn=2 (top-right), 3 (bottom-left) and 4 (bottom-right) in Pb+Pb and Xe+Xe collisions. They are calculated using charged particles in 0.5< pT < 5 GeV and event averaging procedure based onNrec
ch. The error bars and shaded boxes represent statistical and systematic uncertainties, respectively.
a common power-law dependence as a function N
recch
for different collision systems. A clear departure from this power-law behavior is observed in the ultra-central collisions, similar to earlier findings [68–70].
This reduction in [p
T] fluctuations is related to the upper boundary on the number of nucleon participants, which constrains the multiplicity fluctuations [43]. The var ( v
2n) in the two collision systems follow similar multiplicity dependence trends.
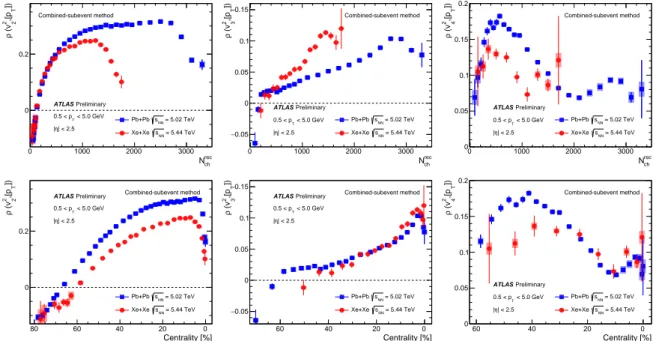
The top panels of Figure 3 compare the multiplicity dependence of ρ( v
n2, [ p
T]) for n = 2, 3, and 4 between the Pb+Pb and Xe+Xe. Using the correlation between N
recch
and ΣE
FCalT
, the N
recch
values are mapped to ΣE
FCalT
, which are then mapped to the centrality percentile. The resulting centrality dependences are shown in the bottom panels of Figure 3. These two different choices for the x-axis test whether the system-size dependence of ρ(v
2n, [p
T]) scales with centrality or event multiplicity. The top panels of Figure 3 show that the ρ( v
22
, [ p
T]) values agree in the low N
recch
region ( N
recch
< 500), but when plotted as a function of centrality, the values are always smaller for Xe+Xe collisions as shown in the bottom panels of Figure 3.
When plotted as a function of N
recch
, the ρ(v
23
, [ p
T]) values in Pb+Pb and Xe+Xe collisions are most similar in peripheral collisions, while when plotted as a function of centrality percentile the values are most similar in central collisions. The ρ(v
24
, [p
T]) values are close to each other in the central collisions when plotted as a function of centrality percentile.
For completeness, Figure 4 shows the N
recch
dependence of ρ( v
2n, [p
T]) obtained from cov ( v
2n, [p
T]) in Figure 1 and c
kand var (v
n2) from Figure 2 via Eq. (2) for the standard, two-subevent and three-subevent methods.
The relative differences between the three methods are exactly the same as cov (v
n2, [p
T]) in Figure 4, but
these differences more clearly shown in the central region.
0 1000 2000 3000 rec
Nch 0
0.2 ])T,[p2 2 (vρ
Preliminary ATLAS
< 5.0 GeV 0.5 < pT
| < 2.5 η
|
Combined-subevent method
= 5.02 TeV sNN Pb+Pb
= 5.44 TeV sNN Xe+Xe
0 1000 2000 3000
rec
Nch
−0.05 0 0.05 0.1 2]),[p (vρ0.15T3
Preliminary ATLAS
< 5.0 GeV 0.5 < pT
| < 2.5 η
|
Combined-subevent method
= 5.02 TeV sNN Pb+Pb
= 5.44 TeV sNN Xe+Xe
0 1000 2000 3000
rec
Nch 0
0.05 0.1 0.15 2]),[p (vρT40.2
Preliminary ATLAS
< 5.0 GeV 0.5 < pT
| < 2.5 η
|
Combined-subevent method
= 5.02 TeV sNN Pb+Pb
= 5.44 TeV sNN Xe+Xe
Centrality [%]
0 0.2 ])T,[p2 2 (vρ
0 20 40 60 80
Preliminary ATLAS
< 5.0 GeV 0.5 < pT
| < 2.5 η
|
Combined-subevent method
= 5.02 TeV sNN Pb+Pb
= 5.44 TeV sNN Xe+Xe
Centrality [%]
−0.05 0 0.05 0.1 2]),[p (vρ0.15T3
0 20 40 60
Preliminary ATLAS
< 5.0 GeV 0.5 < pT
| < 2.5 η
|
Combined-subevent method
= 5.02 TeV sNN Pb+Pb
= 5.44 TeV sNN Xe+Xe
Centrality [%]
0 0.05 0.1 0.15 2]),[p (vρT40.2
0 20
40 60
Preliminary ATLAS
< 5.0 GeV 0.5 < pT
| < 2.5 η
|
Combined-subevent method
= 5.02 TeV sNN Pb+Pb
= 5.44 TeV sNN Xe+Xe
Figure 3: TheNrec
ch (top) and centrality (bottom) dependence ofρ(v2n,[pT])forn=2 (left), 3 (middle) and 4 (right) in Pb+Pb and Xe+Xe collisions. They are calculated using charged particles in 0.5<pT<5 GeV and event averaging procedure based onNrec
ch . The bottom panels are obtained by mapping theρ(v2n,[pT])values in the top panels to the corresponding centrality percentiles based on the correlation betweenNrec
ch andΣEFCal
T . The error bars and shaded boxes represent statistical and systematic uncertainties, respectively.
0 1000 2000 3000
rec
Nch
−0.2 0 0.2 ])T,[p2 2 (vρ
Preliminary ATLAS
b-1 µ = 5.02 TeV, 22 sNN Pb+Pb
| < 2.5 η < 5.0 GeV, | 0.5 < pT Standard
Two-subevent Three-subevent
0 1000 2000 3000
rec
Nch
−0.05 0 0.05 0.1 0.15 ])T,[p2 3 (vρ
Preliminary ATLAS
b-1 µ = 5.02 TeV, 22 sNN Pb+Pb
| < 2.5 η < 5.0 GeV, | 0.5 < pT Standard
Two-subevent Three-subevent
0 1000 2000 3000
rec
Nch 0
0.1 0.2 0.3 ])T,[p2 4 (vρ
Preliminary ATLAS
b-1 µ = 5.02 TeV, 22 sNN Pb+Pb
| < 2.5 η < 5.0 GeV, | 0.5 < pT
Standard Two-subevent Three-subevent
0 500 1000 1500
rec
Nch
−0.2 0 0.2 ])T,[p2 2 (vρ
Preliminary ATLAS
b-1 µ = 5.44 TeV, 3 sNN Xe+Xe
| < 2.5 η < 5.0 GeV, | 0.5 < pT Standard
Two-subevent Three-subevent
0 500 1000 1500
rec
Nch
−0.05 0 0.05 0.1 0.15 ])T,[p2 3 (vρ
Preliminary ATLAS
b-1 µ = 5.44 TeV, 3 sNN Xe+Xe
| < 2.5 η < 5.0 GeV, | 0.5 < pT Standard
Two-subevent Three-subevent
0 500 1000 1500
rec
Nch 0
0.1 0.2 0.3 ])T,[p2 4 (vρ
Preliminary ATLAS
b-1 µ = 5.44 TeV, 3 sNN Xe+Xe
| < 2.5 η < 5.0 GeV, | 0.5 < pT
Standard Two-subevent Three-subevent
Figure 4: TheNrec
ch dependence ofρ(v2n,[pT])forn=2 (left), 3 (middle) and 4 (right) in Pb+Pb (top) and Xe+Xe (bottom) collisions calculated for the standard, two-subevent and three-subevent methods. They are calculated using charged particles in 0.5<pT<5 GeV and event averaging procedure based onNrec
ch . The error bars and shaded boxes represent statistical and systematic uncertainties, respectively.
![Table 2: Systematic uncertainties in percent for cov (v 2 n , [p T ]) and ρ(v 2 n , [p T ]) for Pb+Pb collisions.](https://thumb-eu.123doks.com/thumbv2/1library_info/3992514.1539806/8.892.185.733.583.914/table-systematic-uncertainties-percent-cov-pb-pb-collisions.webp)
![Table 3: Systematic uncertainties in percent for cov (v 2 n , [p T ]) and ρ(v 2 n , [p T ]) for Xe+Xe collisions.](https://thumb-eu.123doks.com/thumbv2/1library_info/3992514.1539806/9.892.187.729.189.517/table-systematic-uncertainties-percent-cov-xe-xe-collisions.webp)
![Figure 5 shows the multiplicity dependence of ρ(v n 2 , [p T ]) in two p T ranges for Pb+Pb collisions and three p T ranges for Xe+Xe collisions](https://thumb-eu.123doks.com/thumbv2/1library_info/3992514.1539806/13.892.129.786.353.696/figure-shows-multiplicity-dependence-ranges-collisions-ranges-collisions.webp)
![Figure 9 compares the ρ(v 2 n , [p T ]) for n = 2 and 3 with a prediction based on the Trento model from Refs [22, 26, 72]](https://thumb-eu.123doks.com/thumbv2/1library_info/3992514.1539806/16.892.132.786.579.873/figure-compares-ρ-prediction-based-trento-model-refs.webp)
