ATLAS-CONF-2015-055 28September2015
ATLAS NOTE
ATLAS-CONF-2015-055
September 28, 2015
Internal structure of jets measured in Pb + Pb and pp collisions with the ATLAS detector at the LHC
The ATLAS Collaboration
Abstract
The study of jet internal structure is central for understanding the jet energy loss of fast partons propagating through the hot, dense medium created in heavy ion collisions. The study is performed with the ATLAS detector at the LHC. The distributions of charged trans- verse momentum and longitudinal momentum fraction are measured in jets reconstructed using the anti-k
talgorithm with R
=0.4. These distributions are measured in both Pb
+Pb and pp collisions as a function of jet transverse momentum and jet pseudorapidity. The anal- ysis utilizes an integrated luminosity of 0.14 nb
−1of Pb
+Pb data and 4.0 pb
−1of pp data collected in 2011 and 2013, respectively, both at the same center-of-mass energy of 2.76 TeV per colliding nucleon pair. The distributions measured in pp collisions are used as a reference for those measured in Pb
+Pb collisions to evaluate the impact of the jet energy loss on the jet internal structure.
c
Copyright 2015 CERN for the benefit of the ATLAS Collaboration.
Reproduction of this article or parts of it is allowed as specified in the CC-BY-3.0 license.
1 Introduction
Heavy-ion collisions at ultra-relativistic energies produce a medium of strongly interacting nuclear matter composed of deconfined color charges that is commonly called a quark-gluon plasma (QGP) [1, 2, 3, 4].
Hard scattering processes occurring in these collisions produce high transverse momentum, p
T, partons that propagate through the medium and lose energy, resulting in the phenomenon of “jet quenching.” Jet quenching refers, collectively, to a set of modifications of parton showers by the plasma through inter- actions of the constituents of the shower with the color charges in the plasma [5]. In particular, quarks and gluons in the shower may be elastically or inelastically scattered resulting in both deflection and energy loss of the constituents of the shower. A complete characterization of the e
ffects of jet quenching therefore requires measurements of both the single jet suppression and of jet fragmentation distributions.
The single jet suppression has previously been measured at the LHC in terms of the nuclear modification factor [6, 7]. A suppression of jet production by about a factor of two in central heavy ion collisions was observed with only a small dependence on the pseudorapidity, η, of the measured jets. The modified jet fragmentation was also measured [8, 9]. These measurements revealed modification of the distributions of the jet fragments. The measurements of the modified jet fragmentation were supplemented by a mea- surement of the correlation of the jet suppression with missing transverse momentum [10], leading to a conclusion that the energy lost by partons is transferred predominantly to soft particles being radiated at large angles with respect to the direction of the original parton.
This note presents a new measurement of the jet internal structure by ATLAS in Pb+Pb and pp colli- sions, both at the same center-of-mass energy per colliding nucleon pair of 2.76 TeV. The measurement utilizes Pb
+Pb data collected during 2011 corresponding to an integrated luminosity of 0.14 nb
−1as well as data from pp collisions recorded during 2013 corresponding to 4.0 pb
−1. The quantities that were introduced in Ref. [8] are used here, namely the jet fragmentation functions, D(z), and distributions of charged particle transverse momenta measured inside the jet, D( p
T). The D(z) distributions are defined as
D(z)
≡1 N
jetdN
chdz , (1)
where N
jetis the total number of jets, N
chis number of charged particles associated with a jet, and the longitudinal momentum fraction z is defined as
z
≡p
Tp
jetTcos
∆R
=p
Tp
jetTcos
q∆
η
2+ ∆φ
2. (2)
Here p
Tstands for the transverse momentum of a charged particle,
∆η and
∆φ are the distance between the jet axis and the charged particle position in pseudorapidity and azimuth
1, respectively
2. The D( p
T) distributions are defined as
D( p
T)
≡1 N
jetdN
ch( p
T)
d p
T. (3)
The fragmentation distributions are measured for jets reconstructed with the anti-k
talgorithm [11] with the radius parameter R
=0.4. The charged particles are associated to a jet by requiring the distance between the jet axis and the charged particle to be
∆R < 0.4.
In the first measurement of the jet fragmentation by ATLAS [8], the jet fragmentation was measured for jets with the radius parameters R
=0.2, 0.3, and 0.4. Jet fragments having minimum p
Tof 2 GeV
1ATLAS uses a right-handed coordinate system with its origin at the nominal interaction point (IP) in the centre of the detector and thez-axis along the beam pipe. Thex-axis points from the IP to the centre of the LHC ring, and theyaxis points upward. Cylindrical coordinates (r, φ) are used in the transverse plane,φbeing the azimuthal angle around the beam pipe. The pseudorapidity is defined in terms of the polar angleθasη=−ln tan(θ/2).
2The∆Rused here is a boost invariant replacement for the polar angleθ.
were measured within an angular range
∆R
=0.4 from the jet axis. The D(z) and D(p
T) distributions were presented for seven bins in collision centrality. The minimum jet p
Trequirements for the three sizes of jet are p
T> 85, 92, and 100 GeV, for R
=0.2, R
=0.3, and R
=0.4 jets, respectively. Ratios of fragmentation functions in the different centrality bins to the 60–80% bin were presented and used to evaluate the medium caused modifications of the jet fragmentation. Those ratios exhibited an enhance- ment in fragment yield in central collisions for z
.0.04, a reduction in fragment yield for 0.04
.z
.0.2 and an enhancement in the fragment yield for z > 0.4. The modifications were found to decrease mono- tonically with decreasing collision centrality from 0–10% to 50–60%. A similar set of modifications was observed in the D( p
T) distributions over corresponding p
Tranges.
This new analysis of the jet internal structure uses the same observables but extends the minimum p
Tfor charged particles to 1 GeV and evaluates the fragmentation observables di
fferentially in the jet p
Tand
η. Furthermore, the new analysis uses the fragment distributions measured in pp collisions as a reference
for the measurement of jet fragmentation in heavy ion collisions. This more detailed information on the jet structure should allow a better characterization of the flow of the energy lost by the initial parton and will help to understand the features seen in the suppression of inclusive jet yields such as the unexpected absence of the evolution of nuclear modification factors with pseudorapidity.
The content of this note is organized as follows: Section 2 describes the experimental setup. Section 3 describes the event selection and data sets. Section 4 describes the jet and track reconstruction and selection. Section 5 discusses the analysis procedure. Section 6 discusses the evaluation of systematic uncertainties. Section 7 describes the results of the measurement and Section 8 provides a summary and conclusions of the analysis.
2 Experimental setup
The measurements presented in this note were performed using the ATLAS calorimeter, inner detec- tor, trigger, and data acquisition systems [12]. The ATLAS calorimeter system consists of a liquid argon (LAr) electromagnetic (EM) calorimeter covering
|η|< 3.2, a steel-scintillator sampling hadronic calorimeter covering
|η|< 1.7, a LAr hadronic calorimeter covering 1.5 <
|η|< 3.2, and two LAr forward calorimeters (FCal) covering 3.2 <
|η|< 4.9. The hadronic calorimeter has three longitudinal sampling layers and has a
∆η
×∆φ granularity of 0.1
×0.1 for
|η|< 2.5 and 0.2
×0.2 for 2.5 <
|η|< 4.9
3. The EM calorimeters are longitudinally segmented into three compartments with an additional pre-sampler layer.
The EM calorimeter has a granularity that varies with layer and pseudorapidity, but which is generally much finer than that of the hadronic calorimeter. The middle sampling layer, which typically has the largest energy deposit in EM showers, has a granularity of 0.025
×0.025 over
|η|< 2.5.
The inner detector [13] measures charged particles within the pseudorapidity interval
|η|< 2.5 using a combination of silicon pixel detectors, silicon microstrip detectors, and a straw tube transition radiation tracker, all immersed in a 2 T axial magnetic field. All three detectors are composed of a barrel and two symmetrically placed end-cap sections. The pixel detector is composed of three layers of sensors with nominal feature size 50 µm
×400 µm. The silicon strip barrel section contains four layers of modules with 80 µm pitch sensors on both sides, while the end-caps consists of nine layers of double-sided modules with radial strips having a mean pitch of 80 µm. The two sides of each layer in both the barrel and the end-caps have a relative stereo angle of 40 mrad. The transition radiation tracker contains up to 73 (160) layers of staggered straws interleaved with fibres in the barrel (end-cap). Charged particles with p
T &0.5 GeV and
|η|< 2.5 will typically traverse three layers of silicon pixel detectors, four layers of double-sided microstrip sensors, and 36 straws.
The o
ffline event selection used the measurement from the minimum-bias trigger scintillator (MBTS)
3An exception is the third sampling layer that has a segmentation of 0.2×0.1 up to|η|=1.7.
counters [12]. The MBTS detects charged particles over 2.1 <
|η|< 3.9 using two counters placed at z
= ±3.6 m. MBTS counters are divided into 16 modules with 8 different positions in azimuth. Each counter provides measurement of both the pulse heights and arrival times of ionization energy deposits.
3 Event selection and data sets
The analysis utilizes an integrated luminosity of 0.14 nb
−1of Pb+Pb data and 4.0 pb
−1of pp data col- lected in 2011 and 2013, respectively, by the ATLAS detector. The Pb+Pb events used in the analysis were required to have a reconstructed primary vertex, and a time di
fference between hits from the two sides of the MBTS detector of less than 3 ns. The primary vertices were reconstructed from charged particle tracks with p
T> 0.5 GeV. The tracks were reconstructed from hits in the inner detector us- ing the standard track reconstruction algorithm [14] with settings optimized for the high hit density in heavy ion collisions [15]. The Pb
+Pb events were selected for recording by a combination of Level-1 minimum-bias and High Level Trigger (HLT) jet triggers. The Level-1 trigger required a total trans- verse energy measured in the calorimeter of greater than 10 GeV. The HLT jet trigger ran the o
ffline Pb
+Pb jet reconstruction algorithm, described below, for R
=0.2 jets except for the application of the final hadronic energy scale correction. The HLT selected events containing an R
=0.2 jet with transverse energy E
T> 20 GeV. A total of 14.2 million events passed this event selections.
The centrality of Pb
+Pb collisions was characterized by
ΣE
FCalT, the total transverse energy measured in the forward calorimeters (FCal) [15]. The results in this note were obtained using seven centrality bins defined according to successive percentiles of the
ΣE
TFCaldistribution ordered from the most central to the most peripheral collisions: 0-10%, 10-20%, 20-30%, 30-40%, 40-50%, 50-60%, and 60-80%.
The percentiles were defined after correcting the
ΣE
FCalTdistribution for the 2% minimum-bias trigger ine
fficiency which is a
ffecting the most peripheral bins and these are not included in this analysis.
The pp events used in the analysis were selected using the ATLAS jet trigger [16] with a requirement of minimum p
Tof 75 GeV. The jet trigger required a good signal from Level-1 MBTS trigger. The pp events were required to contain at least one primary vertex, reconstructed from at least two tracks. Jets originating from all such vertices were included in the measurement.
The performance of the ATLAS detector and offline analysis in measuring jets and charged particles in pp collisions was evaluated using a sample of 15 million Monte Carlo (MC) events obtained from PYTHIA [17] hard scattering events (using PYTHIA version 6.425, AUET2B tune [18], and CTEQ6L1 parton distribution functions [19]). The detector effects were fully simulated [20] using GEANT4 [21].
Several samples were produced for different intervals of generator-level (truth) R
=0.4 jet p
T. In total, the generator-level spectrum of jets spans 20 < p
T< 500 GeV. The reconstruction performance in the environment of Pb+Pb collisions was evaluated using a sample of 18 million events obtained by over- laying simulated PYTHIA hard-scattering events onto minimum-bias Pb+Pb events recorded in 2011.
In this overlay procedure the simulated hits were combined with the data from minimum-bias events to produce the final sample. The generator-level spectrum of jets in the overlay sample spans the transverse momentum interval of 35 < p
T< 560 GeV.
4 Jet and Track Selection
Jets were reconstructed using the techniques described in Ref. [6], which are briefly summarized here.
The anti-k
talgorithm was first run in four-momentum recombination mode, on
∆η
×∆φ
=0.1
×0.1
calorimeter towers as inputs for several values of the anti-k
tdistance parameter including R
=0.4 which
is used in this analysis. The tower kinematics were obtained by summing electromagnetic-scale energies
of calorimeter cells within the tower boundaries. Then, an iterative procedure was used to estimate
a layer- and η-dependent underlying event (UE) energy density while excluding actual jets from that estimate. The UE energy was corrected for presence of the elliptic flow and it was subtracted from each calorimeter cell within the towers included in the reconstructed jet. The final jet kinematics were calculated via a four-momentum sum of all (assumed massless) cells contained within the jets using subtracted E
Tvalues. A correction was applied to the reconstructed jet to account for jets not excluded or only partially excluded from the UE estimate. Then, a final jet η- and E
T-dependent hadronic energy scale calibration factor was applied.
At the trigger level, the HLT jet reconstruction algorithm was the same as the o
ffline, except for the correction to account for jets not excluded from the UE estimate and except for the final hadronic energy scale calibration which were not applied. The reconstructed offline jets triggered by the HLT reach a full e
fficiency at approximately 90 GeV. The jet reconstruction performance in terms of jet energy scale (JES) and jet energy resolution (JER) are as described in Ref. [6]. In order to evaluate the pseudorapidity dependence of the modifications of jet internal structure, jets reconstructed in four different pseudorapid- ity intervals, namely
|η|< 0.3, 0.3 <
|η|< 0.8, 1.2 <
|η|< 2.1, and
|η|< 2.1 were used in this analysis.
The pseudorapidity interval of 0.8 <
|η|< 1.2 is not considered in the analysis since localized losses in the efficiency corresponding to the transition between the SCT barrel and end-cap do not allow for a result with su
fficient precision. This pseudorapidity interval was excluded also from the measurement in the full pseudorapidity range,
|η|< 2.1.
The tracks from pp collisions used in this analysis are required to have at least one hit in the pixel detector and six hits in the silicon microstrip detector. In order to reject secondary particles, the transverse (d
0) and longitudinal (z
0sin θ) impact parameters of the tracks measured with respect to the primary vertex were required to be within 1.5 mm of the primary vertex (0.2 mm for d
0if p
T> 10 GeV).
In Pb
+Pb collisions, the occupancies of the three tracking subsystems increase to di
fferent degrees.
The pixel detector occupancy is below 1% even in the most central collisions. The corresponding number for the SCT detector is below 10%, while the occupancy in the TRT reaches 90%. To account for the high occupancy in Pb
+Pb events, the track reconstruction is configured di
fferently from that in pp collisions.
Consequently the track selection criteria are di
fferent compared to those used in pp collisions. Tracks from Pb+Pb collisions are required to have at least two hits in the pixel detector, including a hit in the first pixel layer if the hit is expected from the track trajectory, and seven hits in the silicon microstrip detector. In addition, the d
0and z
0sin θ of the tracks measured with respect to the primary vertex were required to satisfy
|d0/σ
d0|< 3 and
|z0sin θ/σ
z|< 3, where σ
d0and σ
zare uncertainties on d
0and
z
0sin θ, respectively, obtained from the track-fit covariance matrix. All tracks used in this analysis are
required to have p
T> 1 GeV.
The efficiency for reconstructing charged particles within jets was evaluated separately for pp and Pb+Pb collisions using Monte Carlo samples with scattering events described in Sec. 3. The efficiency was evaluated for charged particles satisfying the cuts described above which were associated to truth jets with p
T> 100 GeV in each of the four jet pseudorapidity intervals. In the case of Pb+Pb collisions, the efficiency was evaluated also separately for each centrality bin. The requirement of the association to jets reflects possible worsening of the track reconstruction in the case of the dense track environment present in the jet. The study of the track reconstruction efficiency as a function of multiplicity of charged particles in jets however did not show any substantial deterioration of the efficiency in the jet p
Trange covered in this study.
The tracking efficiency correction, c, was evaluated as a function of charged particle p
Tand η using
the tracking efficiency, ε, as c
=1/ε. The tracking efficiency was obtained as a ratio of tracks that have an
associated truth particle to all the truth particles. To guarantee a smooth behavior of the correction factors
as a function of track p
T, the tracking efficiency was parameterized in the region of 1 < p
T< 90 GeV
using a fourth order polynomial in the logarithm of the transverse track momentum. This functional
form gives a good description of the onset of the e
fficiency at low-p
Tas well as the behavior in the
intermediate- p
Tregion. At the same time it is not susceptible to statistical fluctuations in these regions.
The study of the high-p
Tbehavior in both the pp and Pb
+Pb simulation showed that the tracking e
ffi- ciency continues in general to follow the trends present at p
T< 90 GeV. Thus, the result of the fit using polynomial in logarithm for tracks with p
T> 90 GeV is replaced by a linear function with the slope determined from the di
fference of the fit in p
T =70 GeV and p
T =90 GeV. The resulting e
fficiency for reconstructing tracks along with its parameterization is shown in Fig. 1. The fake track contribution was evaluated by matching reconstructed tracks to truth MC particles and found to be negligible for tracks satisfying the above defined selection requirements.
[GeV]
particle
pT
10 102
Efficiency
0.5 0.6 0.7 0.8 0.9 1 1.1
1.2 ATLAS Preliminary Simulation
=2.76 TeV sNN
PYTHIA
| < 0.3 η
|
Pb + Pb MC 0-10%
Pb + Pb MC 60-80%
MC pp
[GeV]
particle
pT
10 102
Efficiency
0.5 0.6 0.7 0.8 0.9 1 1.1
1.2 ATLAS Preliminary Simulation
=2.76 TeV sNN
PYTHIA
| < 2.1 η 1.2 < |
Pb + Pb MC 0-10%
Pb + Pb MC 60-80%
MC pp
Figure 1: The tracking e
fficiency evaluated for particles in jets with p
jetT> 100 GeV as a function of truth charged particle transverse momentum, p
particleT, for jets with
|η|< 0.3 (left) and 1.2 <
|η|< 2.1 (right). Efficiency is shown for central and peripheral Pb+Pb collisions as well as for pp collisions. The full line represents the parameterization (for more details see the body of the text).
5 Analysis Procedure
The first step in the analysis is to obtain the uncorrected measured fragmentation functions, D
meas(z), and the distribution of charged particle transverse momenta measured inside the jet, D
meas(p
T), which are defined using following formulae,
D
meas( p
T)
≡1 ε
∆
N
ch( p
chT)
∆
p
chT, (4)
D
meas(z)
≡1 ε
∆
N
ch(z)
∆
z . (5)
Here
∆N
ch( p
chT) and
∆N
ch(z) represent the number of measured charged particles within
∆R
=0.4 of the jet axis in given bins of charged particle transverse momentum, p
chT, and z respectively
4. The ε represents the MC-evaluated track reconstruction efficiency. The superscript ‘meas’ in Eqs. (4), (5) indicates that
4The indices ‘ch’ and ‘jet’ are introduced in this section to better distinguish the quantities connected with charged particles from quantities connected with jets.
the measured distributions do not contain any corrections except the correction for the tracking efficiency.
The corrections for the UE and detector e
ffects were applied in the subsequent steps of the analysis as discussed in the next paragraphs.
Charged particles from the UE constitute a background which needs to be subtracted from the mea- sured distributions. This background depends on p
chT, η of charged particle, and the centrality of the collision. The contribution of the UE background was evaluated for each measured jet using a grid of R
=0.4 cones that spanned the full coverage of the inner detector. The cones had a fixed distance between their centroids chosen such that the coverage of the inner detector was maximized while the cones do not overlap each other. Any such cone having a charged particle with p
chT> 6 GeV or having a distance between its centroid and the nearest jet with p
T> 100 GeV smaller then 0.4 was assumed to be associated with a real jet in the event and was excluded from the UE background determination. After the exclusion, there was N
coneof cones which were used to estimate the UE contribution to a given jet.
The resulting UE charged particle yields, dn
UEch/dp
chTor dn
UEch/dz, were evaluated over 1 < p
chT<
6 GeV as a function of charged particle p
chT, p
jetT, and η
jetand averaged over all cones according to:
dn
UEchdp
chT =1 N
cone1 ε
∆
N
chcone( p
chT, p
jetT, η
jet)
∆
p
chT, (6)
dn
UEchdz
=1
N
cone1 ε
∆
N
chcone(z, p
jetT, η
jet)
∆
z
z=p
ch T pjet
T
cos∆R
. (7)
Here N
conerepresents the number of background cones associated with a given jet with p
jetTand η
jet,
∆
N
chconeis the number of charged particles summed across all cones associated to the jet in question, and
∆
R represents the distance between the centroid of a cone and the position of a given charged particle.
Not shown in Eqs. (6),(7) is a correction factor that was applied to each background cone to correct for the difference in the average UE particle yield at a given p
chTbetween the η position of the cone and η
jet, and a separate correction factor to account for the di
fference in the elliptic flow modulation at the φ position of the UE cone and φ
jet. That correction was based on a parameterization of the p
chTand centrality dependence of previously measured elliptic flow coefficients, v
2[15]. Since the measurement was not performed with respect to the reaction plane, the impact of the flow correction was at the level of few percent of the magnitude of UE yields. By evaluating the UE yields only from events containing jets included in the analysis, the background automatically had the correct distribution of centralities within a given centrality bin.
The UE yields need to be further corrected for the correlation between the actual UE yield underneath the jet and a finite, centrality dependent jet energy resolution. Due to the steeply falling nature of the jet p
Tspectra, the smearing due to jet energy resolution leads to a net migration of jets from lower p
Tto higher p
Tvalues (hereafter referred to as “upfeeding”) such that a jet reconstructed with a given p
recTwill correspond, on average, to a lower truth jet p
T,
hptruthT i. The upfeeding was observed to induce in theMC a di
fference between the UE yields determined as described above and the actual UE contribution to reconstructed jets. The magnitude of this di
fference was found to be centrality dependent and it also exhibited a weak p
jetTdependence. That difference was found to result from intrinsic correlations between the UE contribution to the yield of particles measured inside the jet and the MC p
jetTshift,
∆
p
jetT =p
recT −p
truthT. In particular, jets with positive (negative)
∆p
jetTwere found to have an UE contribution
larger (smaller) than jets with
∆p
jetT ∼0. Due to the net upfeeding on the falling jet spectrum, the selection
of jets above a given p
jetTthreshold causes the UE contribution to be larger than that estimated from the
above-described procedure. The average fractional mismatch in the estimated UE background was found
to have minor dependence on p
chTand p
jetTand to vary with centrality by factors between 0-20% with
respect to the original UE estimates. To correct for this e
ffect, the centrality-, η-, p
jetT- and p
chT-dependent (or z-dependent) multiplicative correction factors were applied on dn
UEch/dp
chT(or dn
UEch/dz) distributions.
These multiplicative factors were estimated as a ratio of UE distributions calculated from tracks within the area of a jet which do not have an associated truth particle and the original UE distributions. The corrected UE distributions, d˜ n
UEch/d p
chTand d˜ n
UEch/dz, were then subtracted from measured distributions as follows
D
sub( p
T)
=D
meas(p
T)
−d˜ n
UEchd p
chT, (8)
D
sub(z)
=D
meas(z)
−d˜ n
UEchdz . (9)
The UE subtracted measured distributions, D
sub( p
T) and D
sub(z), need to be corrected for the detector effects. There are two main detector effects: smearing due to finite JER and smearing due to finite track momentum resolution. The former involves unfolding in the p
jetT, the latter involves unfolding in the p
chT. Since the tracks were evaluated in jets, a two-dimensional unfolding needs to be used to correct for both of these detector effects simultaneously. The two-dimensional Bayesian unfolding [22] using the RooUnfold package [23] was used for this purpose. Using the MC samples, four dimensional response matrices were created using the true and reconstructed p
jetTand the true and reconstructed p
chTfor charged particles reconstructed passing the track selection criteria defined in Sec. 4. The response matrices were created separately for pp and Pb+Pb data for each centrality and pseudorapidity bin. The entries to the response matrix were weighted by the tracking e
fficiency correction. Four iterations in the Bayesian unfolding procedure were found sufficient to deliver a stable result that does not change with increasing numbers of iterations.
The fragmentation distributions were measured for all calorimeter jets including those jets that do not contain any charged particle with p
chT> 1 GeV. The proper normalization of the measured distributions by the number of jets requires a separate unfolding of the jet p
Tspectrum. This was performed by applying a one-dimensional Bayesian unfolding, separately in each centrality and pseudorapidity interval. One or two iterations were found to be sufficient for unfolding jet spectra in various centrality and pseudorapidity intervals. The unfolded jet p
Tspectra were integrated over a given jet p
Tinterval. The result of this integration represents the total number of jets spanning a given p
Tinterval and was used to normalize the unfolded fragmentation distributions, D
unfolded(p
T) and D
unfolded(z), as follows
D( p
T)
=1
N
jetD
unfolded( p
T), (10)
D(z)
=1
N
jetD
unfolded(z), (11)
where D( p
T) and D(z) are the final, particle level corrected distributions that are presented in Sec. 7 of this note.
The performance of the above described reconstruction procedure was tested by comparing unfolded
distributions in MC samples with truth distributions. The ratio of corrected to truth distributions was
found to be consistent with unity for all the bins used in the measurement. The performance of the
reconstruction procedure was further tested in the data by a procedure in which unfolded distributions
were folded back using the response matrix. These “refolded” distributions were then compared to orig-
inal raw distributions. Only a sub-percent level differences between the raw distributions and refolded
distributions were found.
6 Systematic Uncertainties
In this section, the systematic uncertainties related to the measured distributions are discussed. The following sources of systematic uncertainties are identified for this measurement: jet energy scale (JES), jet energy resolution (JER), reconstruction of tracks, and unfolding. The systematic uncertainties were evaluated separately for distributions and their ratios for each pseudorapidity and centrality selection.
The systematic uncertainty due to JES has two contributions, the standard pp JES uncertainty and the heavy ion JES uncertainty. The impact of the JES uncertainty on the measured distributions was deter- mined by shifting the transverse momentum of reconstructed jets as follows, p
0T=p
T·(1
±U
JES(p
T, η)), where U
JES(p
T, η) is either the pp JES uncertainty [24] or heavy ion JES uncertainty [25]. The distribu- tions with shifted p
Twere unfolded and compared to the original distributions. The fractional difference was used as an estimate of the systematic uncertainty. To account for systematic uncertainties due to any disagreement between the JER in data and MC, the unfolding procedure was repeated with a modified response matrix. The matrix was generated by repeating the MC study with the p
Tof reconstructed jets smeared by a relative uncertainty evaluated as a function of η and p
Tof the jet [24].
The systematic uncertainty due to track reconstruction can be connected with the systematic uncer- tainty in the determination of the tracking efficiency correction. This systematic uncertainty was esti- mated by performing the analysis with three di
fferent sets of selection criteria imposed on tracks, called
“loose”, “standard”, and “tight”. The standard selection criteria are used as a default in this analysis. The tight selection criteria imposed more stringent requirements on the track quality, leading to a 15-20%
reduction of the tracking e
fficiency depending on the track p
T, η, and centrality. The loose selection criteria imposed more relaxed requirements on track quality leading to a 5-10% enhancement of tracking efficiency. The differences in the selection criteria bring significant differences both in the magnitude and the p
T-dependence of the tracking e
fficiency.
The unfolding procedure is sensitive to the MC model and the number of iterations used, N
it. Two systematic variations are implemented to account for this: (1) N
itis varied by
+/- 1; (2) the MC distribu-tions are reweighted to match the data. The data is then unfolded using the varied MC distributions. The di
fferences with respect to the original unfolded data are taken as the systematic uncertainty. To deter- mine the total systematic uncertainty the systematic uncertainties from all different sources are added in quadrature.
7 Results
The measurements of the jet internal structure are performed differentially in the jet p
Tand η and for two collision systems, pp and Pb
+Pb. In the case of Pb
+Pb collisions, the measurement is performed in seven bins of centrality, 0
−10%, 10
−20%, 20
−30%, 30
−40%, 40
−50%, 50
−60%, and 60
−80%.
The measured distributions are evaluated in four different pseudorapidity intervals of the jet:
|η|<
2.1,
|η|< 0.3, 0.3 <
|η|< 0.8, and 1.2 <
|η|< 2.1. The pseudorapidity interval of 0.8 <
|η|< 1.2 is not considered in the analysis since localized losses in the track reconstruction e
fficiency corresponding to the transition between the SCT barrel and end-cap do not allow for a result with sufficient precision.
This pseudorapidity interval was excluded also from the measurement in the full pseudorapidity range,
|η|
< 2.1. The distributions are also evaluated in four di
fferent jet p
Tintervals: 100 < p
jetT< 398 GeV, 100 < p
jetT< 126 GeV, 126 < p
jetT< 158 GeV, and 158 < p
jetT< 398 GeV. These intervals were chosen to correspond to intervals selected in the measurement of jet nuclear modification factor [7].
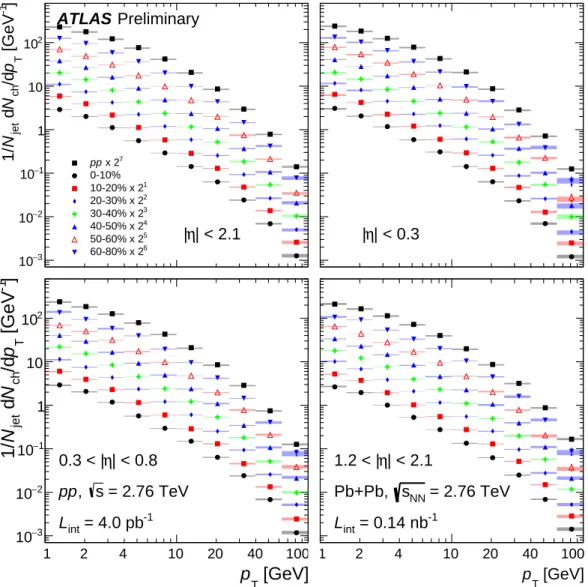
The D( p
T) and D(z) distributions corrected to the hadron level by the unfolding procedure described
in the previous section are shown in Fig. 2 and Fig. 3, respectively. Di
fferent panels show distributions
evaluated for different pseudorapidity intervals for jets with 100 < p
T< 398 GeV. The shaded band
represents total systematic uncertainty, the error bars represent statistical uncertainties. The distributions
[GeV]
p
T]
-1[GeV
Tp /d
chN d
jetN 1/
−3
10
−2
10
−1
10 1 10 102
| < 0.8 η 0.3 < |
= 2.76 TeV s
, pp
= 4.0 pb-1
Lint
1 2 4 10 20 40 100
[GeV]
pT
]-1 [GeV Tp/dchN djetN1/
−3
10
−2
10
−1
10 1 10 102
x 27
pp 0-10%
10-20% x 21
20-30% x 22
30-40% x 23
40-50% x 24
50-60% x 25
60-80% x 26
| < 2.1 η
|
[GeV]
pT
]-1 [GeV Tp/dchN djetN1/
−3
10
−2
10
−1
10 1 10 102
| < 2.1 η 1.2 < |
= 2.76 TeV sNN
Pb+Pb, = 0.14 nb-1
Lint
1 2 4 10 20 40 100
[GeV]
pT
]-1 [GeV Tp/dchN djetN1/
−3
10
−2
10
−1
10 1 10 102
| < 0.3 η
| Preliminary
ATLAS
Figure 2: Unfolded charged particle transverse momentum distributions, D(p
T), measured in pp colli-
sions and for seven centrality bins measured in Pb+Pb collisions. Four panels show D( p
T) distributions
with different selection on jet pseudorapidity for jets with p
Tin the interval of 100
−398 GeV. The er-
ror bars on the data points indicate statistical uncertainties while the shaded bands indicate systematic
uncertainties.
z z /d
chN d
jetN 1/
−1
10 1 10 102
103
104
| < 0.8 η 0.3 < |
= 2.76 TeV s
, pp
= 4.0 pb-1
Lint
0.01 0.04 0.1 0.2 0.5 1
z z/dchN djetN1/
−1
10 1 10 102
103
104
x 27
pp 0-10%
10-20% x 21
20-30% x 22
30-40% x 23
40-50% x 24
50-60% x 25
60-80% x 26
| < 2.1 η
|
z z/dchN djetN1/
−1
10 1 10 102
103
104
| < 2.1 η 1.2 < |
= 2.76 TeV sNN
Pb+Pb, = 0.14 nb-1
Lint
0.01 0.04 0.1 0.2 0.5 1
z z/dchN djetN1/
−1
10 1 10 102
103
104
| < 0.3 η
| Preliminary
ATLAS
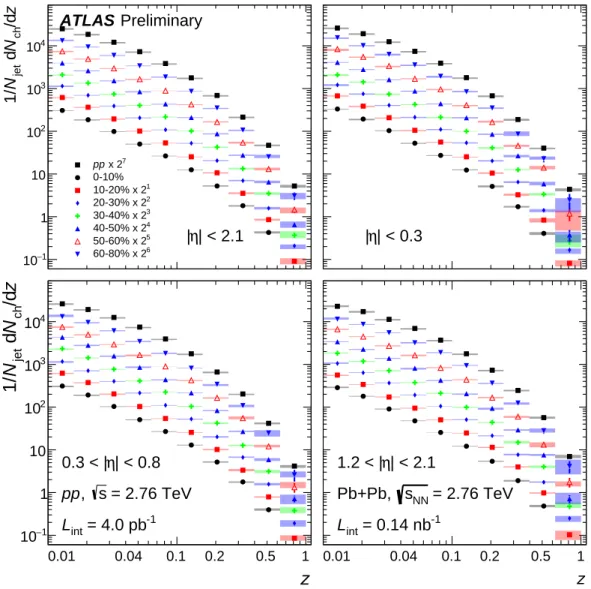
Figure 3: Unfolded distributions of longitudinal momentum fraction, D(z), measured in pp collisions and
for seven centrality bins measured in Pb+Pb collisions. Four panels show D(z) distributions with different
selection on jet pseudorapidity for jets with p
Tin the interval of 100
−398 GeV. The error bars on the
data points indicate statistical uncertainties while the shaded bands indicate systematic uncertainties.
exhibit a difference in shape between central heavy ion collisions and peripheral heavy ion collisions or the pp reference. To quantify this di
fference the ratios of D(p
T) and D(z) distributions measured in heavy ion collisions to those measured in pp collisions were calculated and termed R
D(pT)and R
D(z), respectively, following nomenclature introduced in Ref. [8].
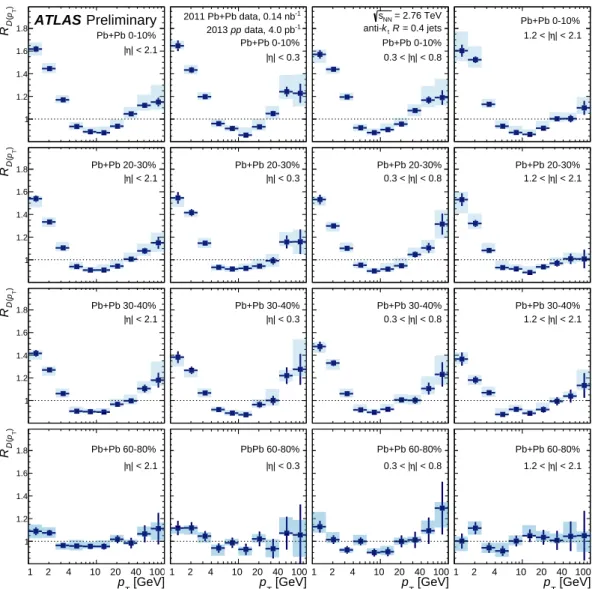
The R
D(pT)and R
D(z)distributions are shown in Figs. 4–7. Figure 4 shows the R
D(pT)distributions for four selections in collision centrality, namely 0
−10%, 20
−30%, 30
−40% and 60
−80%, and for four pseudorapidity intervals of jets with p
jetTin the interval of 100–398 GeV. These ratios show an enhancement in fragment yield in central collisions for p
chT< 4 GeV, a reduction in fragment yields for 4 < p
chT< 25 GeV and an enhancement in the fragment yield for p
chT> 25 GeV. The magnitude of these modifications decreases for more peripheral collisions. A similar observation can be made also for the R
D(z)distributions shown in Fig. 5. The characteristic shape of these ratios was also seen in the previous study [8] where the 60
−80% bin was used as a reference. Figures 4 and 5 show that the difference in the modifications between different pseudorapidity selections is marginal for fragments with p
chT< 25 GeV and z < 0.25, respectively. Only at high p
chTor high z a change in the trend may be observed, where the enhancement is systematically lower for more forward jets compared to jets measured in the central pseudorapidity region.
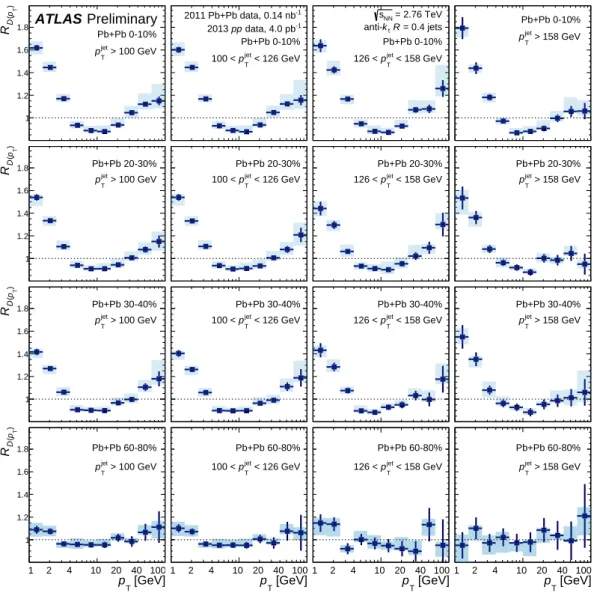
Figure 6 and 7 show the R
D(pT)and R
D(z)distributions, respectively, both for four p
jetTintervals of jets with
|η|< 2.1. No significant di
fference can be observed between jets with 100 < p
T< 126 GeV and jets with 126 < p
T< 158 GeV. However a clear difference is seen for jets with p
Tin these two p
Tintervals and jets with p
Tin the interval of 158
−398 GeV where the enhancement at high- p
chTis systematically lower. A trend of the decrease of yields in D(z) distributions with increasing p
jetTfor z in the interval of 0.01− 0.04 can be seen in Fig. 7. This is consistent with no evolution with p
jetTseen in D( p
T) distributions in Fig. 6 since increasing p
jetTmeans decreasing z for a fixed transverse momentum of a particle.
To better quantify the trends seen in the ratios, the di
fferences between integrals of D( p
T) distribu- tions measured in heavy ion collisions and the integrals of D( p
T) distributions measured in pp collisions, N
ch, was evaluated,
N
ch ≡Z
p
T,maxp
T,min
D( p
T)|
cent−D(p
T)|
ppd p
T. (12)
Here ‘cent’ represents one of seven centrality bins. Three ranges defined by values of p
T,minand p
T,maxwere chosen to match the observations in R
D(pT), namely 1
−4 GeV, 4
−25 GeV, and 25
−100 GeV. Thus three values of N
chwere obtained for each centrality bin which represent the number of particles carrying:
(1) the excess seen in heavy ion collisions for particles with 1 < p
T< 4 GeV, (2) a depletion seen for particles with 4 < p
T< 25 GeV, and (3) the enhancement seen for particles with 25 < p
T< 100 GeV.
Further, the di
fference in integrals of the first moment of the D(p
T) distributions, P
chT, were also evaluated, P
chT ≡Z
p
T,maxp
T,min
D(p
T)|
cent−D( p
T)|
pp
p
Tdp
T. (13)
These di
fferences represent the total transverse momentum of particles carrying the excess or the deple- tion observed in R
D(pT)distributions.
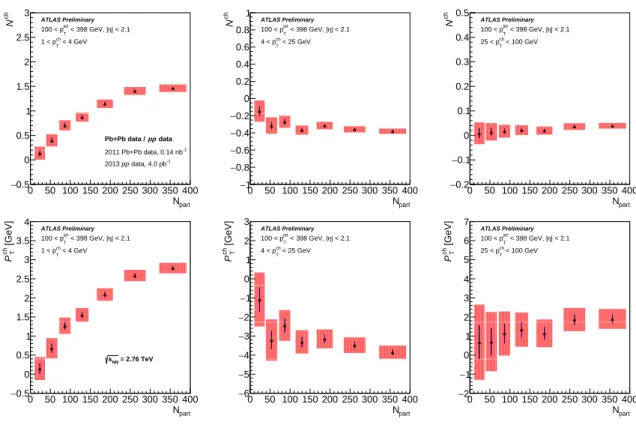
The result of performing this calculation is shown in Fig. 8 where the di
fferences of integrals are
plotted as a function of number of participants calculated using the Glauber model analysis of the
ΣE
TFCal[15, 26, 27]. A clear, almost logarithmic, increase of yields of particles with low transverse momenta
with increasing centrality is seen. In contrast, the intermediate- p
chTregion does not exhibit significant
modifications with varying centrality. The yield at high- p
chTexhibits a sign of an increase with increasing
centrality, however a significance of this observation is limited. The changes in the total transverse
momentum follow the trends seen in the yields. The significance of the increase of the total transverse
[GeV]
pT )Tp(DR
1 1.2 1.4 1.6 1.8
| < 2.1 η
| Pb+Pb 60-80%
1 2 4 10 20 40 100
[GeV]
pT
1 10 102
)Tp(DR
1 1.2 1.4 1.6 1.8
| < 2.1 η
| Pb+Pb 30-40% [GeV]
pT
1 10 102
)Tp(DR
1 1.2 1.4 1.6 1.8
| < 2.1 η
| Pb+Pb 20-30% [GeV]
pT
1 10 102
)Tp(DR
1 1.2 1.4 1.6 1.8
| < 2.1 η
| Pb+Pb 0-10%
[GeV]
pT )Tp(DR
1 1.2 1.4 1.6 1.8
| < 0.3 η
| PbPb 60-80%
1 2 4 10 20 40 100
[GeV]
pT
1 10 102
)Tp(DR
1 1.2 1.4 1.6 1.8
| < 0.3 η
| Pb+Pb 30-40% [GeV]
pT
1 10 102
)Tp(DR
1 1.2 1.4 1.6 1.8
| < 0.3 η
| Pb+Pb 20-30% [GeV]
pT
1 10 102
)Tp(DR
1 1.2 1.4 1.6 1.8
2011 Pb+Pb data, 0.14 nb-1
data, 4.0 pb-1
pp 2013
| < 0.3 η
| Pb+Pb 0-10%
[GeV]
pT )Tp(DR
1 1.2 1.4 1.6 1.8
| < 0.8 η 0.3 < | Pb+Pb 60-80%
1 2 4 10 20 40 100
[GeV]
pT
1 10 102
)Tp(DR
1 1.2 1.4 1.6 1.8
| < 0.8 η 0.3 < | Pb+Pb 30-40% [GeV]
pT
1 10 102
)Tp(DR
1 1.2 1.4 1.6 1.8
| < 0.8 η 0.3 < | Pb+Pb 20-30% [GeV]
pT
1 10 102
)Tp(DR
1 1.2 1.4 1.6 1.8
= 2.76 TeV sNN
= 0.4 jets
tR k anti-
| < 0.8 η 0.3 < | Pb+Pb 0-10%
[GeV]
pT )Tp(DR
1 1.2 1.4 1.6 1.8
| < 2.1 η 1.2 < | Pb+Pb 60-80%
1 2 4 10 20 40 100
[GeV]
pT
1 10 102
)Tp(DR
1 1.2 1.4 1.6 1.8
| < 2.1 η 1.2 < | Pb+Pb 30-40%pT [GeV]
1 10 102
)Tp(DR
1 1.2 1.4 1.6 1.8
| < 2.1 η 1.2 < | Pb+Pb 20-30% [GeV]
pT
1 10 102
)Tp(DR
1 1.2 1.4 1.6
1.8 1.2 < |η| < 2.1 Pb+Pb 0-10%
Preliminary ATLAS
Figure 4: The ratio of unfolded D( p
T) distributions measured in heavy ion collisions to unfolded D( p
T)
distributions measured in pp collisions, R
D(pT). R
D(pT)distributions are evaluated in four different cen-
trality bins (rows) and four di
fferent selections on jet pseudorapidity of jets with 100 < p
T< 398 GeV
(columns). The error bars on the data points indicate statistical uncertainties while the shaded bands
indicate systematic uncertainties.
z
D(z)R
1 1.2 1.4 1.6 1.8
| < 2.1 η
| Pb+Pb 60-80%
0.01 0.04 0.1 0.2 0.5
0.0
z
−2
10 10−1
D(z)R
1 1.2 1.4 1.6 1.8
| < 2.1 η
| Pb+Pb 30-40%z
−2
10 10−1
D(z)R
1 1.2 1.4 1.6 1.8
| < 2.1 η
| Pb+Pb 20-30%z
−2
10 10−1
D(z)R
1 1.2 1.4 1.6 1.8
| < 2.1 η
| Pb+Pb 0-10%
z
D(z)R
1 1.2 1.4 1.6 1.8
| < 0.3 η
| PbPb 60-80%
0.01 0.04 0.1 0.2 0.5
0.0
z
−2
10 10−1
D(z)R
1 1.2 1.4 1.6 1.8
| < 0.3 η
| Pb+Pb 30-40%z
−2
10 10−1
D(z)R
1 1.2 1.4 1.6 1.8
| < 0.3 η
| Pb+Pb 20-30%z
−2
10 10−1
D(z)R
1 1.2 1.4 1.6 1.8
2011 Pb+Pb data, 0.14 nb-1
data, 4.0 pb-1
pp 2013
| < 0.3 η
| Pb+Pb 0-10%
z
D(z)R
1 1.2 1.4 1.6 1.8
| < 0.8 η 0.3 < | Pb+Pb 60-80%
0.01 0.04 0.1 0.2 0.5
0.0
z
−2
10 10−1
D(z)R
1 1.2 1.4 1.6 1.8
| < 0.8 η 0.3 < | Pb+Pb 30-40%z
−2
10 10−1
D(z)R
1 1.2 1.4 1.6 1.8
| < 0.8 η 0.3 < | Pb+Pb 20-30%z
−2
10 10−1
D(z)R
1 1.2 1.4 1.6 1.8
= 2.76 TeV sNN
= 0.4 jets
tR k anti-
| < 0.8 η 0.3 < | Pb+Pb 0-10%
z
D(z)R
1 1.2 1.4 1.6 1.8
| < 2.1 η 1.2 < | Pb+Pb 60-80%
0.01 0.04 0.1 0.2 0.5
0.0
z
−2
10 10−1
D(z)R
1 1.2 1.4 1.6 1.8
| < 2.1 η 1.2 < | Pb+Pb 30-40%z
−2
10 10−1
D(z)R
1 1.2 1.4 1.6 1.8
| < 2.1 η 1.2 < | Pb+Pb 20-30%z
−2
10 10−1
D(z)R
1 1.2 1.4 1.6
1.8 1.2 < |η| < 2.1 Pb+Pb 0-10%
Preliminary ATLAS