ATLAS-CONF-2020-006 07April2020
ATLAS CONF Note
ATLAS-CONF-2020-006
6th April 2020
Measurements of 𝑾 𝑯 and 𝒁𝑯 production in the 𝑯 → 𝒃𝒃¯ decay channel in 𝒑 𝒑 collisions at 13 TeV
with the ATLAS detector
The ATLAS Collaboration
Measurements are presented of the Standard Model Higgs boson decaying into a𝑏𝑏¯ pair and produced in association with a𝑊 or𝑍 boson decaying into leptons, using proton–proton collision data collected between 2015 and 2018 by the ATLAS detector. The measurements use data delivered by the Large Hadron Collider at a centre-of-mass energy of
√
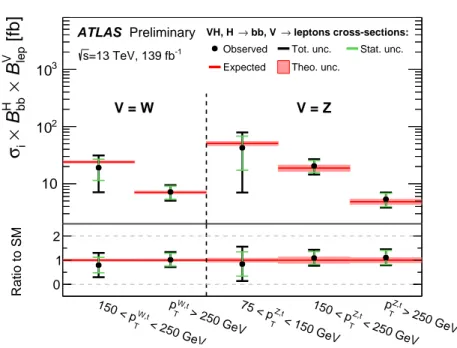
𝑠=13 TeV, corresponding to an integrated luminosity of 139 fb−1. The production of a Higgs boson in association with a𝑊or𝑍 boson is established, with observed (expected) significances of 4.0 (4.1) and 5.3 (5.1) standard deviations, respectively. Cross-sections of associated production of a Higgs boson decaying into bottom quark pairs with an electroweak gauge boson,𝑊or𝑍, decaying into leptons are measured as a function of the gauge boson transverse momentum in kinematic fiducial volumes. The cross-section measurements are all consistent with the Standard Model expectations, and the total uncertainties vary from 30% in the high gauge boson transverse momentum regions to 85% in the low regions.
©2020 CERN for the benefit of the ATLAS Collaboration.
Reproduction of this article or parts of it is allowed as specified in the CC-BY-4.0 license.
1 Introduction
The Higgs boson [1–4] was discovered in 2012 by the ATLAS and CMS Collaborations [5, 6] with a mass of approximately 125 GeV from the analysis of proton–proton (𝑝 𝑝) collisions produced by the Large Hadron Collider (LHC) [7]. Since then, the analysis of data collected at centre-of-mass energies of 7 TeV, 8 TeV and 13 TeV in Runs 1 and 2 of the LHC has led to the observation and measurements of many of the production modes and decay channels predicted by the Standard Model (SM) [8–23].
The dominant decay of the SM Higgs boson is into pairs of𝑏-quarks, with an expected branching fraction of 58.2% for a mass of𝑚𝐻 =125 GeV [24,25]. However, large backgrounds from multi-jet production make a search in the dominant gluon fusion production mode very challenging at hadron colliders [26]. The most sensitive production modes for detecting𝐻→𝑏𝑏¯ decays are the associated production of a Higgs boson and a𝑊 or𝑍boson [27], referred to as the𝑉 𝐻 channel (𝑉 =𝑊 or𝑍), where the leptonic decay of the vector boson enables efficient triggering and a significant reduction of the multi-jet background.
As well as probing the dominant decay of the Higgs boson, this measurement allows the overall Higgs boson decay width [28,29] to be constrained, provides the best sensitivity to the𝑊 𝐻and𝑍 𝐻production modes and allows Higgs boson production at high transverse momentum to be probed, which (for instance) provides enhanced sensitivity to some beyond the SM physics models in effective field theories [30]. The 𝑏𝑏¯ decay of the Higgs boson was observed by the ATLAS [31] and CMS Collaborations [32] using data collected at centre-of-mass energies of 7 TeV, 8 TeV and 13 TeV during Runs 1 and 2 of the LHC. ATLAS also used the same dataset to perform differential measurements of the𝑉 𝐻,𝐻 → 𝑏𝑏¯ cross-section in kinematic fiducial volumes defined in the simplified template cross-section (STXS) framework [33]. These measurements were used to set limits on the parameters of an effective Lagrangian sensitive to anomalous Higgs boson couplings with the electroweak gauge bosons.
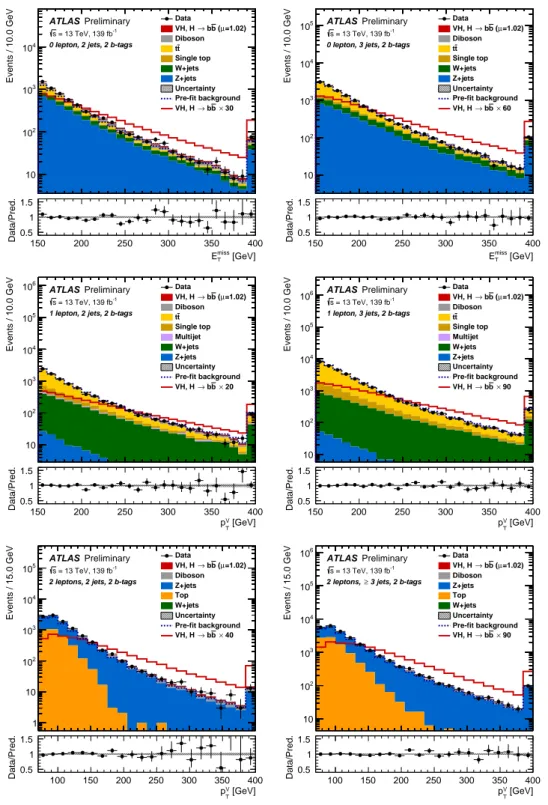
This note describes an update to the measurements of the SM Higgs boson decaying into a𝑏𝑏¯ pair in the 𝑉 𝐻production mode with the ATLAS detector in Run 2 of the LHC presented in Refs. [31,33]. Events are categorised in 0-, 1- and 2-lepton channels, based on the number of charged leptons,ℓ (electrons or muons1), to explore the𝑍 𝐻 → 𝜈 𝜈 𝑏𝑏¯,𝑊 𝐻 →ℓ 𝜈 𝑏𝑏¯ and 𝑍 𝐻 →ℓℓ 𝑏𝑏¯ signatures, respectively. The dominant background processes after the event selection are𝑉 +jets,𝑡𝑡¯, single-top quark and diboson production. Multivariate discriminants, built from variables that describe the kinematics, jet flavour and missing energy content of the selected events, are used to maximise the sensitivity to the Higgs boson signal.
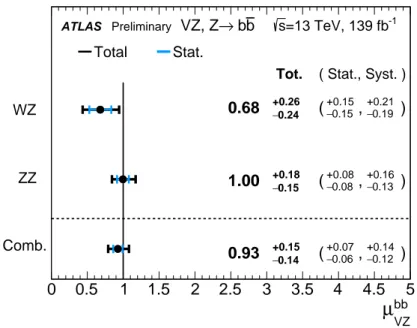
Their output distributions are used as inputs to a binned maximum-likelihood fit, referred to as the global likelihood fit, which allows the yields and kinematics of both the signal and the background processes to be estimated. This method is validated using a diboson analysis, where the nominal multivariate analysis is modified to extract the𝑉 𝑍,𝑍 → 𝑏𝑏¯ diboson process. The Higgs boson signal measurement is also cross-checked with a dijet-mass analysis, where the signal yield is measured using the mass of the dijet system as the main observable instead of the multivariate discriminant.
This update uses 139 fb−1 of 𝑝 𝑝 collision data collected at a centre-of-mass energy of 13 TeV, to be compared with 79.8 fb−1for the previous result. In addition, several improvements have been implemented:
enhanced object calibrations, more coherent categorisation between the event selection and the STXS binning, re-optimised multivariate discriminants including the addition of more information, redefined signal and control regions, a significant increase in the effective number of simulated events and re-derived background modelling uncertainties, including using a multivariate approach to estimate the modelling uncertainty on the dominant backgrounds. A complementary analysis using the same final states, but
1This includes electrons and muons produced from the leptonic decay of a𝜏-lepton.
which focuses on regions of higher Higgs boson transverse momentum not accessible using the techniques outlined in this note, has also been undertaken [34]. The same dataset was used resulting in some overlap in the events analysed.
2 The ATLAS detector
ATLAS [35] is a general-purpose particle detector covering nearly the entire solid angle2 around the collision point. An inner tracking detector, located within a 2 T axial magnetic field generated by a thin superconducting solenoid, is used to measure the trajectories and momenta of charged particles. The inner layers consist of high-granularity silicon pixel detectors covering a pseudorapidity range|𝜂| < 2.5, and an innermost layer [36,37] that was added to the detector between Run 1 and Run 2. Silicon microstrip detectors covering|𝜂| <2.5 are located beyond the pixel detectors. Outside the microstrip detectors and covering|𝜂| < 2.0, there are straw-tube tracking detectors, which also provide measurements of transition radiation that are used in electron identification.
A calorimeter system surrounds the inner tracking detector, covering the pseudorapidity range|𝜂| <4.9.
Within the region|𝜂| <3.2, electromagnetic calorimetry is provided by barrel (|𝜂| <1.475) and endcap (1.375< |𝜂| <3.2) high-granularity lead/liquid-argon (LAr) sampling calorimeters, with an additional thin LAr presampler covering|𝜂|< 1.8 to correct for energy loss in material upstream of the calorimeters.
Hadronic calorimetry is provided by a steel/scintillator-tile calorimeter within|𝜂| <1.7, and copper/LAr endcap calorimeters extend the coverage to|𝜂| =3.2. The solid angle coverage for|𝜂|between 3.2 and 4.9 is completed with copper/LAr and tungsten/LAr calorimeter modules optimised for electromagnetic and hadronic measurements, respectively.
The outermost part of the detector is the muon spectrometer, which measures the curved trajectories of muons in the magnetic field of three large air-core superconducting toroidal magnets. High-precision tracking is performed within the range|𝜂| <2.7 and there are chambers for fast triggering within the range
|𝜂| < 2.4.
A two-level trigger system [38] is used to reduce the recorded data rate. The first level is a hardware implementation aiming to reduce the rate to around 100 kHz, while the software-based high-level trigger provides the remaining rate reduction to approximately 1 kHz.
3 Data and simulated event samples
The data used in this analysis were collected using unprescaled single lepton or missing transverse energy triggers at a centre-of-mass energy of 13 TeV during the 2015–2018 running periods. Events are selected for analysis only if they are of good quality and if all the relevant detector components are known to have been in good operating condition, which corresponds to a total integrated luminosity of 139.0±2.4 fb−1[39, 40]. The recorded events contain an average of 34 inelastic 𝑝 𝑝collisions per bunch-crossing.
2ATLAS uses a right-handed coordinate system with its origin at the nominal interaction point (IP) in the centre of the detector and the𝑧-axis coinciding with the axis of the beam pipe. The𝑥-axis points from the IP towards the centre of the LHC ring, and the𝑦-axis points upward. Cylindrical coordinates (𝑟,𝜙) are used in the transverse plane,𝜙being the azimuthal angle around the 𝑧-axis. The pseudorapidity is defined in terms of the polar angle𝜃as𝜂=−ln tan(𝜃/2). The distance in (𝜂,𝜙) coordinates, Δ𝑅=p
(Δ𝜙)2+ (Δ𝜂)2, is also used to define cone sizes. Transverse momentum and energy are defined as𝑝
T=𝑝sin𝜃and 𝐸T=𝐸sin𝜃, respectively.
Monte Carlo (MC) simulated events are used to model most of the backgrounds from SM processes and the𝑉 𝐻,𝐻 →𝑏𝑏¯ signal processes. A summary of all the generators used for the simulation of the signal and background processes is shown in Table1. Samples produced with alternative generators are used to estimate systematic uncertainties in the event modelling, as described in Section7. The same event generators as in Ref. [31] are used; however, the number of simulated events in all samples has been increased by at least the factor by which the integrated luminosity grew compared to the previous publication (∼1.75). In addition, processes which significantly contributed to the statistical uncertainty on the background in the previous publication, benefited from a further factor of two increase in the number of simulated events produced.
All simulated processes are normalised using the most accurate theoretical cross-section predictions currently available and were generated to next-to-leading-order (NLO) accuracy at least, except for the 𝑔𝑔 → 𝑍 𝐻and𝑔𝑔 →𝑉 𝑉 processes which are generated at LO. All samples of simulated events were passed through the ATLAS detector simulation [41] based on GEANT 4 [42] and were reconstructed with the standard ATLAS reconstruction software. The effects of multiple interactions in the same and nearby bunch crossings (pile-up) were modelled by overlaying minimum-bias events, simulated using the soft QCD processes of Pythia 8.186 [43] with the A3 [44] set of tuned parameters (tune) and NNPDF2.3LO [45]
parton distribution functions (PDF). For all samples of simulated events, except for those generated using Sherpa [46], the EvtGen v1.6.0 program [47] was used to describe the decays of bottom and charm hadrons.
4 Object and event selection
The event topologies characteristic of𝑉 𝐻,𝐻→𝑏𝑏¯ processes considered contain zero, one or two charged leptons, and two ‘𝑏-jets’ containing particles from𝑏-hadron decays. The object and event selections broadly follow those of Ref. [31] but with updates to the definition of the signal and control regions.
4.1 Object reconstruction
Tracks measured in the inner detector are used to reconstruct interaction vertices [83], of which the one with the highest sum of squared transverse momenta of associated tracks is selected as the primary vertex of the hard interaction.
Electrons are reconstructed from topological clusters of energy deposits in the electromagnetic calorimeter and matched to a track in the inner detector [84,85]. Following Refs. [85,86],looseelectrons are required to have 𝑝
T > 7 GeV and|𝜂| < 2.47, to have small impact parameters,3 to fulfill a loose track isolation requirement, and to meet a ‘LooseLH’ quality criterion computed from shower shape, track quality and track-cluster matching variables. In the 1-lepton channel,tightelectrons are selected using a ‘TightLH’
likelihood requirement and a calorimeter-based isolation in addition the the track-based isolation.
Muons are required to be within the acceptance of the muon spectrometer|𝜂| <2.7, to have𝑝
T >7 GeV, and to have small impact parameters. Loosemuons are selected using a ‘loose’ quality criterion [87]
and a loose track isolation requirement. In the 1-lepton channel,tightmuons fulfill the ‘medium’ quality criterion and a stricter track isolation requirement.
3Transverse and longitudinal impact parameters are defined relative to the primary vertex position, where the beam line is used to approximate the primary vertex position in the transverse plane.
Table 1: The generators used for the simulation of the signal and background processes. If not specified, the order of the cross-section calculation refers to the expansion in the strong coupling constant (𝛼
S). The acronyms ME, PS and UE stand for matrix element, parton shower and underlying event, respectively. (★)The events were generated using the first PDF in the NNPDF3.0NLO set and subsequently reweighted to the PDF4LHC15NLO set [48] using the internal algorithm in Powheg-Box v2. (†)The NNLO(QCD)+NLO(EW) cross-section calculation for the 𝑝 𝑝→𝑍 𝐻process already includes the𝑔𝑔 →𝑍 𝐻contribution. The𝑞 𝑞→ 𝑍 𝐻process is normalised using the cross-section for the𝑝 𝑝→𝑍 𝐻process, after subtracting the𝑔𝑔 →𝑍 𝐻contribution. An additional scale factor is applied to the𝑞 𝑞 →𝑉 𝐻processes as a function of the transverse momentum of the vector boson, to account for electroweak (EW) corrections at NLO. This makes use of the𝑉 𝐻differential cross-section computed with Hawk [49,50]. Contributions from photon-induced processes are also included for𝑝 𝑝→𝑊 𝐻[51]. (‡) For the diboson samples the cross-sections are calculated by the Monte Carlo generator at NLO accuracy in QCD.
Process ME generator ME PDF PS and UE model Cross-section
Hadronisation tune order
Signal, mass set to 125 GeV and𝑏𝑏¯branching fraction to 58%
𝑞 𝑞→𝑊 𝐻 Powheg-Box v2 [52] + NNPDF3.0NLO(★)[53] Pythia 8.212 [43] AZNLO [54] NNLO(QCD)(†)+
→ℓ 𝜈 𝑏𝑏¯ GoSam [55] + MiNLO [56,57] NLO(EW) [58–64]
𝑞 𝑞→𝑍 𝐻 Powheg-Box v2 + NNPDF3.0NLO(★) Pythia 8.212 AZNLO NNLO(QCD)(†)+
→𝜈 𝜈 𝑏𝑏/ℓ ℓ 𝑏¯ 𝑏¯ GoSam + MiNLO NLO(EW)
𝑔𝑔→𝑍 𝐻 Powheg-Box v2 NNPDF3.0NLO(★) Pythia 8.212 AZNLO NLO+
→𝜈 𝜈 𝑏𝑏/ℓ ℓ 𝑏¯ 𝑏¯ NLL [65–69]
Top quark, mass set to 172.5 GeV
𝑡𝑡¯ Powheg-Box v2 [70] NNPDF3.0NLO Pythia 8.230 A14 [71] NNLO+NNLL [72]
𝑠-channel single top Powheg-Box v2 [73] NNPDF3.0NLO Pythia 8.230 A14 NLO [74]
𝑡-channel single top Powheg-Box v2 [73] NNPDF3.0NLO Pythia 8.230 A14 NLO [75]
𝑊 𝑡 Powheg-Box v2 [76] NNPDF3.0NLO Pythia 8.230 A14 Approximate NNLO [77]
Vector boson + jets
𝑊 →ℓ 𝜈 Sherpa 2.2.1 [46,78,79] NNPDF3.0NNLO Sherpa 2.2.1 [80,81] Default NNLO [82]
𝑍/𝛾∗→ℓ ℓ Sherpa 2.2.1 NNPDF3.0NNLO Sherpa 2.2.1 Default NNLO
𝑍→𝜈 𝜈 Sherpa 2.2.1 NNPDF3.0NNLO Sherpa 2.2.1 Default NNLO
Diboson
𝑞 𝑞→𝑊 𝑊 Sherpa 2.2.1 NNPDF3.0NNLO Sherpa 2.2.1 Default NLO(‡)
𝑞 𝑞→𝑊 𝑍 Sherpa 2.2.1 NNPDF3.0NNLO Sherpa 2.2.1 Default NLO(‡)
𝑞 𝑞→𝑍 𝑍 Sherpa 2.2.1 NNPDF3.0NNLO Sherpa 2.2.1 Default NLO(‡)
𝑔𝑔→𝑉 𝑉 Sherpa 2.2.2 NNPDF3.0NNLO Sherpa 2.2.2 Default NLO(‡)
Hadronically decaying𝜏-leptons [88,89] are required to have𝑝
T >20 GeV and |𝜂|< 2.5, to be outside of the transition region between the barrel and end-cap electromagnetic calorimeters 1.37< |𝜂|< 1.52, and to meet a ‘medium’ quality criterion [89]. Reconstructed hadronic𝜏-leptons are not directly used in the event selection, but are utilised in the missing transverse energy calculation and are also used to avoid double-counting hadronic𝜏-leptons as other objects.
Jets are reconstructed from topological clusters of calorimeter cells [90] using the anti-𝑘𝑡 algorithm [91]
with radius parameter𝑅 =0.4. Jet cleaning criteria are used to identify jets arising from non-collision backgrounds or noise in the calorimeters [92] and events containing such jets are removed. Jets are required to have𝑝
T > 20 GeV in the central region (|𝜂| < 2.5), and𝑝
T >30 GeV outside (2.5< |𝜂| <4.5) of the tracker acceptance. A jet vertex tagger [93] is used to remove jets with𝑝
T <120 GeV and|𝜂| <2.5, which are identified as not being associated to the primary vertex of the hard interaction. Simulated jets are labelled as𝑏-,𝑐- or light-flavour jets according to which hadrons with𝑝
T >5 GeV are found within a cone of sizeΔ𝑅=0.3 around their axis [94]. In the central region, jets are identified as𝑏-jets (𝑏-tagged) using a multivariate discriminant [94] (MV2), with the selection tuned to produce an average efficiency of 70%
for𝑏-jets in simulated𝑡𝑡¯events, which corresponds to light-flavour (𝑢-,𝑑-,𝑠-quark and gluon) and𝑐-jet misidentification efficiencies of 0.3% and 12.5% respectively.
Simulated𝑉+jets events are categorised depending on the two𝑏-tagged jets in the event: 𝑉+𝑙 𝑙 when they are both light-flavour jets,𝑉+𝑐𝑙 when there is one𝑐-jet and one light-flavour jet, and𝑉+HF (heavy flavour) in all other cases (which after the𝑏-tagging selection mainly consist of events with two𝑏-jets).
Simulated events containing light-flavour or𝑐-jets are not rejected based on the𝑏-tagging requirement, as the substantial MV2 rejection results in a significant statistical uncertainty on these background processes.
Instead, all events with𝑐- or light-flavour jets are weighted by the probability that these jets pass the 𝑏-tagging requirement [86]. This is an expansion compared to the previous analysis, where only jets in the𝑉 +𝑙 𝑙,𝑉 +𝑐𝑙 and𝑊 𝑊 processes were treated in this manner. Applying the same treatment to all light-flavour and𝑐-jets significantly increases the number of simulated events present after the full event selection, reducing the statistical uncertainty on the𝑉+HF (𝑡𝑡¯) background by∼ 65%−75% (∼ 25%).
Non-closure was observed in some events which have a small angular separation between the jets, but it was verified that this had a negligible impact on the result.
In addition to the standard jet energy scale calibration [95],𝑏-tagged jets receive additional flavour-specific corrections to improve their energy measurement (scale and resolution): if any muons are found within a variable cone around the jet axis, the four-momentum of the closest muon is added to that of the jet. In addition, a residual correction is applied to equalise the response to jets with leptonic or hadronic decays of heavy-flavour hadrons and to correct for resolution effects. This improves the resolution of the dijet mass by up to∼20% [86]. Alternatively, in the 2-lepton channel for events with 2 or 3 jets, a per-event kinematic likelihood uses the complete reconstruction of all final state objects to improve the estimate of the energy of the𝑏-jets. This improves the resolution of the dijet mass by up to∼40%.
The missing transverse momentum,𝑬miss
T , is reconstructed as the negative vector sum of the transverse momenta of leptons, photons, hadronically decaying𝜏-leptons and jets, and as a ‘soft term’, 𝒑miss,st
T . The soft term is calculated as the vectorial sum of the 𝑝
T of tracks matched to the primary vertex but not associated to a reconstructed lepton or jet [96]. The magnitude of 𝑬miss
T is referred to as 𝐸miss
T . The track-based missing transverse momentum, 𝒑miss
T , is calculated using only tracks reconstructed in the inner tracking detector and matched to the primary vertex.
An overlap removal procedure is applied to avoid any double-counting between leptons, including hadronically decaying𝜏-leptons, and jets.
4.2 Event selection and categorisation
Events are categorised into the 0-, 1- and 2-lepton channels depending on the number of selected electrons and muons, to target the𝑍 𝐻 →𝑣 𝑣 𝑏𝑏¯,𝑊 𝐻 →ℓ 𝜈 𝑏𝑏¯ and𝑍 𝐻 →ℓℓ 𝑏𝑏¯ signatures, respectively. In all channels, events are required to have exactly two𝑏-tagged jets, which form the Higgs boson candidate. At least one𝑏-tagged jet is required to have 𝑝
Tgreater than 45 GeV. Events are further split into 2-jet or 3-jet categories depending on whether any additional, untagged jets are present. In the 0- and 1-lepton channels, only one such jet is allowed, as the𝑡𝑡¯background is much larger in events with four jets or more. In the 2-lepton channel any number of jets is accepted in the 3-jet category, which increases the signal acceptance by 100% in the 3-jet category.
The reconstructed transverse momentum of the vector boson, 𝑝𝑉
T, corresponds to𝐸miss
T in the 0-lepton channel, the vectorial sum of𝑬miss
T and the charged-lepton transverse momentum in the 1-lepton channel,
and the transverse momentum of the 2-lepton system in the 2-lepton channel. As the signal-to-background ratio increases for large 𝑝𝑉
T values [97, 98], the analysis focuses on two high-𝑝𝑉
T regions defined as 150 GeV< 𝑝𝑉
T <250 GeV and𝑝𝑉
T > 250 GeV. In the 2-lepton channel, an additional fiducial measurement region is studied via the inclusion of a medium-𝑝𝑉
T region with 75 GeV< 𝑝𝑉
T
<150 GeV.
The event selection for the three lepton channels is outlined in Table2with details provided below.
0-lepton channel The online selection uses𝐸miss
T triggers with thresholds that varied from 70 GeV to 110 GeV between the 2015 and 2018 data-taking periods. Their efficiency was measured in𝑊+jets,𝑍+jets
and𝑡𝑡¯events using single-muon triggered data, which effectively select on𝐸miss
T as muons are not included in the trigger𝐸miss
T calculation. The resulting trigger correction factors that are applied to the simulated events range from 0.95 at the offline𝐸miss
T threshold of 150 GeV to a negligible deviation from unity at an 𝐸miss
T above 200 GeV. A requirement on the scalar sum of the transverse momenta of the jets,𝐻
T, removes a small part of the phase space (less than 1%) where the trigger efficiency depends mildly on the number of jets in the event. Events with anylooselepton are rejected. High𝐸miss
T in multi-jet events typically arises from mismeasured jets in the calorimeters. Such events are efficiently removed by requirements on the angular separation of the𝑬miss
T , jets, and 𝒑miss
T .
1-lepton channel In the electron sub-channel, events are required to satisfy a logical OR of single-electron triggers with𝑝
T thresholds that started at 24 GeV in 2015 and increased to 26 GeV in 2016–20184. The muon sub-channel uses the same𝐸miss
T triggers and correction factors as the 0-lepton channel. As these triggers effectively select on𝑝𝑉
T, given that muons are not included in the trigger𝐸miss
T calculation, they perform more efficiently than the single-muon triggers in the analysis phase space. Events are required to have exactly onetightmuon with𝑝
T> 25 GeV or onetightelectron with𝑝
T> 27 GeV and no additional looseleptons. In the electron sub-channel an additional selection of𝐸miss
T > 30 GeV is applied to reduce the background from multi-jet production.
2-lepton channel The trigger selection in the electron sub-channel is the same as in the 1-lepton channel.
In the muon sub-channel, an OR of single-muon triggers is used, with lowest𝑝
Tthresholds increasing with luminosity and ranging from 20 GeV to 26 GeV. Events must have exactly two same-flavourlooseleptons, one of which must have 𝑝
T > 27 GeV, and the invariant mass of the lepton pair must be close to the𝑍 boson mass.
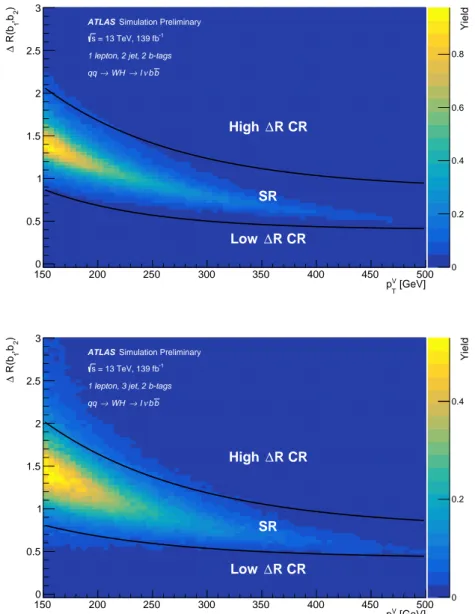
Signal and control regions The three lepton channels, two jet categories and two (0-lepton, 1-lepton) or three (2-lepton)𝑝𝑉
T regions result in a total of 14 analysis regions. Each analysis region is further split into a signal region (SR) and two control regions (CRs), resulting in a total of 42 regions. The CRs are enriched in either𝑉+HF or𝑡𝑡¯events and defined using a continuous selection on theΔ𝑅between the two𝑏-tagged jets,Δ𝑅(𝒃1,𝒃2), as a function of 𝑝𝑉
T, with the 𝑏-tagged jets labelled in decreasing 𝑝
T as𝑏
1and𝑏
2. A lower and upper requirement onΔ𝑅(𝒃1,𝒃2) is applied, creating two CRs, referred to as the low and high Δ𝑅CRs, shown in Fig.1. The highΔ𝑅selection was tuned in the 1-lepton channel to keep 95% (85%) of the signal in the SR and lowΔ𝑅CR in the two (three) jet categories, whilst the lowΔ𝑅selection was tuned to keep 90% of the diboson yield in the SR, to ensure sufficient diboson events remain when conducting the
4Additional identification and isolation requirements are applied to the trigger object to allow a low𝑝
Tthreshold to be maintained throughout Run 2.
Table 2: Summary of the event selection and categorisation in the 0-, 1- and 2-lepton channels.
Selection 0-lepton 1-lepton 2-lepton
𝑒sub-channel 𝜇sub-channel
Trigger 𝐸miss
T Single lepton 𝐸miss
T Single lepton
Leptons 0looseleptons
Exactly 1tightelectron Exactly 1tightmuon Exactly 2looseleptons 0 additionallooseleptons 0 additionallooseleptons
𝑝T >27 GeV
𝑝T >27 GeV 𝑝
T > 25 GeV Same-flavour Opposite-sign charges (𝜇 𝜇) 𝐸miss
T >150 GeV >30 GeV – –
𝑚ℓ ℓ – – – 81 GeV< 𝑚ℓ ℓ <101 GeV
Jet 𝑝
T
>20 GeV for|𝜂|<2.5
>30 GeV for 2.5< |𝜂|<4.5
𝑏-jets Exactly 2𝑏-tagged jets
Leading𝑏-tagged jet 𝑝
T >45 GeV
Jet categories Exactly 2 / Exactly 3 jets Exactly 2 / Exactly 3 jets Exactly 2 /≥3 jets
𝐻T >120 GeV (2 jets),>150 GeV (3 jets) – –
min[Δ𝜙(𝑬miss
T ,jets)] >20◦(2 jets),>30◦(3 jets) – –
Δ𝜙(𝑬miss
T ,𝒃𝒃) >120◦ – –
Δ𝜙(𝒃1,𝒃2) <140◦ – –
Δ𝜙(𝑬miss
T ,𝒑miss
T ) <90◦ – –
𝑝𝑉
T regions
– – 75 GeV< 𝑝𝑉
T <150 GeV 150 GeV< 𝑝𝑉
T <250 GeV 150 GeV< 𝑝𝑉
T <250 GeV 150 GeV< 𝑝𝑉
T <250 GeV 𝑝𝑉
T >250 GeV 𝑝𝑉
T >250 GeV 𝑝𝑉
T >250 GeV
Signal regions Δ𝑅(𝒃1,𝒃2) signal selection
8
diboson validation analysis. The same selection is applied in all three lepton channels and keeps over 93%
of the signal in the 2-jet categories and over 81% (68%) of the signal in the 3-jet (≥3-jet) categories5.
150 200 250 300 350 400 450 500
[GeV]
T
pV
0 0.5 1 1.5
2 2.5 ),b R(b∆21 3
0 0.2 0.4 0.6 0.8
Yield
Simulation Preliminary ATLAS
= 13 TeV, 139 fb-1
s
1 lepton, 2 jet, 2 b-tags b νb
→ l
→ WH qq
∆R CR Low
SR
∆R CR High
150 200 250 300 350 400 450 500
[GeV]
T
pV
0 0.5 1 1.5
2 2.5 ),b R(b∆21 3
0 0.2 0.4
Yield
Simulation Preliminary ATLAS
= 13 TeV, 139 fb-1
s
1 lepton, 3 jet, 2 b-tags b νb
→ l
→ WH qq
∆R CR Low
SR
∆R CR High
Figure 1: The signal yield distribution of theΔ𝑅between the two𝑏-tagged jets,Δ𝑅(𝒃1,𝒃2), as a function of𝑝𝑉
T in the 1-lepton channel for 2-𝑏-tag events, in the 2-jet (top) and exactly 3-jet (bottom) categories in the high-𝑝𝑉
T region.
The black lines demonstrate the continuous lower and upper selection onΔ𝑅(𝒃1,𝒃2)used to categorise the events into the signal and control regions.
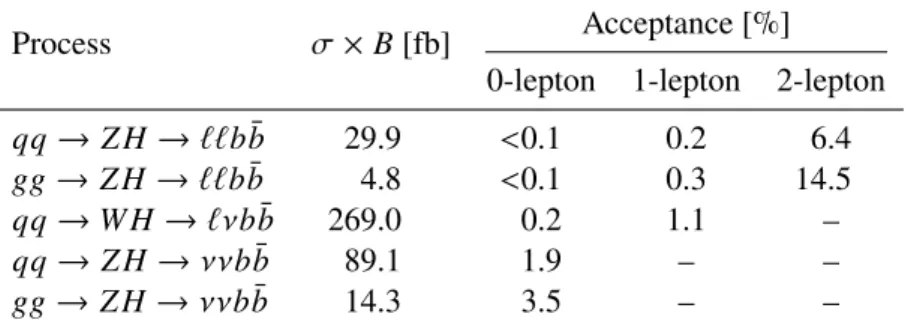
The acceptances in the three channels after the event selection, as well as the predicted cross-sections times branching fractions for(𝑊/𝑍)𝐻with𝑊 →ℓ 𝜈,𝑍 →ℓℓ,𝑍 →𝜈 𝜈, and𝐻→𝑏𝑏¯are given in Table3.
The non-negligible acceptance for the𝑞 𝑞→𝑊 𝐻process in the 0-lepton channel is mostly due to events with a hadronically decaying𝜏-lepton produced in the𝑊 decay, which are not vetoed upon and could
5Although the higher jet multiplicity categories have a lower signal efficiency than the 2-jet categories, any reduction in the sensitivity in these categories is less than 5%.
Table 3: The cross-section (𝜎) times branching fraction (𝐵) and acceptance obtained from the simulated signal samples for the three channels at
√
𝑠=13 TeV. The𝑞 𝑞- and𝑔𝑔-initiated𝑍 𝐻processes are shown separately. The branching fractions are calculated considering only decays into muons and electrons for𝑍 →ℓℓand decays into all three lepton flavours for𝑊 →ℓ 𝜈. The acceptance is calculated as the fraction of events remaining in the combined signal and control regions after the full event selection.
Process 𝜎×𝐵[fb] Acceptance [%]
0-lepton 1-lepton 2-lepton
𝑞 𝑞→𝑍 𝐻→ℓℓ 𝑏𝑏¯ 29.9 <0.1 0.2 6.4
𝑔𝑔→𝑍 𝐻→ℓℓ 𝑏𝑏¯ 4.8 <0.1 0.3 14.5
𝑞 𝑞→𝑊 𝐻 →ℓ 𝜈 𝑏𝑏¯ 269.0 0.2 1.1 –
𝑞 𝑞→𝑍 𝐻→𝜈 𝜈 𝑏𝑏¯ 89.1 1.9 – –
𝑔𝑔→𝑍 𝐻→𝜈 𝜈 𝑏𝑏¯ 14.3 3.5 – –
also be misidentified as a jet or subsequently decay to a low𝑝
Telectron or muon that fails the selection criteria. The larger acceptance for the𝑔𝑔→𝑍 𝐻process compared with𝑞 𝑞→𝑍 𝐻is due to the harder 𝑝𝑉
T spectrum of the gluon-induced process.
4.3 Simplified Template Cross Section Categories
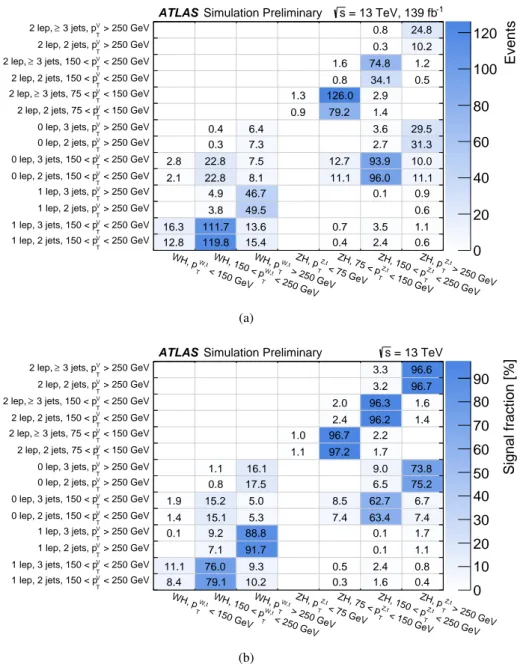
Cross-section measurements are conducted in the reduced𝑉 𝐻, 𝑉 → leptons stage-1.2 STXS region scheme [99, 100] described in Ref. [33] and summarised in Table4. In this scheme, 𝑞 𝑞 → 𝑍 𝐻 and 𝑔𝑔→𝑍 𝐻are treated as a single𝑍 𝐻process, since there is currently not enough sensitivity to distinguish them. The expected signal distributions and acceptance times efficiencies for each STXS region are estimated from the simulated signal samples by selecting events based on the generator truth information, in particular the truth𝑝𝑉
T, denoted as𝑝𝑉, t
T . The signal yield in each reconstructed-event category for each STXS region is shown in Figure2(a), with the corresponding fraction of signal events shown in Figure2(b).
The key improvement compared to the previous publication, is the addition of a reconstructed-event category with 𝑝𝑉
T
> 250 GeV. This region is more aligned with the STXS regions and significantly reduces the correlation between the STXS measurements in the two highest𝑝𝑉, t
T bins. The acceptance times efficiency for𝑊 𝐻 events with𝑝
𝑊, t
T <150 GeV or𝑍 𝐻events with𝑝
𝑍, t
T < 75 GeV is at the level of 0.1% or smaller. Given the lack of sensitivity to these regions, the signal cross-section in these regions is constrained to the SM prediction, within the theoretical uncertainties. These regions contribute only marginally to the selected event sample and the impact on the final results is negligible.
5 Multivariate discriminants
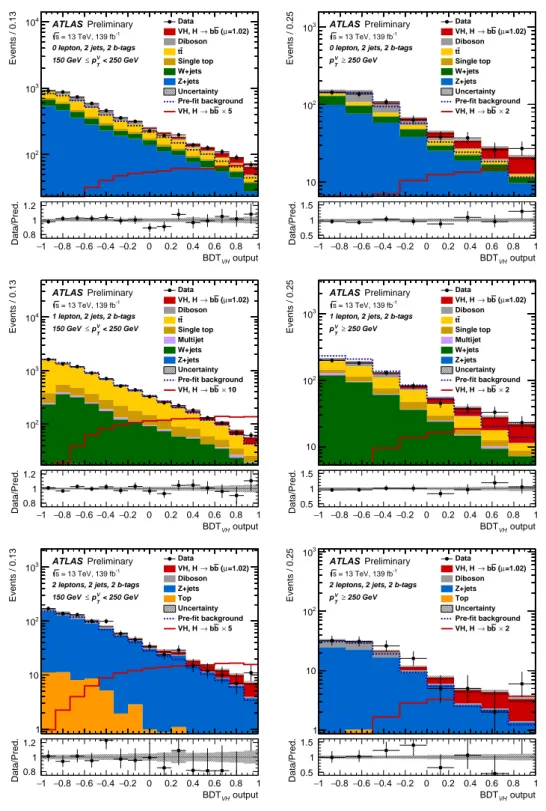
A multivariate discriminant is used to improve the sensitivity of the analysis. Two sets of boosted decision trees (BDTs) are trained using the same input variables. A nominal set, referred to as BDT𝑉 𝐻, is designed to discriminate the𝑉 𝐻signal from the background processes. A second set, referred to as BDT𝑉 𝑍, which aims to separate the𝑉 𝑍 , 𝑍 →𝑏𝑏¯ diboson process from the𝑉 𝐻signal and other background processes, is used to validate the𝑉 𝐻analysis. In each set, BDTs are trained in eight regions, obtained by merging some
Table 4: The simplified template cross-section regions used for measurements and the corresponding reconstructed analysis regions that are most sensitive. The current analysis is not sensitive to the regions𝑊 𝐻,𝑝𝑊, t
T <150 GeV and 𝑍 𝐻,𝑝𝑍, t
T <75 GeV, and their cross-sections are fixed to the SM prediction within their theoretical uncertainties. All leptonic decays of the weak gauge bosons (including𝑍 →𝜏 𝜏and𝑊→𝜏 𝜈) are considered for the STXS definition.
STXS region Corresponding reconstructed analysis regions Process 𝑝
𝑉, t
T interval Number of leptons 𝑝𝑉
T interval Number of jets
𝑊 𝐻 150–250 GeV 1 150–250 GeV 2, 3
𝑊 𝐻 > 250 GeV 1 >250 GeV 2, 3
𝑍 𝐻 75–150 GeV 2 75–150 GeV 2,≥ 3
𝑍 𝐻 150–250 GeV 0 150–250 GeV 2, 3
2 150–250 GeV 2,≥3
𝑍 𝐻 > 250 GeV 0 >250 GeV 2, 3
2 >250 GeV 2,≥3
of the 14 analysis regions. In particular, the 150 GeV < 𝑝𝑉
T < 250 GeV and 𝑝𝑉
T > 250 GeV analysis regions in each lepton channel and jet category are merged for the training, as no increase in sensitivity was found when undertaking separate trainings in the two regions. The outputs of the BDTs, evaluated in each signal region, are used as final discriminating variables.
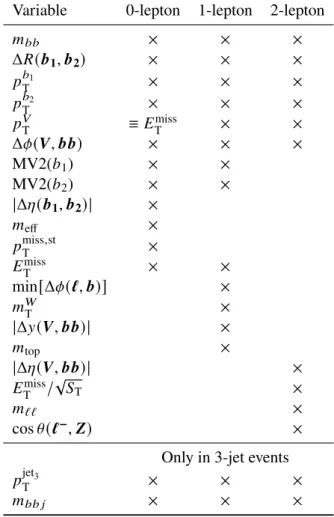
The BDT input variables used in the three lepton channels are detailed in Table5. The separation of two 𝑏-tagged jets in pseudorapidity is denoted as|Δ𝜂(𝒃1,𝒃2) |. In 3-jet events, the third jet is labelled as jet3
and the mass of the 3-jet system is denoted𝑚𝑏 𝑏 𝑗. The azimuthal angle between the vector boson and the system of the Higgs boson candidate formed from the two𝑏-tagged jets is denotedΔ𝜙(𝑽,𝒃𝒃), and their pseudorapidity separation is denotedΔ𝜂(𝑽,𝒃𝒃). In the 0-lepton channel,𝑚
effis defined as the scalar sum of the transverse momenta of all jets and the𝐸miss
T (𝑚
eff =𝐻
T+𝐸miss
T ). In the 1-lepton channel, the angle between the lepton and the closest𝑏-tagged jet in the transverse plane is denoted min(Δ𝜙(ℓ,𝒃))and two variables are used to improve the rejection of the𝑡𝑡¯background: the rapidity difference between the𝑊 and Higgs boson candidates,|Δ𝑦(𝑽,𝒃𝒃) |and, assuming that the event is𝑡𝑡¯, the reconstructed top quark mass,𝑚
top. The latter is calculated as the invariant mass of the lepton, the reconstructed neutrino and the 𝑏-tagged jet that yields the lowest mass value. For both variables, the transverse component of the neutrino momentum is identified with𝑬miss
T , and the longitudinal component is obtained by applying a𝑊-mass constraint to the lepton–neutrino system. Additionally,𝐸miss
T /√
𝑆T, where𝑆
Tis the scalar sum of transverse momenta of the charged leptons and jets in the event, is defined for use in the 2-lepton channel.
In addition to the above variables, which were all used in the previous iteration of the analysis [31], the following variables are also input to the BDTs:
• Binned MV2𝑏-tagging discriminant: The MV2 discriminant for the two𝑏-tagged jets is input to the BDT. The MV2 discriminant is grouped into two bins corresponding to efficiencies of 0–60% and 60%–70%, which are calibrated to data [94,101,102]. This variable provides additional rejection