ATLAS-CONF-2016-021 20April2016
ATLAS NOTE
ATLAS-CONF-2016-021
19th April 2016
Search for a high-mass Higgs boson decaying to a pair of W bosons in pp collisions at √
s=13 TeV with the ATLAS detector
The ATLAS Collaboration
Abstract
A search for a high-mass Higgs boson H is performed in the H → W W → `ν`ν and H → W W → `νqq decay channels using pp collision data corresponding to an integrated luminosity of 3.2 fb
−1, collected at
√ s = 13 TeV by the ATLAS detector at the Large Hadron Collider. No evidence of a high-mass Higgs boson is found. Limits on σ
H× BR(H→W W ) as a function of the Higgs boson mass m
Hare obtained in the mass range between 600 and 3000 GeV.
© 2016 CERN for the benefit of the ATLAS Collaboration.
Reproduction of this article or parts of it is allowed as specified in the CC-BY-3.0 license.
1 Introduction
A Higgs boson with a mass around 125 GeV was discovered in 2012 by the ATLAS [1] and CMS [2]
collaborations at the LHC. While the particle’s properties have been measured to be consistent so far with the Higgs boson of the Standard Model (SM) [3, 4], the search for an extended Higgs sector is still motivated in many scenarios beyond the SM [5, 6]. In particular, it is important to confirm that the unitarisation of W W scattering at high energies is achieved completely by the 125 GeV Higgs boson or whether another neutral boson contributes to this unitarisation.
This note reports the results of a search for a heavy neutral scalar decaying to two W bosons, using a dataset corresponding to an integrated luminosity of 3.2 fb
−1, recorded by the ATLAS detector in 2015 at a centre-of-mass energy (
√ s ) of 13 TeV, referred to as the Run-2 dataset. Two W W final states are analysed: H → W W → `ν`ν and H → W W → `νqq ( ` = e, µ ). A similar search was already performed by ATLAS [7] based on a data sample with an integrated luminosity of 20.3 fb
−1, produced from proton- proton collisions at the LHC, at a centre-of-mass energy of
√ s = 8 TeV, referred to as the 8 TeV Run-1 dataset. The CMS collaboration also published a Run-1 search for a high mass scalar decaying to two W bosons [8]. While no significant excess above SM predictions was observed, the increased centre-of-mass energy in 2015 makes a search in the high-mass regime competitive with the Run-1 searches despite the smaller integrated luminosity. Recent preliminary results using the H → W W → `νqq final state were reported [9] where the mass range of the search for a neutral scalar particle started at 800 GeV. In the current note, the lower edge of the mass range is extended to 600 GeV and the H → W W → `ν`ν decay channel is added.
In the H → W W → `ν`ν analysis, seperate categories for zero, one, and at least two jets are defined.
The zero- and one-jet categories are primarily sensitive to the gluon-gluon fusion (ggF) production mode whereas the high jet multiplicity category is used to select the vector boson fusion (VBF) production mode.
For this analysis, only different-flavour lepton pairs in the final state are considered. The discriminating variable used for this search is an estimatator of the WW invariant mass known as the transverse mass ( m
T) (defined in Section 5). In the H → W W → `ν qq analysis, the qq final state is reconstructed as one single large jet (“J”) since the two final-state quarks will tend to align, given the large boost of the W bosons from the massive Higgs decay. The discriminating variable used for this analysis is the reconstructed W W invariant mass, m
`νJ, where an event by event estimator is used to account for the kinematic properties of the neutrino, as described in Section 5.2. The analysis follows closely the one reported in [9], with the exception of a few changes that include the addition of another trigger selection and improved estimates of systematic uncertainties.
The search sensitivity depends on the assumed Higgs boson width. Two different hypotheses are tested:
a narrow width approximation (NWA), where the heavy Higgs width is smaller than the experimental resolution, and a large width assumption (LWA), where widths of 5%, 10%, and 15% of the heavy Higgs boson mass are considered. The choice of the width range for the heavy Higgs boson is motivated by the fact that, for several of the most relevant BSM models, widths above 15% are already excluded by the experimental data [5]. For example, the parameter space not yet excluded in two-Higgs-doublet models constrains the Higgs-like width to be < 10%. Moreover, in Higgs triplet models [6], indirect constraints from the mass of the W boson also restrict the Higgs width range significantly. For the NWA hypothesis, the interference effects between the heavy Higgs boson and the SM production of dibosons are negligible.
For the LWA hypothesis, the effects of the interference with the SM diboson continuum and the 125 GeV
Higgs boson have been neglected.
The note is organised as follows: Section 2 describes the ATLAS detector, and the data and simulated samples are listed in Section 3. The reconstructed objects are defined in Section 4, the event selections in Section 5, and the background estimation techniques in Section 6. Systematic uncertainties are discussed in Section 7 and the results are presented in Section 8. Finally, the conclusions are given in Section 9.
2 ATLAS detector
The ATLAS detector [10] is a general-purpose particle detector used to investigate a broad range of physics processes. The ATLAS detector includes an inner tracking detector (ID) surrounded by a superconducting solenoid magnet, electromagnetic and hadronic calorimeters and a muon spectrometer (MS) inside a system of toroid magnets. The ID consists of a silicon pixel detector including the insertable B-Layer [11]
which is new for Run-2, a silicon strip detector, and a straw tube tracker. It is situated inside a 2 Tesla field produced by the solenoid magnet and provides precision tracking of charged particles with pseudorapidity1 |η | < 2 . 5. The straw tube detector also provides transition radiation measurements for electron identification. The calorimeter system covers the pseudorapidity range |η| < 4 . 9. It is composed of sampling calorimeters with either liquid argon or scintillator tiles as the active medium, and lead, steel, copper, or tungsten as absorber materials. The MS provides muon identification and momentum measurements for |η | < 2 . 7. The ATLAS detector has a two-level trigger system to select events for offline analysis.
3 Data and simulation samples
The dataset used in this analysis corresponds to an integrated luminosity of 3.2 fb
−1recorded by single- electron, single-muon, and missing transverse energy ( E
missT
) triggers. The single-lepton triggers are approximately 100 (70)% efficient for selected electron (muon) candidates used in this search. The efficiency for selecting events containing a muon in the final state is increased by using a E
missT
trigger in the case of the `ν qq analysis, reaching approximately 100% after applying the kinematic selections of the analysis.
Data quality criteria were applied to ensure that events were recorded with stable beam conditions and with all relevant subdetector systems operational.
Samples of simulated signal and background events are used to optimise the event selection and estimate the signal acceptance and the background yields from various SM processes. The sample for the NWA heavy Higgs boson signal is produced with Powheg-Box 2.0 [12] interfaced with Pythia 8.186 [13], using the CTEQ6L1 parton distribution functions (PDF) set [14]. For the LWA heavy Higgs boson signal, events are simulated using MadGraph5_aMC@NLO [15] with Pythia 8.186 and the NNPDF23LO PDF set [16]. The mass of the heavy Higgs boson signals considered in this analysis spans the range between 0.6 TeV and 3 TeV. Samples have been generated in steps of 100 GeV up to 1 TeV, and in steps of 200 GeV thereafter. An extra mass point at 750 GeV was added.
1ATLAS uses a right-handed coordinate system with its origin at the nominal interaction point (IP) in the centre of the detector and thez-axis along the beam pipe. The x-axis points from the IP to the centre of the LHC ring, and the y-axis points upwards. Cylindrical coordinates(r, φ)are used in the transverse plane,φbeing the azimuthal angle around the beam pipe.
The pseudorapidity is defined in terms of the polar angleθasη =−ln tan(θ/2). Angular distance is measured in units of
∆R≡
q∆η2+∆φ2.
The main sources of SM background include events from the production of t¯ t , single-top, dibosons, Z/γ *+jets, W +jets and multiple jets (multijets). The multijets background is found to be negligible given the selection, and is therefore neglected in the following. Single-top and t t ¯ simulated events are generated with Powheg-Box 2.0 using CT10 PDF [17] interfaced to Pythia 6.428 [18] for parton showering, using the Perugia2012 [19] tune with CTEQ6L1 PDF for the underlying event description. EvtGen 1.2.0 [20]
is used for properties of the bottom and charm hadron decays. The mass of the top quark is set to m
t= 172 . 5 GeV. Diboson samples ( W W , W Z and Z Z ) are generated with Sherpa 2.1.1 [21] using the CT10 PDF. Production of W and Z bosons in association with jets is also simulated using Sherpa 2.1.1 with the CT10 PDF, where b - and c -quarks are treated as massive particles.
The effect of multiple pp interactions in the same and neighbouring bunch crossings (pile-up) is included by overlaying minimum-bias collisions, simulated with Pythia 8.186, on each generated signal and background event. The number of overlaid collisions is such that the distribution of the average number of interactions per pp bunch crossing in the simulation matches that observed in the data (on average 13 interactions per bunch crossing). The generated samples are processed through a Geant4-based detector simulation [22, 23], with the standard ATLAS reconstruction software used for collision data.
4 Object definition
Events are required to have at least one primary vertex that has a minimum of two associated tracks, each with transverse momentum p
T> 400 MeV. If there is more than one vertex reconstructed in the event that meets these conditions, the one with the largest track P
p
2T
is chosen as the primary vertex and is subsequently used for the calculation of the main physics objects in this analysis.
Electrons are selected from clusters of energy deposits in the calorimeter that match a track reconstructed in the ID. They are identified using the likelihood identification criterion described in Ref. [24]. The levels of identification are categorised as “LooseLH”, “MediumLH” and “TightLH”, which correspond to approximately 96%, 94% and 88% identification efficiencies for an electron with transverse energy ( E
T) of 100 GeV, where E
Tis the magnitude of the transverse component of the electron momentum as measured using the electromagnetic calorimeter. The electrons used in this analysis are required to pass at least the
“MediumLH” selections and be within |η | < 2 . 47, excluding the transition region between the barrel and endcaps in the LAr calorimeter (1 . 37 < | η| < 1 . 52). Muons are reconstructed by combining ID and MS tracks that have consistent trajectories and curvatures [25]. Based on the quality of the reconstruction and identification, muon candidates are defined as “Loose”, “Medium” and “Tight”, with increasing purity but decreasing efficiency. The reconstruction efficiencies for muons originating from the decay of W bosons are approximately 98%, 96% and 92%, respectively [26]. The muon candidates used in this analysis are required to pass at least the “Medium” selections and have |η | < 2 . 5.
Jets are reconstructed from three-dimensional clusters of energy deposits in the calorimeter using the anti- k
talgorithm [27] with two different distance parameters of R = 1 . 0 and R = 0 . 4, hereafter referred to as large- R jets (denoted as “ J ”) and small- R jets (denoted as “ j ”), respectively. The four momenta of the jets are calculated as the sum of the four momenta of their constituents, which are assumed to be massless.
To break the large- R jets into sub-jets intended to correspond to the quarks originating from the W
boson, the large- R jet constituents are reclustered using the k
talgorithm [28] with a distance parameter
of R
sub−jet= 0 . 2, to form a collection of sub-jets. The sub-jets are discarded if they carry less than 5 %
of the p
Tof the original jet. The constituents in the remaining sub-jets are then used to recalculate the large- R jet four-momentum, and the jet energy and mass are further calibrated to particle-level using correction factors derived from simulation [29]. The resulting “trimmed” [30] large- R jets are required to have p
T> 200 GeV, and |η | < 2 . 0. The momenta of small- R jets are also calibrated to particle-level [31].
They are required to have p
T> 20 GeV and |η | < 2 . 5 in the case of the H → W W → `νqq analysis while for the H → W W → `ν`ν analysis, the requirements are p
T> 25 GeV for |η | < 2 . 4 and p
T> 30 GeV for 2 . 4 < |η | < 4 . 5. For small- R jets with p
T< 50 GeV, the “Jet vertex tagger” (JVT) variable [32] is required to be larger than 0 . 64, where the JVT is a multivariable tagger used to suppress jets from pile-up events. In addition, small- R jets are discarded if they are within a cone of size ∆R < 0 . 2 of an electron candidate, or if they have less than three associated tracks and are within a cone of size ∆R < 0 . 2 of a muon candidate. However, if a small- R jet with three or more associated tracks is within a cone of size
∆R < 0 . 4 of a muon candidate, or any small- R jet is within 0 . 2 < ∆R < 0 . 4 of an electron candidate, the corresponding electron or muon candidate is discarded. Large- R jets are required to have an angular separation ∆R > 0 . 1 from electron candidates.
Small- R jets containing b -hadrons are identified using the MV2 b -tagging algorithm [33] with an efficiency of 85%, estimated using t¯ t simulated events. The small- R jets recognised as b -quark-induced are called b -jets in this note. The misidentification rate for selecting jets originating from a light quark or gluon is less than 1%, while it is approximately 17% for c -hadrons.
The calorimeter-based missing transverse momentum, with magnitude E
missT
, is calculated as the negative vectorial sum of the transverse momenta of all calibrated selected objects, such as electrons and jets, and is corrected to take into account the momentum of muons. Tracks with p
trackT
> 500 MeV compatible with the primary vertex and not matched to any of those objects are also included in the reconstruction [34, 35].
The H → W W → `ν`ν analysis also uses the missing momentum calculated from tracks ( p
missT
) [34, 35], defined as the negative sum of the momenta of ID tracks ( |η| < 2 . 5) that satisfy p
trackT
> 500 MeV and with the following requirements on the track impact parameter: d
0< 1 . 5 mm and d
0/σ (d
0) < 3 . The electron p
Tis more precisely measured using the calorimeter energy than the track momentum. Therefore, in the p
trackT
calculation, the p
Tof an electron track is replaced by the calorimeter cluster energy measurement.
5 Event selection
5.1 Selections for `ν`ν
The event preselection includes requirements on the leading and subleading lepton p
T: p
leadT
> 25 GeV and p
subleadT
> 15 GeV, respectively. Only different-flavour lepton final states are analysed as they provide the largest signal sensitivity. The event is required to have two oppositely-charged leptons and no additional lepton with p
T> 15 GeV in order to suppress diboson backgrounds. Both leptons must satisfy the minimal quality criteria discussed in Section 4, but in addition, they must pass the “TightLH” (“Tight” for muons) selections for 15 < p
T< 25 GeV.
In order to ensure that leptons originate from the interaction point, a requirement of |d
0|/σ
d0< 5 (3)
is imposed on the electrons (muons) and | z
0sin θ | < 0 . 5 mm is applied on both lepton types, where d
0and z
0are respectively the transverse and longitudinal impact parameter of the lepton with respect to the
primary vertex and σ
d0is the uncertainty on the measured d
0. In addition, the leptons are required to
be isolated from other tracks and calorimetric activity. This is done by applying p
T- and η -dependent
isolation criteria, based on calorimeter and track information. For muons, the calorimeter isolation is
based on topological clusters and the cone size is ∆R = 0 . 2. The muon track isolation uses a variable cone size starting at ∆R = 0 . 3 and shrinking with p
Tof the muon. For electrons, the same calorimeter isolation as the muons is used while the electron track isolation uses a variable cone size starting at ∆R = 0 . 2.
The efficiency of these isolation requirements is 90% for leptons with p
Tof 25 GeV, rising to 99% at 60 GeV.
The signal and background compositions depend strongly on the jet multiplicity of the final state ( N
jet).
For N
jet= 0, the signal originates predominantly from the ggF process, and W W events are the dominant background. For N
jet= 1, both the ggF and VBF signal processes contribute, and the large majority of the background comes from W W and top-quark events, which contribute approximately equally to the background. For N
jet≥ 2, the signal originates mostly from the VBF process and top-quark events are the dominant background. The analysis is consequently divided into N
jet= 0, 1 and ≥ 2 categories.
Since the Run-2 data are taken at a higher centre-of-mass energy, the event selection used in the Run- 1 analysis has been re-optimised by using a Boosted Decision Tree (BDT) to help select the most discriminating variables, and then choosing the selection requirements for each variable by maximising the signal significance in the presence of backgrounds. The updated selections that define the signal region (SR) for the various N
jetcategories are summarised in Table 5.1, along with the control region (CR) selections discussed in Section 6. For the N
jet≥ 2 category, the variables m
j jand ∆ y
j jcorrespond to the invariant mass and rapidity difference of the dijet system. The discriminating variable used in the search is the transverse mass defined as:
m
T= q ( E
``T
+ E
missT
)
2− |p
``T
+ E
missT
|
2, (1)
where
E
``T
= q
|p
``T
|
2+ m
2``. (2)
In the above, p
``T
and m
``are the transverse momentum and the invariant mass of the dilepton system, respectively.
The NWA and LWA signal acceptance times efficiency after all selection requirements is approximately 15% for N
jet≤ 1 and 5% for N
jet≥ 2, for the ggF process, and between 5% and 20%, respectively, for the VBF process.
Table 1: Event selection cuts for the`ν`νanalysis.
Preselection cuts: lepton different flavor, opposite charge,plead
T >25 GeV,psublead
T >15 GeV, third lepton veto,pT<15 GeV
SR WW CR Top CR
Njet=0 Njet=1 Njet≥2 Njet=0 Njet=1 Njet=1 Njet≥2
|∆η``| <1.8 <1.8 <1.8 >1.8 >1.8
Nb-jet =0 =0 =0 =1 =1
plead
T >120 GeV >120 GeV >120 GeV >30 GeV >30 GeV psublead
T >40 GeV >40 GeV >30 GeV >30 GeV pmiss
T >40 GeV >40 GeV >20 GeV >20 GeV
m`` >100 GeV >100 GeV >150 GeV >100 GeV >100 GeV >100 GeV >150 GeV
mj j >650 GeV
|∆yj j| >4.25
Table 2: Event selection cuts for the`νqqanalysis.
Preselection
one lepton with p
T> 25 GeV
one large- R jet with p
T> 200 GeV, |η | < 2 . 0 E
missT
> 100 GeV p
T(`ν ) > 200 GeV
p
T( J )/m
`νJ> 0 . 4 p
T(`ν)/m
`νJ> 0 . 4 SR
W jet substructure
W mass cut: 70 . 2 < m
W< 96 . 2 GeV no b -tagged jets in small-R jets
W +jets CR W mass cut inverted
no b -tagged jets
Top CR W mass cut
≥ 1 b -tagged small-R jet ( j
b) with ∆R( J, j
b) > 1 . 0 5.2 Selections for `ν q q
The `νqq analysis selection is summarised in Table 5.2. Events are accepted if they contain exactly one reconstructed electron or muon and E
missT
> 100 GeV. A reconstructed electron candidate must be matched to a trigger electron whereas an event containing a reconstructed muon candidate must pass the E
missT
trigger. The selected electron (muon) candidate is then required to have E
T( p
T) > 25 GeV and to satisfy the "TightLH" ("Medium") identification criterion, with the exception of electrons with p
T> 300 GeV, which are required to pass the "MediumLH" identification instead.
The impact parameter selections are the same as those used for the H → W W → `ν`ν analysis. The `νqq lepton isolation criteria are based on the scalar sum of the transverse momenta of tracks with p
T> 1 GeV within ∆R = 0 . 2 of the lepton, as well as the sum of E
Tof topological clusters in the calorimeter within
∆R = 0 . 2, excluding the E
Tfrom the lepton and corrected for the expected pile-up contribution. These isolation criteria provide an efficiency of approximately 99% for leptons from W/Z boson decays.
The leptonically-decaying W candidate is required to have p
T(`ν) > 200 GeV, where p
T(`ν) is the transverse momentum of the lepton-neutrino system. The p
Tof the neutrino from the leptonically- decaying W boson is assumed to be equal to the E
missT
. The momentum of the neutrino in the z -direction, p
z, is obtained by imposing the W boson mass constraint on the lepton and neutrino system, which leads to a quadratic equation. The p
zis defined as either the real component of the complex solution or the smaller in absolute value of the two real solutions.
The large- R jet with the highest p
Tis selected as the candidate for the hadronically-decaying W boson and must satisfy p
T> 200 GeV. A boson tagger [36] is subsequently applied to distinguish jets from hadronically-decaying W bosons which decay to two partons, from jets originating from a single quark or gluon. In this analysis, the boson tagger is configured to have 50% identification efficiency for the hadronically decaying W boson and to reject more than 90% of the background.
In the signal case, the two bosons are coming from a two-body decay of a resonance and they are mostly
reconstructed in the central part of the detector. As such, their transverse momenta are expected to be
close to half of the resonance mass ( m
`νJ), defined as the invariant mass of the `ν J system. As a result, selected events are further required to satisfy p
T( J )/m
`νJ> 0 . 4 and p
T(`ν)/m
`νJ> 0 . 4.
The signal region imposes two further requirements:
• The constituents of the large- R jet are required to be consistent with those expected from the decay products of a W boson and the jet mass is required to be within 13 GeV of the expected W mass peak (83 . 2 GeV) from simulated events.
• In order to reject top-quark backgrounds, events are rejected if there is a small- R jet that is identified as a b -jet with a separation of ∆R > 1 . 0 from the hadronically decaying W candidate.
Studies using simulated events show that the dominant backgrounds in each of the signal regions are events from t¯ t production ( ∼ 30%) and W +jets production ( ∼ 60%). The NWA and LWA signal acceptance times efficiency after all selection requirements is approximately 15% for the signals considered in this analysis.
6 Background estimation
6.1 Background estimation for `ν`ν
The major backgrounds for the `ν`ν analysis arise from top-quark and W W production processes, with additional contributions from W /Z +jets and the diboson processes W Z , Wγ , Wγ
∗, and Z Z . Since the discriminating variable used for this search is the reconstructed W W invariant mass, m
T, both the background normalisations and the shapes of the m
Tdistributions must be estimated. The m
Tshapes of the backgrounds are modelled using simulated events while the top-quark and W W background normalisations are determined from a combined fit to the events in the signal and control regions as described in Section 8. The control regions are defined by criteria similar to those used for the signal region, but with some requirements loosened or reversed to obtain signal-depleted samples, enriched in the relevant backgrounds.
The following subsections describe in more detail the methods used to estimate the most important backgrounds, namely, W W , top-quark events, and W +jets. The Drell-Yan and non- W W diboson back- grounds are small, and their predictions are obtained from simulation. The small background from the m
H' 125 GeV Higgs boson resonance and its off-shell component is included and its interference with the continuum WW background is taken into account.
6.1.1 t t ¯ and single-top background
Top-quark events can be produced as a t¯ t pair, or singly, in association with a W boson or a quark of another flavour. In this analysis, contributions from t¯ t and single-top events are estimated together, with their relative contributions determined by their predicted cross sections and by the acceptances, reconstruction efficiencies, and trigger efficiencies obtained from MC simulation.
In the N
jet= 1 and ≥ 2 categories, the normalisation of the top-quark background is determined from
control regions where the b -jet veto is reversed and the lepton selection is loosened relative to the signal
region. Details are provided in Table 5.1. The purity is 98% in both the N
jet= 1 and N
jet≥ 2
Events / 50 GeV
−1
10 1 10 102
103
104
105 Data SM (sys ⊕ stat)
Top WW W+jets Other VV
γ* Z/
H [NWA, 700 GeV]
ATLAS Preliminary
Ldt = 3.2 fb-1
∫
= 13 TeV, s
+ 1 jet Top CR ν
µ ν
→ e
→WW H
[GeV]
mT
0 200 400 600 800 1000 1200
Data / SM 0.5 1 1.5
(a) Top CRNjet=1
Events / 50 GeV
−1
10 1 10 102
103
104
105
106
Data stat)
⊕ SM (sys Top W+jets WW Other VV
γ* Z/
H [NWA, 700 GeV]
ATLAS Preliminary
Ldt = 3.2 fb-1
∫
= 13 TeV, s
2 jets Top CR
≥ ν + µ ν
→ e
→WW H
[GeV]
mT
0 200 400 600 800 1000 1200
Data / SM 0.5 1 1.5
(b) Top CRNjet≥2
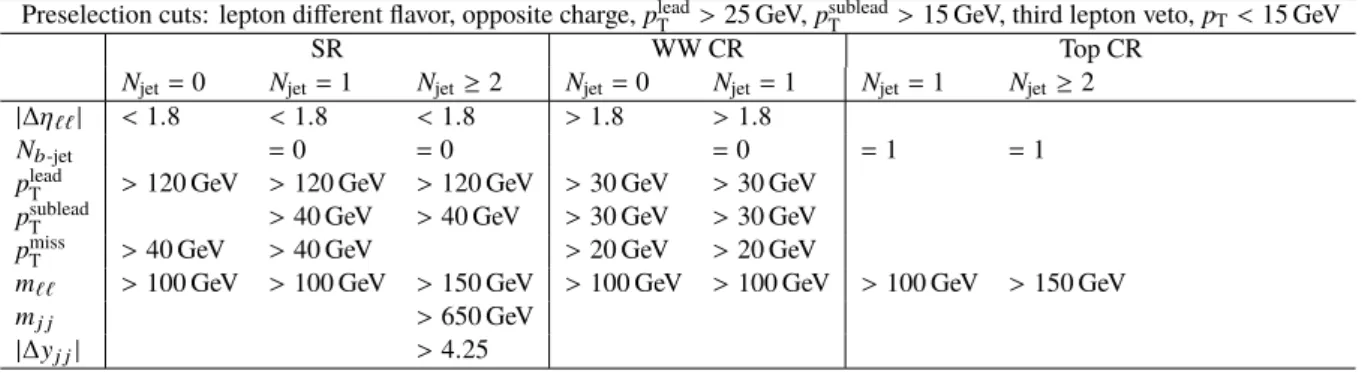
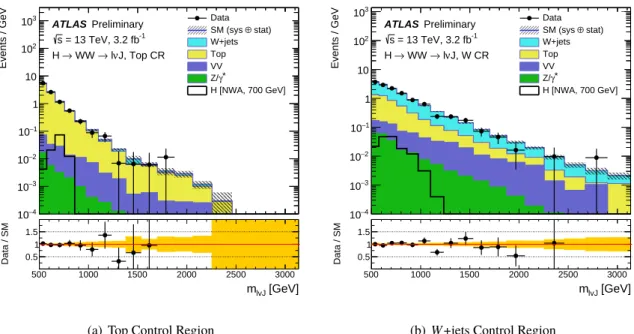
Figure 1: Transverse mass distribution in theNjet=1 (a) and≥2 (b) top-quark control regions of theH → W W →
`ν`νanalysis. In each figure, the last bin contains the overflow. The hatched band in the upper panel and the shaded band in the lower panel show the statistical and experimental systematic uncertainties added in quadrature. The W W and top normalisation factors from the final fit to data are applied. The signal event yield, shown for a mass of 700 GeV, with NWA lineshape, is the sum of the ggF contribution (scaled toσH×BR(H→W W)=1 pb) and the VBF contribution (scaled by the VBF/ggF cross section ratio obtained from the SM prediction for a Higgs boson at that mass).
categories. The normalisation factors obtained from the simultaneous fit to data are 0 . 92 ± 0 . 18 for the N
jet= 1 category and 0 . 94 ± 0 . 10 for the N
jet≥ 2 category, where the uncertainties quoted include both the statistical and systematic contributions. These factors are applied in Fig. 1, which shows the m
Tdistributions in the top control regions. The small contribution from a 700 GeV NWA Higgs signal is also shown in Fig. 1. The signal normalisation is obtained by summing the ggF contribution which is scaled to σ
H× BR ( H → W W ) = 1 pb, and the VBF contribution which is scaled by the VBF/ggF cross section ratio obtained from the SM prediction for a Higgs boson at that mass.
Because of the difficulty of defining a reasonably pure control region in the N
jet= 0 category, the top-quark background in this category is instead estimated using the jet veto survival probability (JVSP) procedure, described in detail in Ref. [37]. The top background normalisation factor obtained for this jet category is 0 . 86 ± 0 . 11, where the uncertainty includes both statistical and systematic contributions.
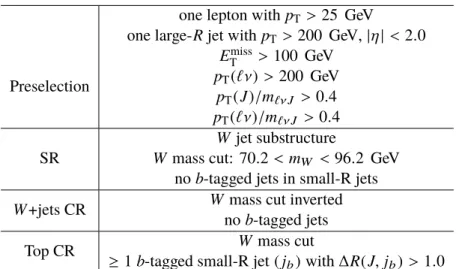
6.1.2 W W background
In the N
jet≤ 1 categories, the normalisation of the W W background is determined from the control regions previously defined in Table 5.1. The W W CRs are modified versions of the corresponding N
jet= 0 , 1 signal regions. The selection on ∆η
``is reversed with respect to the SR definitions in order to supress the resonant W W production process in favour of the non-resonant production processes. The subleading lepton p
Tcut is introduced to suppress the contribution of the W +jets background. The p
missT
cut is looser
Events / 50 GeV
−1
10 1 10 102
103
104
Data stat)
⊕ SM (sys WW Top W+jets Other VV
γ* Z/
H [NWA, 700 GeV]
ATLAS Preliminary
Ldt = 3.2 fb-1
∫
= 13 TeV, s
+ 0 jets WW CR ν
µ ν
→ e
→WW H
[GeV]
mT
0 200 400 600 800 1000 1200
Data / SM 0.5 1 1.5
(a) WW CRNjet=0
Events / 50 GeV
−1
10 1 10 102
103
104
Data stat)
⊕ SM (sys Top WW W+jets Other VV
γ* Z/
H [NWA, 700 GeV]
ATLAS Preliminary
Ldt = 3.2 fb-1
∫
= 13 TeV, s
+ 1 jet WW CR ν
µ ν
→ e
→WW H
[GeV]
mT
0 200 400 600 800 1000 1200
Data / SM 0.5 1 1.5
(b) WW CRNjet=1
Figure 2: Transverse mass distribution in theNjet=0 (a) andNjet=1 (b)W Wcontrol regions of theH → W W →
`ν`νanalysis. In each figure, the last bin contains the overflow. The hatched band in the upper panel and the shaded band in the lower panel show the statistical and experimental systematic uncertainties added in quadrature. The W W and top normalisation factors from the fit to data, as well as the top-quark normalisation factor forNjet =0, are applied. The signal event yield, shown for a mass of 700 GeV, with NWA lineshape, is the sum of the ggF contribution (scaled toσH ×BR(H → W W) = 1 pb) and the VBF contribution (scaled by the VBF/ggF cross section ratio obtained from the SM prediction for a Higgs boson at that mass).
than that of the SR but it is still useful to further suppress the W +jets background. The m
``cut is the same as for the SR. The purity of W W events in this CR is estimated to be 78% and 46% in the N
jet= 0 and N
jet= 1 categories, respectively. The main source of contamination in the W W CR comes from top-quark production, which is well controlled in the fit by the top-quark control region. The normalisation factors obtained from the simultaneous fit are 1 . 05 ± 0 . 13 for the N
jet= 0 category, and 1 . 17 ± 0 . 30 for the N
jet= 1 category, where the uncertainties quoted correspond to the full statistical and systematic contributions.
The W W prediction in the N
jet≥ 2 category is taken from simulation, as it is difficult to isolate a kinematic region with a sufficient number of W W events and a small contamination from the top-quark background.
Figure 2 shows the m
Tdistributions in the W W CRs for N
jet≤ 1. Normalisation factors obtained from the final fit to data are applied to these distributions.
6.1.3 W+jets background
The W +jets background contribution is strongly suppressed in the signal regions by the p
leadT
> 120 GeV, m
``> 100 GeV, and p
missT
> 40 GeV cuts and in the W W control regions by the p
subleadT
> 30 GeV and p
missT
> 20 GeV cuts, and finally in the top-quark control regions by the b -jet requirement.
The W + jets background contribution is estimated using a sample of events in which one of the two lepton
candidates satisfies the identification and isolation criteria used to define the signal sample (these lepton
candidates are denoted as “fully identified”), and the other lepton fails to meet these criteria and satisfies
a less restrictive selection (denoted “anti-identified”). Events in this anti-identified sample are otherwise required to satisfy all of the signal selection criteria. The dominant component of this sample arises from W + jets events, in which hadronic activity produces an object reconstructed as an anti-identified lepton.
It may be either a non-prompt lepton from the decay of a hadron containing a heavy quark, or a particle from a jet reconstructed as a lepton candidate. The purity of this sample in W + jets events is estimated to be 74% and 66% in the N
jet= 0 and N
jet= 1 categories, respectively.
The W + jets contamination in the SR is determined by scaling the number of events in the selected data sample by an extrapolation factor, which is measured in a data sample of dijets. In that sample, the expected SM contribution from electroweak processes, estimated from simulation, is subtracted. The extrapolation factor is the ratio of the number of fully identified leptons to the number of anti-identified leptons, measured in bins of anti-identified lepton p
Tand η .
6.2 Background estimation for `ν q q
The main backgrounds for the `ν qq analysis come for the production of W/Z +jets, t¯ t , and single-top events. Since this search also uses a fit based on the distribution of a discriminating variable, here the W W invariant mass m
`νJ, the shapes of the background m
`νJdistributions and their normalisations must be estimated. The quantity m
`νJis reconstructed on an event-by-event basis using the kinematic constraint m(`ν ) = m(W) described in Section 5. The m
`νJshapes of the main backgrounds are modelled using simulated events while their normalisations are determined from a combined fit to the events in the signal and control regions. The control regions are constructed by modifying the signal region selections, as shown in Table 5.2, and are described below. Since the background contribution from SM diboson production is very small, both the shape of the m
`νJdistribution and the normalisation of this background are taken from simulation.
6.2.1 Top control region
An event is considered to be in the top control region if it satisfies the selection criteria defined for the signal region except for the b -jet requirement. Instead, events are explicitly required to have at least one b -tagged small- R jet with a separation from the selected large- R jet larger than 1.0. Studies using samples of simulated events show that most events selected in the top control region are from t t ¯ production ( ∼ 86%), where the rest are from the single-top, W /Z +jets or diboson production. The value of the normalisation factor for this background, obtained from the fit as described in Section 8, is 0 . 72
+0−0..1510. The reconstructed m
`νJdistribution for data and predicted background events in the top control region is shown in Fig. 3a.
6.2.2 W+jets control region
An event is considered to be in the W +jets control region if it satisfies the selection criteria defined for the
signal region but the boson tagger is modified by inverting the jet mass requirement. The lower (higher)
mass sideband region is defined as 50 < m
J< 70 . 2 GeV ( m
J> 96 . 4 GeV). Based on simulated events,
78% of events in the lower mass sideband are from W +jets production. However in the higher mass
sideband, the fraction of events from the W +jets production is smaller (52%) while the contribution from
the t¯ t production (37%) is more significant. The value of the normalisation factor for this background,
Events / GeV
−4
10
−3
10
−2
10
−1
10 1 10 102
103 Data
stat)
⊕ SM (sys W+jets Top VV
γ* Z/
H [NWA, 700 GeV]
ATLAS Preliminary = 13 TeV, 3.2 fb-1
s
J, Top CR ν
→ l
→ WW H
[GeV]
mlvJ
500 1000 1500 2000 2500 3000
Data / SM 0.5 1 1.5
(a) Top Control Region
Events / GeV
−4
10
−3
10
−2
10
−1
10 1 10 102
103 Data
stat)
⊕ SM (sys W+jets Top VV
γ* Z/
H [NWA, 700 GeV]
ATLAS Preliminary = 13 TeV, 3.2 fb-1
s
J, W CR ν
→ l
→ WW H
[GeV]
mlvJ
500 1000 1500 2000 2500 3000
Data / SM 0.5 1 1.5
(b)W+jets Control Region
Figure 3: Reconstructedm`νJ distributions in the top control region (a) andW+jets control region (b) of the`νJ analysis. In each figure, the last bin contains the overflow. The hatched band in the upper panel and the shaded band in the lower panel show the total uncertainties after a profile likelihood background-only fit to the data. The lower panels show the ratio of data to the SM background estimate. The signal event yield, shown for a mass of 700 GeV, with NWA lineshape, is scaled toσH×BR(H→W W)=1 pb.
obtained from the fit as described in Section 8, is 0 . 74
+0−0..2517. The reconstructed m
`νJdistribution for data and predicted background events in the W +jets control region is shown in Fig. 3b.
7 Systematic uncertainties
In this section, the systematic uncertainties affecting both analyses are described first, followed by a discussion of uncertainties particular to each analysis.
7.1 Common experimental and theoretical uncertainties
The dominant sources of experimental uncertainties on the signal and background yields are the jet energy
scale and resolution, and the b -tagging efficiency. Other systematic uncertainties such as those associated
with trigger efficiencies, lepton reconstruction and identification efficiencies, lepton momentum scales
and resolutions, and missing transverse momentum are considered when evaluating possible systematic
effects on the shape or normalisation of the background estimation, as well as the shape and efficiency of
the signal yield. All experimental uncertainties are treated by varying the modelling or normalisation of
the quantity subject to a particular uncertainty and then re-running the full analysis.
The uncertainty on the integrated luminosity is 5%. It is determined, following the same methodology as that detailed in Ref. [38], from a preliminary calibration of the luminosity scale using a pair of x − y beam-separation scans performed in June 2015.
Theoretical uncertainties on the signal production cross section affect the H → W W → `ν`ν and H → W W → `ν qq analyses in the same way. These include uncertainties due to the choice of QCD renormalisation and factorisation scales, the PDF model used to evaluate the cross section and acceptance, and the underlying event and parton shower (PS) models. The PS and underlying event uncertainties are derived by shifting independently, up or down, the PYTHIA internal parameters that are associated with final state radiation (FSR) or multiple parton interactions (MPI) to study separately their influence on the selection efficiencies of the various signal mass points. The corresponding uncertainty bands, obtained after comparing both the up and down variations to the sample with the nominal parameter settings, are then propagated to the mass distribution obtained at the reconstruction level and used afterwards in the limit setting. The PDF uncertainties are determined by recalculating the weights of all events passing the full selection requirements. This reweighting takes the 52 eigenvector variations of the default PDF set as well as the MSTW2008nlo68cl and NNPDF3.0 PDF sets into account. The envelope of these variations with respect to the nominal configuration gives the final uncertainty on the selection efficiencies, following the recommendations of [17].
7.2 Systematic uncertainties for `ν`ν
The impact of the theory uncertainties (i.e. the modelling of the parton shower based processes, the choice of the PDF sets and the choice of the factorisation and renormalisation scale) on the selection efficiencies is evaluated for each signal mass point individually in the three different jet categories.
In the N
jet= 0 category, the total PDF uncertainties range from 0 . 4% for mass values below 1 . 2 TeV to approximately 2 . 5% for resonance masses between 1 . 4 and 3 . 0 TeV. The total parton shower uncertainties are of the order of 2% for a resonance mass of 1 . 6 TeV and increase to up to 3% for smaller masses and up to 4% for a resonance mass of 3 . 0 TeV. In the N
jet= 1 category, the total PDF uncertainties range from 0 . 2% to 1 . 0% over the full spectrum of resonance masses, while the total parton shower uncertainties range from 1 . 5% to 3 . 0%. In the N
jet≥ 2 category, the total PDF uncertainties vary between approximately 1 . 0% and 10% depending on the particular resonance mass, where the largest relative variations occur at lower mass points.
The QCD scale uncertainties from variations of QCD renormalisation and factorisation scales can affect significantly the predicted ggF signal contribution in exclusive jet bins and cause event migration among categories. The uncertainties used in this analysis are based on Ref. [7], and amount to 38%, 48% and 64% for the N
jet= 0 , 1 and 2 categories, respectively, for m
H= 600 GeV.
Since the ggF signal topology in the N
jet≥ 2 bin is generated with POWHEG through parton shower, a
correction of the ratio N
jet≥ 2 /N
jet= 0 is obtained comparing the ratio computed with POWHEG to the
one computed in events generated at NLO via the MadGraph5_aMC@NLO [15] generator with FxFx
merging [39]. The correction factor is found to be 2.3 corresponding to the largest variation over the range
of masses used in the analysis, and is found to be stable across different mass points. The uncertainty
on this correction factor includes the 64% QCD scale uncertainty mentioned above and an uncertainty
of 30% associated with the parton shower model. The gg → ( H
∗) → W W process, where the Higgs
is off-shell, is modelled at leading order with the Sherpa generator with a K -factor of 1.7 that is used to
account for higher order cross-section corrections with an uncertainty of 60%, following the studies in Ref. [40–43].
For the backgrounds normalised using control regions, theoretical uncertainties arise from the extrapolation from the control region to the signal region calculated using the simulation. For the W W background in the N
jet≤ 1 categories and the top-quark background in the N
jet= 1 and N
jet≥ 2 jet categories, theoretical uncertainties on the extrapolation are evaluated according to the prescription of Ref. [44]. The uncertainties include the impact of missing higher-order QCD corrections, PDF variations and MC modelling. These uncertainties range from a few percent for the 0-jet category up to 15% for 2-jet category for the W W background, and from a few percent up to 40% for the top-quark background, also increasing with the jet multiplicity.
The uncertainty on the W +jets background includes contributions from varying the subtracted electroweak component (35%), from differences in the extrapolation factor between dijet and W +jets in MC samples (30%), from the uncertainty on the heavy flavour composition of the sample (20%), and from the statistical uncertainty associated with the size of the dijet data sample used to derive the extrapolation factor (5%).
For backgrounds normalised to the theoretical prediction without use of a control region, a similar prescription is followed for the acceptance uncertainty, and uncertainties on the predicted inclusive cross section also apply.
The impact of all groups of experimental systematic uncertainties is summarised in Table 3, where the maximum change in yield for the up and down variations, in the various signal regions, is shown for each background component, summing in quadrature the components of each systematic group. The dominant systematics are related to b -tagging and small- R jets uncertainties.
Table 3: Relative impact (in %) of the experimental uncertainties on the event yields in the signal regions, for the main sources of backgrounds, in the case of the`ν`νanalysis. MC statistical uncertainties for the`ν`νanalysis are 2-5%.
Top-quark W W
N
jet= 0 N
jet= 1 N
jet≥ 2 N
jet= 0 N
jet= 1 Small-R jets energy scale & resolution 11 2.2 14.2 2 9.2 Muon id., isolation, reconstruction eff. 0.5 0.4 0.6 0.9 0.7 Electron id., isolation, reconstruction eff. 1.2 0.8 0.8 1.3 1.3
b -tagging, eff. 2.4 9.9 3.8 − < 0 . 1
b -tagging, c -quarks < 0 . 1 0.2 0.3 − < 0 . 1
b -tagging, light quarks 0.1 1.2 0.9 − < 0 . 1
7.3 Systematic uncertainties for `ν q q
The PDF uncertainties for signal samples in the `ν qq channel are of the order of 1 . 5% for a resonance
mass of 0 . 5 TeV and decrease continuously as the mass is increased. For a mass value of 1 TeV, the PDF
uncertainties are about 1%. However, for masses above 1 . 8 TeV, the PDF uncertainty is approximately
constant around a value of 0 . 2%. The total parton shower uncertainties are the largest for both the lowest
and largest investigated mass hypotheses. For a resonance mass of 0 . 5 TeV, the parton shower uncertainties
for the signal are of the order of 5%, while for resonance masses above 2 . 8 TeV, a value of 4% is obtained.
In the mass range between 0 . 7 TeV and 2 . 6 TeV, the total parton shower uncertainties for the signal vary between 1% and 3%.
The W +jets and top normalisations are left free to float in the simultaneous fit to the signal regions and control regions while the dibosons and Z +jets normalisations are constrained within their uncertainties, 11% [45] and 10% [46], respectively.
An uncertainty on the shape of the W +jets background is obtained by comparing the m
`νJshape in simulation and in data in the W +jets control region after the expected t¯ t and diboson contributions are subtracted. The ratio is fitted with a first order polynomial and the slope is found to be consistent with unity. The uncertainty on the slope (15%) is then assigned as the shape modelling uncertainty.
The data and simulation show a good agreement for events in the top control region. The uncertainty in the shape of the m
`νJdistribution from the t¯ t background is estimated by comparing a sample generated by aMC@NLO [15] interfaced with Pythia 8.186 to the nominal sample, and corresponds to an uncertainty of 18%. Additional systematic uncertainties are evaluated by comparing the nominal sample showered with Pythia 8.186 to one showered with Herwig 2.6.3 [47], giving an uncertainty of 15%. Samples of t¯ t with the factorisation and renormalisation scales doubled and halved are compared to the nominal sample, and the largest difference observed is taken as an additional uncertainty of 19%.
The large- R jet energy and mass scale uncertainties are evaluated with ATLAS Run-1 data, by comparing the ratio of calorimeter-based to track-based measurements in dijet data and simulation [36], and are validated in data using high- p
TW bosons produced in top pair events.
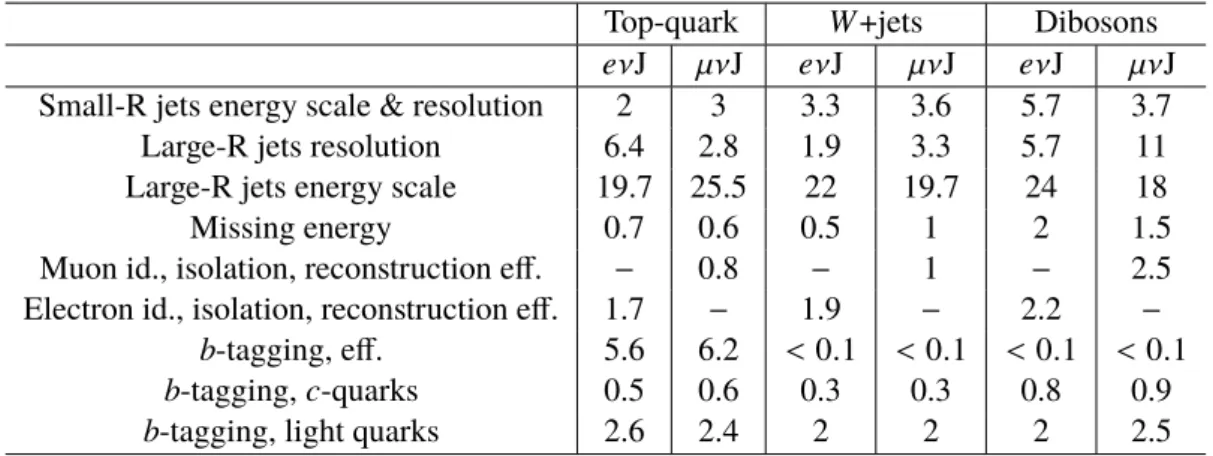
As in Table 3 for the `ν`ν analysis, the impact of all groups of experimental systematic uncertainties is shown in Table 4 for the `νqq analysis, for each background component and each lepton flavour, summing in quadrature the components of each systematic group. The dominant systematics are related to large- R jets uncertainties.
Table 4: Relative impact (in %) of the experimental uncertainties on the event yields in the signal region, for the various sources of backgrounds (t¯t,W+jets and diboson) and the different lepton flavours, in the case of the`νqq analysis. The uncertainties for the electron (eνJ) and muon (µνJ) channels are shown separately. MC statistical uncertainties for the`νqqanalysis are about 2%.
Top-quark W +jets Dibosons
eν J µν J eν J µν J eν J µν J Small-R jets energy scale & resolution 2 3 3.3 3.6 5.7 3.7
Large-R jets resolution 6.4 2.8 1.9 3.3 5.7 11
Large-R jets energy scale 19.7 25.5 22 19.7 24 18
Missing energy 0.7 0.6 0.5 1 2 1.5
Muon id., isolation, reconstruction eff. − 0.8 − 1 − 2.5 Electron id., isolation, reconstruction eff. 1.7 − 1.9 − 2.2 −
b -tagging, eff. 5.6 6.2 < 0 . 1 < 0 . 1 < 0 . 1 < 0 . 1
b -tagging, c -quarks 0.5 0.6 0.3 0.3 0.8 0.9
b -tagging, light quarks 2.6 2.4 2 2 2 2.5
8 Results
The statistical methodology used to obtain the results of the search is described in detail in Ref. [48]. A likelihood function L is defined using the distributions of the discriminant for events in the signal region of each category in the H → W W → `ν`ν analysis and in the H → W W → `νqq analysis. The likelihood is a product of Poisson functions over the bins of the discriminant in the signal regions and the total yield in each control region. Each systematic uncertainty is parametrised by a corresponding nuisance parameter θ modelled by a Gaussian function.
The modified frequentist method known as CL
s[49], combined with the asymptotic approximation [50], is used to compute 95% CL upper limits. The method uses a test statistic q
µwhich is a function of the signal strength µ , defined as the ratio of the measured σ
H× BR( H → W W) to that of the prediction.2 The test statistic is defined as:
q
µ= − 2 ln * ,
L ( µ ; ˆ θ
µ) L ( µ ˆ ; ˆ θ )
+ -
. (3)
The quantities ˆ µ and ˆ θ are values of µ and θ , respectively, that unconditionally maximise L . The numerator depends on the values ˆ θ
µthat maximise L for a given value of µ .
8.1 Results for `ν`ν
In the H → W W → `ν`ν analysis, the m
Tdistributions in the signal regions are divided into ten, six and four bins, respectively, for the N
jet= 0, 1 and ≥ 2 categories. The bins are of variable widths such as to have the same number of expected signal events in each bin.
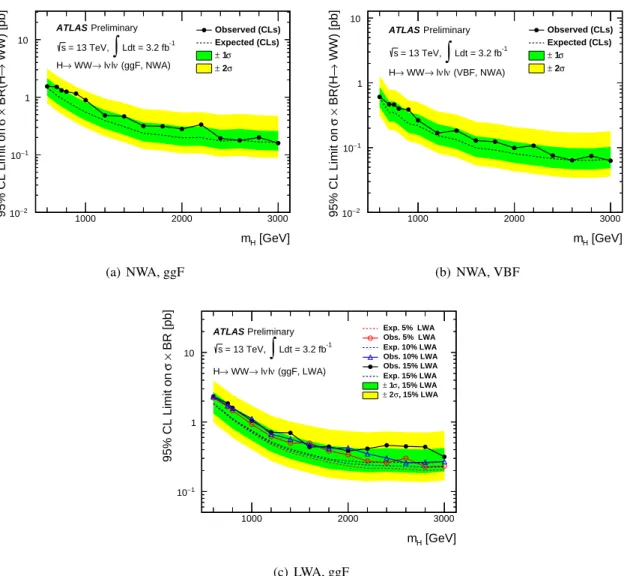
The analysis has signal regions optimised for the ggF and VBF signal production modes, but the presence of both signal processes is accounted for in all signal regions. Limits are obtained separately for ggF and VBF production for the NWA signal hypothesis, and only for ggF in the LWA case. To derive the expected limits on the ggF (VBF) production mode, the VBF (ggF) production cross section is set to zero, so that the expected limits correspond to the background-only hypothesis. To derive the observed limits on the ggF (VBF) production mode, the VBF (ggF) production cross section is treated as a nuisance parameter in the fit and profiled using a flat prior, as is used for the normalisation of backgrounds using CRs. This approach avoids making any assumption on the presence or absence of the signal in other production modes, by using the signal regions themselves to set the normalisation of the production mode not being tested.
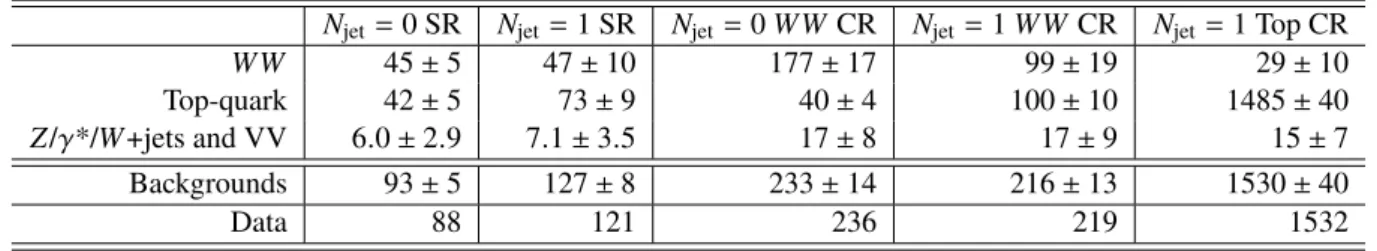
Tables 5 and 6 show the number of events predicted and observed in the signal region and the control regions, in the N
jet= 0, 1 and N
jet≥ 2 categories, respectively. These are obtained from a background- only fit to the data in the SRs and the CRs. The observed yields are consistent with the background prediction.
The m
Tdistributions of the SRs in the N
jet= 0, 1 and ≥ 2 categories are shown in Fig. 4. Figure 5 shows the 95% CL upper limits on σ
H× BR (H → W W ) as a function of m
Hfor a Higgs boson in the NWA and LWA scenarios, separately for ggF and VBF production in the NWA case, in the mass range 600 GeV ≤ m
H≤ 3 000 GeV. The main nuisance parameters affecting the limits include the jet energy
2The cross-section used to defineµ=1 for the signal process has been fixed to 1 pb, which includes the branching ratio to twoW bosons. When the ggF (VBF) signal hypothesis is tested, the VBF (ggF) signal cross section is not included in the definition ofµ.
Events / 50 GeV
−1
10 1 10 102
103
Data stat)
⊕ SM (sys WW Top W+jets Other VV
γ* Z/
H [NWA, 700 GeV]
ATLAS Preliminary
Ldt = 3.2 fb-1
∫
= 13 TeV, s
+ 0 jets SR ν
µ ν
→ e
→WW H
[GeV]
mT
0 200 400 600 800 1000 1200
Data / SM 0.5 1 1.5
Events / 50 GeV
−1
10 1 10 102
103
104
Data stat)
⊕ SM (sys Top WW W+jets Other VV
γ* Z/
H [NWA, 700 GeV]
ATLAS Preliminary
Ldt = 3.2 fb-1
∫
= 13 TeV, s
+ 1 jet SR ν µ ν
→ e
→WW H
[GeV]
mT
0 200 400 600 800 1000 1200
Data / SM 0.5 1 1.5
Events / 50 GeV
−1
10 1 10 102
Data stat)
⊕ SM (sys Top WW W+jets Other VV
γ* Z/
H [NWA, 700 GeV]
ATLAS Preliminary
Ldt = 3.2 fb-1
∫
= 13 TeV, s
2 jets SR
≥ ν + µ ν
→ e
→WW H
[GeV]
mT
0 200 400 600 800 1000 1200
Data / SM 0.5 1 1.5
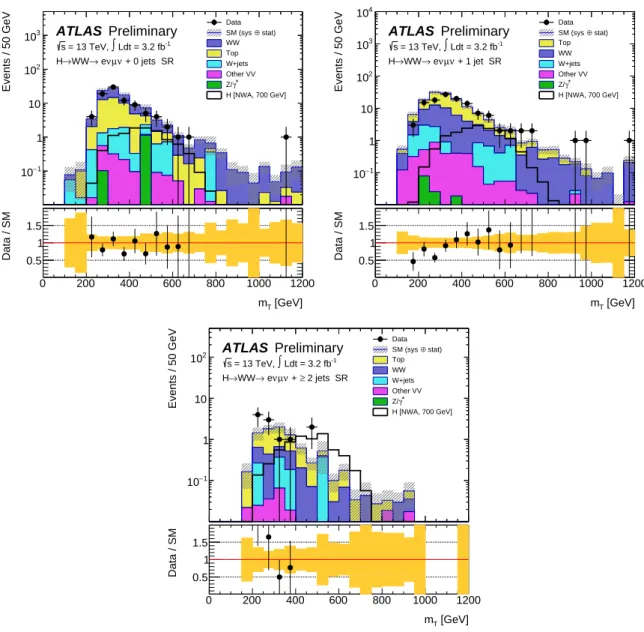
Figure 4: Transverse mass distribution in the signal region, for theNjet=0 (top left), 1 (top right) and≥2 (bottom) categories in theH → W W → `ν`νanalysis. In each figure, the last bin contains the overflow. The hatched band in the upper panel and the shaded band in the lower panels show the statistical and experimental systematic uncertainties added in quadrature on the predictions. The WW and top-quark normalisation factors from the final fit to data, as well as the top-quarkNjet=0 normalisation factor, are applied. The signal event yield, shown for a mass of 700 GeV, with NWA lineshape, is the sum of the ggF contribution (scaled toσH×BR(H→W W)=1 pb) and the VBF contribution (scaled by the VBF/ggF cross section ratio obtained from the SM prediction for a Higgs boson at that mass).
Table 5: Event yields in the signal and control regions for the`ν`ν analysis in the Njet = 0, 1 categories. The predicted background yields and uncertainties are calculated after the background-only fit to the data in the SRs and the CRs. The statistical and systematic uncertainties are combined. “VV” represents weak diboson backgrounds.
Njet=0 SR Njet=1 SR Njet=0W WCR Njet=1W WCR Njet=1 Top CR W W 45±5 47±10 177±17 99±19 29±10
Top-quark 42±5 73±9 40±4 100±10 1485±40
Z/γ*/W+jets and VV 6.0±2.9 7.1±3.5 17±8 17±9 15±7 Backgrounds 93±5 127±8 233±14 216±13 1530±40
Data 88 121 236 219 1532
Table 6: Event yields in the signal and control regions for the`ν`νanalysis in theNjet ≥2 category. The predicted background yields and uncertainties are calculated after the background-only fit to the data in the SRs and the CRs.
The statistical and systematic uncertainties are combined. “VV” represents weak diboson backgrounds.