ATLAS-CONF-2014-051 25September2014
ATLAS NOTE
ATLAS-CONF-2014-051
September 25, 2014
Search for new phenomena in events with a photon and missing transverse momentum in pp collisions at √
s = 8 TeV with the ATLAS detector
The ATLAS Collaboration
Abstract
Results of a search for new phenomena in events with an energetic photon and large missing transverse momentum with the ATLAS experiment at the LHC are reported. Data were collected in proton-proton collisions at a centre-of-mass energy of 8 TeV and corre- spond to an integrated luminosity of 20.3 fb
−1. The observed data are well described by the expected Standard Model backgrounds. The expected (observed) upper limit on the fiducial cross section for the production of
γ+ ETmissevents is 6.1 (5.3) fb at 95% CL. Exclusion limits are presented on models of new phenomena with dark matter candidates, large extra spatial dimensions, and supersymmetric quarks.
c
Copyright 2014 CERN for the benefit of the ATLAS Collaboration.
Reproduction of this article or parts of it is allowed as specified in the CC-BY-3.0 license.
1 Introduction
Events that contain a high-momentum photon and large missing transverse momentum (referred to as
γ+ETmiss) comprise a low-background sample that provides powerful sensitivity to some models of new phenomena [1, 2, 3, 4, 5, 6, 7]. Theories with large extra spatial dimensions (LED), weakly interacting massive dark matter (DM) or supersymmetric (SUSY) partners of the quarks (squarks) in a compressed mass spectrum scenario predict the production of
γ +EmissTevents in
ppcollisions beyond Standard Model (SM) expectations.
The model of LED proposed by Arkani-Hamed, Dimopoulos, and Dvali [8] (ADD) aims to solve the hierarchy problem by hypothesizing the existence of
nadditional spatial dimensions of size
R, leading toa new fundamental scale
MD, where
MPlanck2 ≈ MD2+nRn. If these dimensions are compactified, a series of massive graviton modes results. These gravitons may be invisible to the ATLAS detector, but if the graviton is produced in association with a photon, the detector signature is a
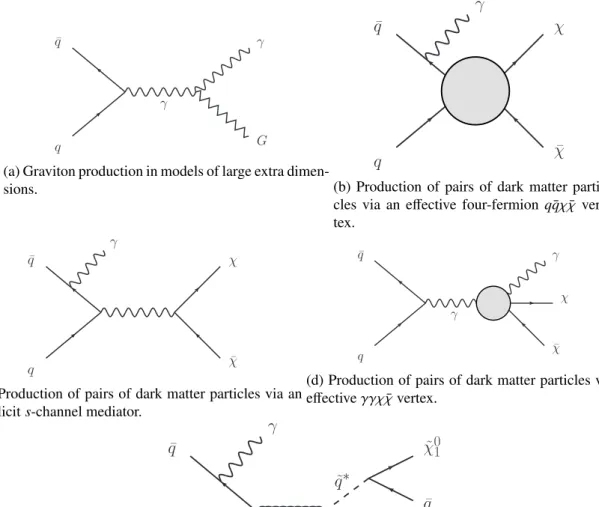
γ+EmissTevent; see Fig. 1a.
Though the presence of dark matter is well-established [9], its particle nature remains a mystery. A popular candidate is a weakly interacting massive particle (WIMP), denoted
χ, which has an interactionstrength with SM particles at the level of the weak interaction. If the WIMPs interact with quarks via a heavy mediator, they could be pair-produced in collider events. The
χχ¯ pair would be invisible, but
γ+ETmissevents can be produced via radiation of an initial-state photon in
qqχ¯
χ¯ interactions [10].
As observations so far do not provide strong constraints on the nature of the WIMPs and the theoret- ical framework to which they belong, it is particularly interesting to study model–independent effective field theories (EFT) with various forms of interaction between the WIMPs and the Standard Model particles[10]. In this framework, the mediator is e
ffectively integrated out and the production mechanism at the LHC energy scale is considered as a contact interaction; see Fig. 1b. Several effective-field-theory operators are used as a representative set following the nomenclature of Ref. [10]: D5 (vector), D8 (axial-vector) and D9 (tensor), for which the WIMP is a Dirac fermion. The interactions of SM and DM particles are described by two parameters: the DM particle mass
mχand the suppression scale (M
∗) of the heavy mediator that is integrated out. In a UV-complete theory, the contact interaction would be replaced by an explicit mediator
V; the suppression scale is linked to the mediator massmVby the rela- tion
M∗ = √gfgχ, where
gfand
gχrepresent the coupling factors of the mediator to SM particles and WIMPs, respectively. However, as the typical momentum transfer in LHC collisions can reach the scale of the microscopic interaction, it is also crucial to probe specific models that involve the explicit produc- tion of the intermediate state, as shown in Fig. 1c. In this case, the interaction is effectively described by four parameters:
mχ,
mV, the width of the mediator
Γand the overall coupling
√gfgχ. In this paper, both the EFT approach presented in Ref. [10] and a specific model with a
Z0–like mediator [11] are studied.
An alternative dark matter model hypothesizes interactions between the WIMPs and SM gauge bosons [12]. The effective coupling to different bosons is parameterized by
k1and
k2, which control the coupling to the U(1) and SU(2) gauge sectors of the SM. In this model, dark matter production pro- ceeds via
pp→γ→γχχ, requiring no initial-state radiation; see Fig. 1d. This model can also be used¯ to describe the peak observed in the Fermi-LAT data [13], allowing for a direct comparison of Fermi and ATLAS data in the same parameter space.
Supersymmetry [14, 15, 16, 17, 18, 19, 20, 21, 22] postulates the existence of a new supersymmetric partner for each SM particle, with identical gauge couplings other than the difference of half a unit of spin. Collisions of protons could result in pair-production of squarks, ˜
q, which could decay to a SMquark and a neutralino ˜
χ01; the neutralino is assumed to be stable in
R-parity conserving models [23]. Ifthe mass difference
mq˜ −mχ˜01
is small, the SM quark would have very low momentum, giving a final state of only invisible particles. Again, the radiation of a photon either from an initial-state quark or an intermediate squark would result in
γ+ETmissevents; see Fig. 1e.
The ATLAS [6] and CMS [7] collaborations have reported limits on possible models of new physics
q
¯ q
γ
γ
G
(a) Graviton production in models of large extra dimen- sions.
q
¯
q χ
¯ χ γ
(b) Production of pairs of dark matter parti- cles via an effective four-fermionqqχ¯ χ¯ ver- tex.
q
¯
q χ
¯ χ γ
(c) Production of pairs of dark matter particles via an explicits-channel mediator.
q
¯ q
γ
γ χ
¯ χ
(d) Production of pairs of dark matter particles via an effectiveγγχχ¯vertex.
q
¯ q
γ
˜ χ
01˜ χ
01q
¯ q
˜ q
˜ q
∗(e) Pair production of squarks ( ˜q), followed by decay into quarks and neutralinos ( ˜χ01).
Figure 1: Feynman diagrams depicting interactions that produce the
γ+EmissTfinal state.
based on searches for an excess in
γ+EmissTevents using
ppcollisions at
√s=
7 TeV. This paper reports the result of a search for new phenomena in
γ+ETmissevents in
ppcollisions at
√s =
8 TeV, collected by the ATLAS detector at the LHC in 2012.
2 The ATLAS detector
The ATLAS detector [24] is a multipurpose particle physics apparatus with a forward-backward symmet- ric cylindrical geometry and near 4π coverage in solid angle [25]. The inner tracking detector (ID) covers the pseudorapidity range
|η| <2.5, and consists of a silicon pixel detector, a silicon microstrip detector (SCT), and, for
|η|<2.0, a transition radiation tracker (TRT). The ID is surrounded by a thin supercon- ducting solenoid providing a 2T magnetic field. A high-granularity lead/liquid-argon (LAr) sampling electromagnetic calorimeter covers the region
|η| <3.2. An iron
/scintillator-tile calorimeter provides hadronic coverage in the range
|η|<1.7. LAr technology is also used for the hadronic calorimeters in the end-cap region 1.5
< |η| <3.2 and for both electromagnetic and hadronic measurements in the forward region up to
|η|<4.9. The muon spectrometer (MS) surrounds the calorimeters. It consists of three large air-core superconducting toroid systems, precision tracking chambers providing accurate muon tracking out to
|η|=2.7, and additional detectors for triggering in the region
|η|<2.4.
3 Event reconstruction
Photons are reconstructed from clusters of energy deposits in the electromagnetic calorimeter measured in projective towers. Clusters without matching tracks are classified as unconverted photon candidates.
A photon is considered as a converted photon candidate if it is matched to a pair of tracks that pass a TRT hits requirement and that form a vertex in the ID that is consistent with coming from a massless particle, or if it is matched to a single track passing a TRT hits requirement and that has a first hit after the innermost layer of the pixel detector [26]. The photon energy in data is corrected by applying the energy scales measured with
Z →e+e−decays and cross–checked with
J/ψ→e+e−and
Z →``γdecays [27].
Identification requirements are applied in order to separate the photon candidates from the contamination coming from
π0or other neutral hadrons decaying to two photons. The photon identification is based on the profile of the energy deposit in the first and second layer of the electromagnetic calorimeter. Photons have to pass the
tightidentification criteria of Ref. [28]. They are also required to be isolated, i.e, the energy in calorimeters in a cone of radius
∆R = p(
∆η)2+(
∆φ)2 =0.4 around the cluster barycenter not associated with the photon cluster , is required to be less than 5 GeV. This cone energy is corrected for the leakage of the photon energy outside of the central core and for the soft energy deposits from multiple
ppinteractions in the same or neighboring bunch-crossings superimposed on the hard physics process (referred to as
pileupinteractions) [29].
Electrons are reconstructed from clusters in the electromagnetic calorimeter matched to a track in the ID and criteria for their identification and calibration procedure are similar to those used for photons.
Electron candidates must satisfy the
medium++identification requirement of Ref. [27]. Muons are iden- tified either as a combined track in the MS and ID systems, or as an ID track which, once extrapolated to the MS, is associated with at least one track segment in the MS [30].
Jets are reconstructed using the anti-k
talgorithm [31, 32] with a radius parameter
R=0.4 from cal-
ibrated clusters of energy deposits in the calorimeters seeded by those with energies significantly above
the measured noise. The di
fferences in calorimeter response between electrons, photons and hadrons
are taken into account by classifying each cluster, prior to the jet reconstruction, as coming from an
electromagnetic or hadronic shower on the basis of its shape [33]. The jet energy thus accounts for elec-
tromagnetic and hadronic energy deposits at the cluster level with correction factors derived from Monte
Carlo simulation. A further correction, used to calibrate the jet energy to the scale of its constituent particles, (JES) [34, 35], is then applied. Jets are required to have transverse momentum
pT>30 GeV,
|η|<
4.5 and a distance to the closest preselected electron or photon of
∆R>0.2.
The vector momentum imbalance in the transverse plane is obtained from the negative vector sum of the reconstructed and calibrated physics objects and is denoted as missing transverse momentum,
EmissT. The symbol
ETmissis used for its magnitude. Calorimeter energy deposits are associated with a reconstructed and identified high-transverse-momentum object in a specific order: electrons with
pT>
10 GeV, photons with
pT >10 GeV and jets with
pT >20 GeV. Deposits not associated with any such objects are also taken into account in the
EmissTcalculation [36] using an energy-flow algorithm that considers calorimeter energy deposits as well as ID tracks [37].
4 Event selection
The data have been collected in
ppcollisions at
√s =
8 TeV. Events are selected using an
EmissTtrigger that requires a missing transverse momentum greater than 80 GeV [38]. Events selected using an
e/γtrigger with a threshold of
peT >120 GeV are also used in some control regions as described below [39]. Only data taken during periods where the calorimeters, ID and MS were well-functioning are considered. The data used correspond to an integrated luminosity of 20.3 fb
−1. Quality requirements are applied to photon candidates in order to reject those arising from instrumental problems. In addition, quality requirements are applied in order to remove jets arising from detector noise and out-of-time energy deposits in the calorimeter from cosmic rays or other non-collision sources [40]. Events are required to have a reconstructed primary vertex with at least 5 associated tracks.
The criteria for selecting events in the signal region (SR) are optimized to have a good acceptance for the squark model and the dark matter model with a
Z0-like mediator, as well as to suppress the background from SM processes. This signal region also provides good sensitivity to the other models described above. Events in the SR are required to have
EmissT >150 GeV, a photon with high transverse momentum
pγT >125 GeV and
|η| <1.37 not overlapped in azimuth with
EmissT:
∆φ(γ,EmissT)
>0.4.
Events with more than one jet with
pT >30 GeV or with a jet with
∆φ(jet,EmissT)
<0.4 are rejected.
Events with one jet are retained to increase the signal acceptance and reduce systematic uncertainties related to the modeling of initial-state radiation. Events are required to have no electron (
pT >7 GeV,
|η|<
2.47) and no muon (p
T >6 GeV,
|η|<2.5). The lepton veto mainly rejects
W/Zevents with charged leptons in the final state. For events satisfying these criteria, the
ETmisstrigger e
fficiency is 0.99
±0.01, as determined using events selected with the
e/γtrigger. The final data sample contains 521 events, where 319 and 202 events have zero and one jet respectively.
5 Monte Carlo simulation samples
Monte Carlo (MC) simulated samples are used to estimate the signal acceptance, the detector efficiency and to help in the estimation of the SM background contributions.
Simulated signal samples for ADD models are generated with P
ythia8 [41] version 1.7.5 using the parton distribution function (PDF) MSTW2008LO [42] and a photon
pminT =80 GeV with
MD =2.0, 2.5 TeV and the number of extra-dimension,
n, varied from 2 to 6.Simulated samples of dark matter production
pp → γ+χχ¯ via the
qqχχ¯ interaction are generated
using Madgraph5 [43] version 1.4.8.4 requiring
pγT >120 GeV, with showering and hadronisation mod-
eled by P
ythia8 version 1.6.5 using the AU2 tune [44]; the MSTW2008LO PDFs are used. Values of
mχfrom 1 to 1300 GeV are considered. In addition, simulated samples of
pp →γ+χχ¯ are produced
using the simplified model with a
Z0-like mediator [11] using the same simulation programs as for the
effective-field-theory samples. Again, a photon with
pγT >120 GeV is required at parton-level. Both vector and axial vector couplings are considered. For each value of the mediator mass
mV, two di
fferent values of the mediator width are simulated:
Γ = mV/8πand
Γ = mV/3. The lower value correspondsto a mediator that can annihilate into only one quark flavor and helicity and has unit couplings; it can be regarded as an approximate lower limit on the mediator width. A value of
Γ =mV/3 is a reasonableupper bound for a narrow resonance approximation.
Samples of
pp → γ +χχ¯ are also produced via the
γγχχ¯ interaction model [12] with a fermionic WIMP. These samples are generated with M
adgraph5 version 1.4.2 for a WIMP mass of 130 GeV and over a grid of values of
k1and
k2, which are the theoretical parameters that control the relative couplings of the WIMPs to gauge bosons.
Simulated samples of
pp→ q˜
q˜
∗γ →qqγ¯
+χ˜
01χ˜
01are generated by M
adgraph5 version 1.5.11 with showering and hadronisation modeled by Pythia6 [45] version 4.2.7 and CTEQ6L1 PDF [46], with the requirement of having one photon at parton-level with
pγT >80 GeV and
|η|<2.5. Only the first two gen- erations of squarks are considered, and they are assumed to be degenerate in mass. Signal cross sections are calculated to next-to-leading order in the strong coupling constant including the resummation of soft gluon emission at next-to-leading-logarithmic accuracy (NLO+NLL) when available [47, 48, 49, 50, 51].
The nominal cross section and the uncertainty are taken from an envelope of cross section predictions using di
fferent PDF sets and factorisation and renormalisation scales, as described in Ref. [52].
Simulated samples of
Zγand
Wγevents are generated with Sherpa version 1.4.1 [53], with parton- level requirements of
pγT >70 GeV and
pγT >80 GeV, respectively, and invariant dilepton mass
m`` >40 GeV. A sample of simulated
γ+jet events is generated with P
ythia8 version 1.6.5. The
W/Z +jet processes are also simulated using Sherpa version 1.4.1 with massive
b/c-quarks. Diboson samples aregenerated with H
erwig[54] version 6.520, the single top samples with MC@NLO [55] version 4.06 for
s-channel andWtproduction, or A
cerMC [56] version 3.8 for
t-channel production. Simulated samplesof top-quark pair production are generated by Powheg [57] version r2129. The
W/Z+jet, diboson and top samples are only used as a cross check.
H
erwigversion 6.520 is used for simulating the parton shower and fragmentation processes in combi- nation with Jimmy [58] for underlying event simulation for the MC@NLO samples, while Pythia version 6.426 is used for the P
owhegand A
cerMC samples. The proton PDFs used are CTEQ6L1 [46] for the P
ythia8 and A
cerMC samples, and CT10 [59] for the MC@NLO, S
herpaand P
owhegsamples. The ATLAS underlying event tune AUET2 [44] is used, except for the
t¯tsample that uses the new Perugia 2011C tune [60]. S
herpauses its own parton shower, fragmentation and underlying event model.
Di
ffering pileup conditions as a function of the instantaneous luminosity are taken into account by overlaying simulated minimum-bias events generated with Pythia8 onto the hard-scattering process and re-weighting them according to the distribution of the average number of interactions observed.
The simulated samples are processed either with a full ATLAS detector simulation [61] based on GEANT4 [62] or a fast simulation based on the parameterization of the response of the electromagnetic and hadronic showers in the ATLAS calorimeters [63] and a simulation of the trigger system. The results based on fast simulation are validated against fully simulated samples. The simulated events are reconstructed and analyzed with the same analysis chain as for the data, using the same trigger and event selection criteria discussed above.
6 Background estimation
The SM background to the
γ+ ETmissfinal state is dominated by the
Z(→ νν)+γprocess, where the
photon is due to initial-state radiation. Secondary contributions come from
Wγand
Zγproduction with
unidentified electrons, muons or hadronically decaying
τleptons, or
W/Zproduction where a lepton or
an associated radiated jet is misidentified as a photon. In addition, there are smaller contributions from
top-quark pair production, diboson,
γ+jet and multijet production.6.1 Zγ and Wγ backgrounds
The
ETmiss-dependence of events due to
Zγand
Wγbackgrounds is described using simulated samples, while the normalisation is obtained via a likelihood fit to observed yields in several control regions (CR), constructed to be enriched in specific backgrounds. Poisson likelihood functions are used for event counts in all regions; the systematic uncertainties described below are treated as Gaussian-distributed nuisance parameters in the likelihood function. Key ingredients of the fit are the normalisation scale factors for the
Wγand
Zγprocesses, which enable observations in the CRs to constrain background estimates in the SR. The same normalisation factor is used for
Z(νν)+γ,Z(µµ)+γand
Z(ee)+γ. Threecontrol regions are defined by inverting lepton vetoes. In the first control region, the
Wγcontribution is enhanced by requiring the presence of a muon. The second (third) control regions enhance the
Zγback- ground by requiring the presence of a pair of muons (electrons). In the muon control regions, muons are treated as invisible particles and are not considered in the
EmissTcomputation. As the signal region definition includes a veto on the presence of muons, this
EmissTdefinition ensures that the control regions have a similar
EmissTspectrum as the signal region. The same procedure is followed for electrons in the electron control regions, by adding the transverse momentum of the electrons to the missing transverse momentum vector thereby removing the electron contribution to the calculation of
EmissT. In each case, the CR lepton selection follows the same requirements as the SR lepton veto with the additional require- ments that the lepton must be associated with an isolated track and that
∆R(`, γ) >0.5. In addition, the photon pseudorapidity requirement is relaxed with respect to the SR selection:
|η|<2.37, excluding the calorimeter crack region 1.37
< |η| <1.52, to increase the number of events in the CR. For both the
Zγ-enriched control regions, the dilepton massm``is required to be greater than 50 GeV. The nor- malisation of the dominant
Zγbackground process is largely constrained by the event yields in the two
Z(→`+`−)γ control regions. The results are cross-checked using the transfer-factor technique employed in the previous ATLAS analysis of the
γ+EmissTfinal state [6]; the two methods give consistent results.
6.2 Fake photons from misidentified electrons
Contributions from processes in which an electron is misidentified as a photon are estimated by scaling yields from a sample of
e+ EmissTevents by an electron-to-photon misidentification factor. This factor is measured from mutually exclusive samples of
e+e−and
γ+ eevents. To establish a pure sample of electrons,
meeand
meγare both required to be consistent with the
Zboson mass, and the multijet background is subtracted making use of sideband estimates. The misidentification factor is parametrized as a function of
ETin three pseudorapidity bins. Similar estimates are made for the three control regions, scaling event yields from samples matching the control region requirements, but requiring an electron rather than a photon.
6.3 Fake photons from misidentified jets
Background contributions from events in which a jet is misidentified as a photon are estimated by extrap-
olating from samples of
γ+ETmissevents where the photon has failed isolation requirements. The yield
in this sample is scaled by a jet-to-photon misidentification factor, after subtraction of the contribution
from real photons. The jet-to-photon misidentification factor is measured in samples enriched in jets,
selected by inverting the photon identification criteria, and is determined from the ratio of jets that are
isolated or non-isolated. This estimation accounts also for the contribution from multijets, which can
mimic the monophoton signature if one jet is misreconstructed as a photon and one or more other jet is
badly reconstructed resulting in large fake
ETmiss. The multijet background is found to be negligible in the SR.
6.4 γ + jet background
The
γ+jet background contribution to the signal region originates if the jet is badly reconstructed and partially lost, creating fake
ETmiss. Despite the large production rate, this process is only a minor source of background as it is suppressed by the large
EmissTand the large jet-E
Tmissseparation requirements in the SR.
This background is estimated from MC simulation and is cross-checked with a data-driven estimation, which gives a result in agreement with the MC simulation, but is limited by a large statistical uncertainty.
The data-driven estimation is derived from a control region defined by requiring all the selection criteria of the SR but reversing the
∆φ(jet,EmissT) requirement, thereby selecting poorly reconstructed events in which the jet is aligned to the
EmissT. Simulated samples are used to estimate and subtract electroweak backgrounds coming from
W/Z+jet and
Z/W+γprocesses. As events with a jet with
pT>30 GeV and that are not well-separated from
EmissTare vetoed in the SR selection, the
γ+jet and multijet contribution in the SR is then estimated with a linear extrapolation of the jet
pTspectrum in this CR to the
pT <30 GeV region.
6.5 Final estimation and systematic uncertainties
Background estimates in the SR are first derived from a fit using only data from the leptons CRs, in order to assess the consistency of the observed SR yield with the background model. The values of the normalisation factors for the
Wγand
Zγbackgrounds, obtained from the fit to the CRs, are
kWγ =0.81
±0.05
±0.06 and
kZγ =0.89
±0.08
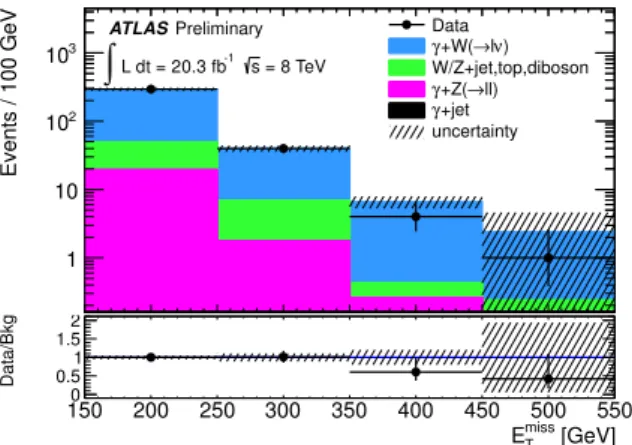
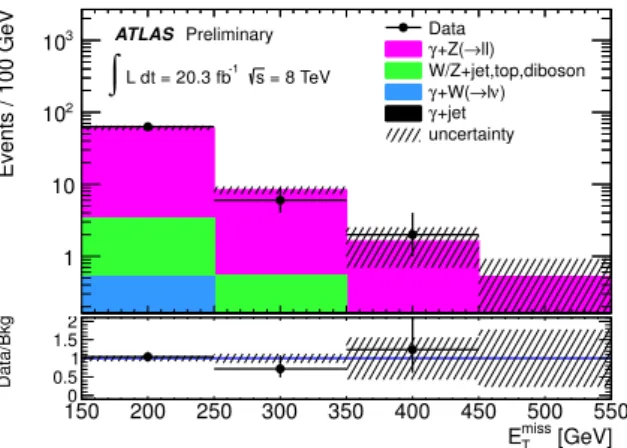
±0.08, where the uncertainties are statistical followed by systematic. Distributions of the missing transverse momentum in the three control regions are shown in Figs. 2, 3, and 4.
The techniques used for the background estimation are checked in a validation region, where events are selected with the same criteria used for the signal region, except for a lower
EmissT(110
−150 GeV) and a larger photon pseudorapidity (|η|
<2.37) to increase the statistical power. To suppress the background from
γ+jet and from fake photons to a level similar to that in the SR, a requirement on the azimuthal separation between the photon and the jet – when there is a jet in the event – is applied:
∆φ(γ,jet)
<2.7.
To minimize the contamination of signal events in this region, a requirement on the azimuthal separation between the photon and
ETmissis added:
∆φ(γ,EmissT)
<3.0. The number of events in data in this region is 307 and the estimated total background, obtained from the background-only fit to the control regions, is 272
±17(stat.)±14(syst.), resulting in an agreement between data and expectation within 2σ. Detailed results are shown in Table 1; systematic uncertainties are computed as described below for the SR.
Systematic uncertainties on the background predictions in the signal region are presented here in terms of the relative uncertainty to the total background prediction from the CR fit, which provides con- straints on many of the sources of systematic uncertainty. The dominant contribution is due to the uncer- tainty on the electron fake rate, which contributes a 4.6% relative uncertainty and to the reconstruction and identification efficiency corrections on electrons and muons applied in MC simulation, which con- tribute 1.3% and 0.7% relative uncertainty, respectively. The uncertainty in the absolute electron
/photon energy scale translates into a 0.6% relative uncertainty on the total background prediction. Uncertainties in the simulation of the electron/photon energy resolution, isolation, and identification efficiency con- tribute a relative uncertainty of 0.1% to the total predicted background. The uncertainty on the absolute jet energy scale [35] and the jet energy resolution [64] contribute 0.1% and 0.5% relative uncertainties, respectively. Uncertainties on the scale and resolution of the calorimeter energy deposits not associated with high-p
Tphysics objects a
ffect the calculation of the
EmissTand generate an uncertainty of 0.3%
on the background prediction. Uncertainties in the PDF are evaluated by following, for the CT10 and
150 200 250 300 350 400 450 500 550
Events / 100 GeV
1 10 102
103
Data ν)
→l γ+W(
W/Z+jet,top,diboson
→ll) γ+Z(
γ+jet uncertainty ATLASPreliminary
= 8 TeV s
-1 L dt = 20.3 fb
∫
[GeV]
miss
ET
150 200 250 300 350 400 450 500 550
Data/Bkg
0 0.5 1 1.5 2
Figure 2: Distribution of
ETmissin the data and for the expected background in the single-muon control region. The total background expectation has been normalized to the observed number of events in this control region. Overflows are included in the final bin. The lower part of the figure shows the ratio of event yields in the data and background expectation.
MSTW2008LO PDF sets, the PDF4LHC recommendations [65]. The Hessian method is used to obtain asymmetric uncertainties at 68% CL. To obtain also inter-PDF uncertainties, results are then compared with those obtained with the NNPDF set. Renormalisation and factorisation scale uncertainties are also taken into account by increasing and decreasing the scales used in the MC generators by a factor of two. PDF and scale uncertainties contribute 0.7% to the background prediction uncertainty. Additional sources of systematic uncertainty, due to the trigger requirement, the 2.8% relative uncertainty on the integrated luminosity, derived by following the same methodology as that detailed in Ref. [66], and the pileup modeling described above, introduce a combined relative uncertainty of less than 0.1%.
The final total background prediction systematic uncertainty of about 5%, while the statistical uncer- tainty is about 6%.
7 Results
In Table 1, the observed number of events and the SM background predictions obtained from a fit to CRs are presented. The
EmissTdistribution in the SR is shown in Fig. 5.
Table 1: Predicted event yield in the signal region (SR) and the validation region (VR) from SM back- grounds, using estimates and uncertainties obtained from a fit in the control regions. Uncertainties are statistical followed by systematic.
Process Event yield (SR) Event yield (VR)
Z(→νν)+γ389
±36
±10 153
±16
±10
W(→`ν)+γ82.5
±5.3
±3.4 67
±5
±5
W/Z+jet,
t¯t,diboson 83
±2
±28 47
±2
±14
Z(→``)+γ2.0
±0.2
±0.6 2.9
±0.3
±0.6
γ+
jet 0.4
+−0.40.32.5
+−2.54.0Total background 557
±36
±27 272
±17
±14
Data 521 307
As the 521 events observed in data are well described by the SM background prediction of 557
±36
±27, the results are interpreted in terms of exclusions on models that would produce an excess of
150 200 250 300 350 400 450 500 550
Events / 100 GeV
1 10 102
103 Dataγ+Z(→ll)
W/Z+jet,top,diboson ν)
→l γ+W(
γ+jet uncertainty ATLAS Preliminary
= 8 TeV s
-1 L dt = 20.3 fb
∫
[GeV]
miss
ET
150 200 250 300 350 400 450 500 550
Data/Bkg
0 0.5 1 1.5 2
Figure 3: Distribution of
EmissTin the data and for the expected background in the two-muon control region. The total background expectation has been normalized to the observed number of events in this control region. Overflows are included in the final bin. The lower part of the figure shows the ratio of event yields in the data and background expectation.
150 200 250 300 350 400 450 500 550
Events / 100 GeV
1 10 102
103 Dataγ+Z(→ll)
W/Z+jet,top,diboson ν)
→l γ+W(
γ+jet uncertainty ATLASPreliminary
= 8 TeV s
-1 L dt = 20.3 fb
∫
[GeV]
miss
ET
150 200 250 300 350 400 450 500 550
Data/Bkg
0 0.5 1 1.5 2
Figure 4: Distribution of
EmissTin the data and for the expected background in the two-electron control region. The total background expectation has been normalized to the observed number of events in this control region. Overflows are included in the final bin. The lower part of the figure shows the ratio of event yields in the data and background expectation.
150 200 250 300 350 400 450 500 550
Events / 100 GeV
1 10 102
103
Data ν) ν
→ γ+Z(
ν)
→l γ+W(
W/Z+jet,top,diboson
→ll) γ+Z(
γ+jet uncertainty ATLAS Preliminary
= 8 TeV s
-1 L dt = 20.3 fb
∫
[GeV]
miss
ET
150 200 250 300 350 400 450 500 550
Data/Bkg
0 0.5 1 1.5 2
Figure 5: Distribution of
EmissTin the data and for the background in the signal region predicted from the
fit in the CRs. Overflows are included in the final bin. The lower part of the figure shows the ratio of
event yields in the data and background expectation.
γ +EmissT
events. Upper bounds are calculated using a one-sided profile likelihood ratio and the CLs technique [67, 68], evaluated using the asymptotic approximation [69] on data from the CRs as well as from the SR.
The most model-independent limits provided are those on the fiducial cross section,
σ× A. Thefiducial acceptance
Ais defined using a selection identical to that defining the signal region but applied at particle level, were the particle-level
EmissTis the vector sum of invisible particle momenta. The limit on
σ×Ais derived from a limit on the visible cross section
σ×A×, whereis the fiducial reconstruction e
fficiency. A conservative estimate
=69% is computed using ADD and WIMP samples with no quark/gluon produced from the main interaction vertex. The expected (observed) upper limit on the fiducial cross section is 6.1 (5.3) fb at 95% CL and 5.1 (4.4) fb at 90% CL. These limits are applicable to any model that produces
γ+EmissTevents in the fiducial region and has similar reconstruction e
fficiency .
In the case of limits on specific models, the impact of systematic uncertainties on signal samples is evaluated separately on
A×(PDF, scale, initial-state radiation (ISR), final-state radiation (FSR)), and the cross section
σ(PDF and scale uncertainties). Only uncertainties a
ffecting
A×are included in the statistical analysis; uncertainties affecting the cross section are indicated as bands on observed limits and written as
σtheo. For the EFT and the simplified model dark matter samples, scale uncertainties are evaluated by varying the renormalisation, factorisation and matching scales in M
adgraphby a factor 0.5 and 2. For the ADD samples, the Pythia8 renormalisation and factorisation scale parameters are varied independently to 0.5 and 2.0. For these samples, the ISR and FSR signal uncertainties are assessed by varying the P
ythia8 parameters, as done in Ref. [70]. For the squark model, systematic uncertainties arising from the treatment of ISR/FSR are studied with MC data samples by varying the value of
αs, renormalisation and factorisation scales and the M
adgraph/Pythiamatching parameters. Radiation un- certainties are typically less than 10%, PDF uncertainties less than 30%, scale uncertainties less than 20%.
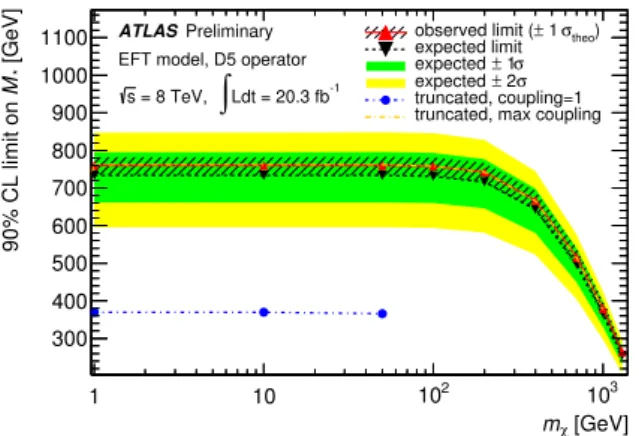
Limits on dark matter production are derived from the cross–section limits at a given WIMP mass
mχ, and expressed as 90% CL limits on the suppression scale
M∗, for the D5 (Fig. 6), D8 (Fig. 7) and D9 (Fig. 8) operators.
M∗values up to 760, 760 and 1010 GeV are excluded for the D5, D8 and D9 operators, respectively. As already mentioned, the e
ffective field theory becomes a poor approximation when the momentum transferred in the interaction,
Qtr, is comparable to the mass of the intermediate state
mV = M∗√gfgχ
[10, 71], In order to illustrate the sensitivity to the unknown ultraviolet completion of the theory, limits computed retaining only simulated events with
Qtr <mVare also shown, for a value of the coupling
√gfgχeither unity or the maximum value (4π) that allows the perturbative regime to be valid.
This procedure is referred to as
truncation. As can be seen in Figs 6, 7 and 8, the truncated limits nearlyoverlap the non-truncated limits for a 4π coupling; for unit coupling, the truncated limits are less stringent than the non-truncated limits at low
mχ, and the analysis loses sensitivity for
mχ>100 (200) GeV for the D5 and D8 (D9) operators. These lower limits on
M∗can be translated into upper limits on the nucleon-WIMP interaction cross section as a function of
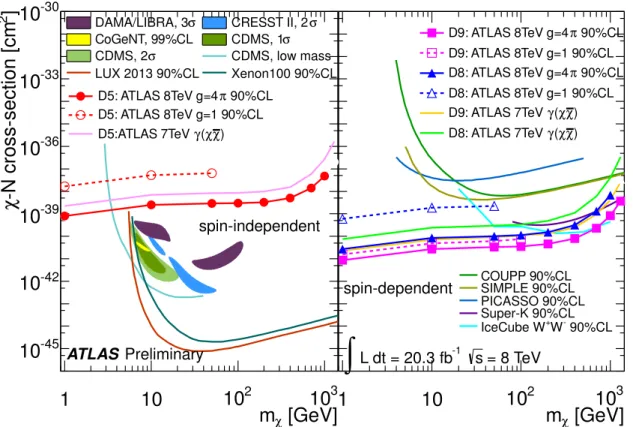
mχusing Eq. (4) and (5) of Ref. [10]. Results are shown in Fig. 9 for spin-independent (D5) and spin-dependent (D8, D9) DM-nucleon interactions and are compared to measurements from various dark matter search experiments [72, 73, 74, 75, 76, 77, 78, 79, 80, 81, 82, 83, 84]. The search for dark matter pair production in association with a
γat the LHC allows for the extension of the limits on the
χ-nucleon scattering cross section in the low mass region mχ<10 GeV where the astroparticle experiments have less sensitivity due to the very low-energy recoils such low-mass dark matter particles would induce.
Simplified models with explicit mediators are ultraviolet complete and therefore robust for all values
of
Qtr. For the simplified
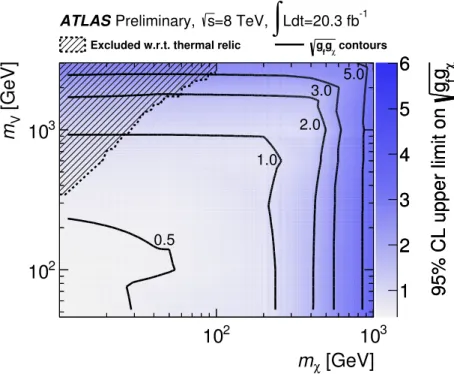
Z0-like model with vector interactions and mediator width
Γ = mV/3, Fig. 10shows the 95% CL limits on the coupling parameter
√gfgχcalculated for various values of the WIMP
and mediator particle masses, and compared to the lower limit resulting from the relic DM abundance
[GeV]
mχ
1 10 102 103
[GeV]*M90% CL limit on
300 400 500 600 700 800 900 1000
1100 observed limit (± 1 σtheo)
expected limit σ
± 1 expected
σ
± 2 expected truncated, coupling=1 truncated, max coupling ATLASPreliminary
EFT model, D5 operator = 8 TeV,
s
∫
Ldt = 20.3 fb-1Figure 6: Limits at 90% CL on the EFT suppression scale
M∗as a function of the WIMP mass
mχ, for vector operator D5. Results where EFT truncation has been applied (see text) are also shown, assuming coupling values
√gfgχ =1, 4π. For unit coupling, the analysis has no sensitivity for
mχ ≥100 GeV;
as no sample was generated between
mχ =50 GeV and
mχ =100 GeV, the limit is only shown up to
mχ=50 GeV. For 4π coupling, the truncated limit nearly overlaps the non-truncated limit.
[GeV]
mχ
1 10 102 103
[GeV]*M90% CL limit on
200 400 600 800 1000
theo) σ
± 1 observed limit ( expected limit
σ
± 1 expected
σ
± 2 expected truncated, coupling=1 truncated, max coupling ATLASPreliminary
EFT model, D8 operator = 8 TeV,
s
∫
Ldt = 20.3 fb-1Figure 7: Limits at 90% CL on the EFT suppression scale
M∗as a function of the WIMP mass
mχ, for axial-vector operator D8. Results where EFT truncation has been applied (see text) are also shown, assuming coupling values
√gfgχ=
1, 4π. For unit coupling, the analysis has no sensitivity for
mχ≥100
GeV; as no sample was generated between
mχ=50 GeV and
mχ=100 GeV, the limit is only shown up
to
mχ=50 GeV. For 4π coupling, the truncated limit nearly overlaps the non-truncated limit.
[GeV]
mχ
1 10 102 103
[GeV]*M90% CL limit on
400 600 800 1000 1200 1400
theo) σ
± 1 observed limit ( expected limit
σ
± 1 expected
σ
± 2 expected truncated, coupling=1 truncated, max coupling ATLASPreliminary
EFT model, D9 operator = 8 TeV,
s
∫
Ldt = 20.3 fb-1Figure 8: Limits at 90% CL on the EFT suppression scale
M∗as a function of the WIMP mass
mχ, for tensor operator D9. Results where EFT truncation has been applied (see text) are also shown, assuming coupling values
√gfgχ =1, 4π. For unit coupling, the analysis has no sensitivity for
mχ >200 GeV;
as no sample was generated between
mχ =100 GeV and
mχ =200 GeV, the limit is only shown up to
mχ=100 GeV. For 4π coupling, the truncated limit nearly overlaps the non-truncated limit.
[GeV]
m
χ1 10 10
210
310
-4510
-4210
-3910
-3610
-3310
-30COUPP 90%CL SIMPLE 90%CL PICASSO 90%CL Super-K 90%CL
90%CL W-
IceCube W+
90%CL π D9: ATLAS 8TeV g=4 D9: ATLAS 8TeV g=1 90%CL
90%CL π D8: ATLAS 8TeV g=4 D8: ATLAS 8TeV g=1 90%CL
χ) χ γ( D9: ATLAS 7TeV
χ) χ γ( D8: ATLAS 7TeV
= 8 TeV s
-1 L dt = 20.3 fb
∫
spin-dependent
[GeV]
m
χ1 10 10
210
3]
2-N cross-section [cm χ
10
-4510
-4210
-3910
-3610
-3310
-3090%CL π D5: ATLAS 8TeV g=4 D5: ATLAS 8TeV g=1 90%CL
χ) χ γ( D5:ATLAS 7TeV
σ
DAMA/LIBRA, 3 CRESST II, 2σ CoGeNT, 99%CL CDMS, 1σ
σ
CDMS, 2 CDMS, low mass LUX 2013 90%CL Xenon100 90%CL
spin-independent
ATLAS Preliminary
Figure 9: Upper limits at 90% CL on the nucleon-WIMP cross section as a function of
mχfor spin-
independent (left) and spin-dependent (right) interactions, for the cases that the coupling is unity or that
the coupling is the maximum (g
=4π) allowed to keep the model within its perturbative regime. The
truncation procedure is applied for both cases. The results obtained from ATLAS with 7 TeV data for
the same channel are shown for comparison. Also shown are results from various dark matter search
experiments [72, 73, 74, 75, 76, 77, 78, 79, 80, 81, 82, 83, 84].
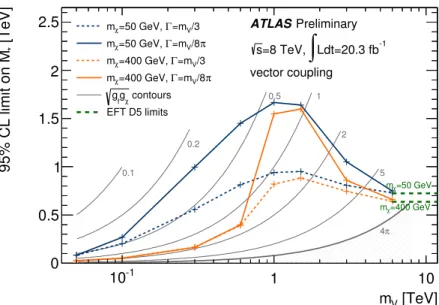
[85]. Fig. 11 and 12 show, for vector and axial–vector interactions and different values of the WIMP mass, the corresponding 95% CL limits on the suppression scale
M∗as a function of
mV. One can note how, when the mediator mass is greater than the LHC reach, the EFT model provides a good approximation of the simplified model with
M∗=mV/√gfgχ. The truncation procedure is applied when computing the EFT limits; these limits are always more conservative than those from the simplified model as long as
mVis greater than or equal to the value used for EFT truncation. This can be seen by comparing the
M∗limits derived from the EFT approach using validity truncation (Figs. 6 and 7), recalling
mV = √gfgχM∗.
χ
g
fg 95% CL upper limit on
1 2 3 4 5 6
[GeV]
m
χ10
210
3[GeV]
Vm
10
210
3χ
g
fg 95% CL upper limit on
1 2 3 4 5 6
Excluded w.r.t. thermal relic gfgχ contours
Ldt=20.3 fb-1
∫
=8 TeV, s
Preliminary, ATLAS
0.5
1.0 2.0
3.0 5.0
Figure 10: 95% CL limits on the WIMP simplified model coupling parameter with vector coupling and mediator width
Γ =mV/3, as a function of the WIMP (mχ) and the mediator particle masses (m
V). Solid lines indicate contours in the coupling parameter. In the region above the dashed line, the lower limits on the coupling resulting from the relic abundance of DM are higher than the upper limits found in this analysis.
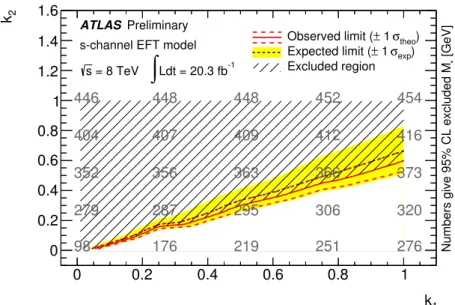
In the case of the model of
γγχχ¯ interactions with an
s-channel SM gauge boson, inspired by theline in the Fermi-LAT
γ-ray spectrum, limits are placed on the effective mass scale
M∗in the (k
1,k
2) parameter plane; see Fig. 13. The exclusion line is drawn by considering the value of
M∗needed to generate the
χχ¯
→γγannihilation rate consistent with the observed Fermi-LAT
γ-ray line. This analysisis able to constrain e
ffectively the parameter space of the theory compatible with the Fermi-LAT peak.
In the ADD model of LED, limits on
MDfor various values of
nare provided in Fig. 14. Results incorporating truncation are also shown, for which the graviton production cross section is suppressed by a factor
MD4/sˆ
2, where
√ˆ
s
is the parton-parton centre-of-mass energy. The analysis is able to exclude
MDup to 2.17 TeV, depending on the number of extra dimensions. The e
ffect of truncation is larger for higher
nas the graviton mass distribution is pushed to higher values.
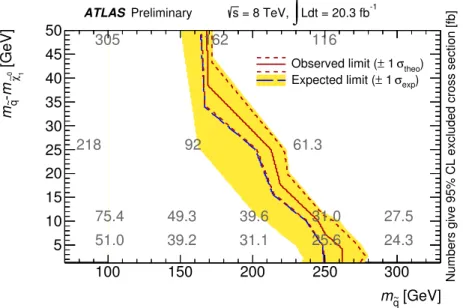
In the case of squark pair production, limits are presented on
σ(pp→q˜
q˜
∗γ) as a function ofmq˜and
mq˜ −mχ˜01
; see Fig. 15. The limit is presented down to
mq˜−mχ˜01 = mc
, below which the decay of the
˜
c→cχ
˜
01is offshell and not considered here. For very compressed spectra, the analysis is able to exclude
[TeV]
mV
10-1 1 10
[TeV] *95% CL limit on M
0 0.5 1 1.5 2 2.5
0.1
0.2
0.5 1
2
5
4π
Preliminary ATLAS
Ldt=20.3 fb-1
∫
=8 TeV, s
vector coupling
=50 GeV mχ
=400 GeV mχ V/3
Γ=m
=50 GeV, mχ
π
V/8 Γ=m
=50 GeV, mχ
V/3 Γ=m
=400 GeV, mχ
π
V/8 Γ=m
=400 GeV, mχ
contours gχ
gf
EFT D5 limits
Figure 11: 95% observed limits on the EFT suppression scale
M∗as a function of the mediator mass
mV, for a
Z0–like mediator with vector interactions. For a dark matter mass
mχof 50 or 400 GeV, results are shown for different values of the mediator total decay width
Γand compared to the EFT observed limit results for a D5 (vector) interaction.
M∗vs
mVcontours for a total coupling
√gfgχ =
0.1, 0.2, 0.5, 1, 2, 5, 4π are also shown. At high
mV, the model approaches that of a contact interaction, which can be seen to agree with the corresponding limits from the D5 operator shown as a dashed line.
[TeV]
mV
10-1 1 10
[TeV] *95% CL limit on M
0 0.5 1 1.5 2 2.5
0.1
0.2
0.5 1
2
5
4π
Preliminary ATLAS
Ldt=20.3 fb-1
∫
=8 TeV, s
axial-vector coupling
=50 GeV mχ
=400 GeV mχ V/3
Γ=m
=50 GeV, mχ
π
V/8 Γ=m
=50 GeV, mχ
V/3 Γ=m
=400 GeV, mχ
π
V/8 Γ=m
=400 GeV, mχ
contours gχ
gf
EFT D8 limits
Figure 12: 95% observed limits on the EFT suppression scale
M∗as a function of the mediator mass
mV, for a
Z0–like mediator with axial-vector interactions. For a dark matter mass
mχof 50 or 400 GeV, results are shown for different values of the mediator total decay width
Γand compared to the EFT observed limit results for a D8 (axial-vector) interaction.
M∗vs
mVcontours for a total coupling
√gfgχ =
0.1, 0.2, 0.5, 1, 2, 5, 4π are also shown. At high
mV, the model approaches that of a contact
interaction, which can be seen to agree with the corresponding limits from the D8 operator shown as a
dashed line.
k1
0 0.2 0.4 0.6 0.8 1
2k
0 0.2 0.4 0.6 0.8 1 1.2 1.4 1.6
98 279 352 404 446
176 287 356 407 448
219 295 363 409 448
251 306 366 412 452
276 320 373 416 454
ATLAS Preliminary s-channel EFT model
= 8 TeV
s
∫
Ldt = 20.3 fb-1theo) 1 σ Observed limit (±
exp) 1 σ Expected limit (±
Excluded region [GeV]Numbers give 95% CL excluded M *
Figure 13: 95% CL limits on the e
ffective mass scale
M∗in the (k
2,k
1) parameters plane for the
s-channelEFT model inspired by Fermi-LAT for
mχ =130 GeV. The
k1,k2parameters control the couplings of the dark matter particles to electroweak bosons as defined in Ref. [12]. The exclusion line is drawn by considering the proper annihilation rate to give the observed yield in the Fermi-LAT
γ-ray line. Theupper part of the plane is excluded.
Number of Extra Dimensions
2 3 4 5 6
lower limit [TeV]DM
1.8 2 2.2 2.4 2.6
expected limit 1σ expected ±
2σ expected ±
theo) 1 σ observed limit (± observed truncated limit ATLAS Preliminary
ADD model, 95% CL limit = 8 TeV,
s
∫
Ldt = 20.3 fb-1Figure 14: Lower limits at 95% CL on the mass scale
MDin the ADD models of large extra dimensions,
for several values of
n, the number of extra dimensions. The expected and observed limits are shown,along with the limit obtained after applying truncation.
squark masses up to 250 GeV. Some models of first and second generation squark pair production are also explored in Ref. [86]; the result presented here is complementary in that it probes very compressed spectra. Due to the reduced hadronic activity, the acceptance of the
γ+ETmissselection indeed increases as the mass difference between the squarks and the neutralino decreases, leading to an increased sensitivity to squark mass with decreasing mass di
fference.
[GeV]
q~
m
100 150 200 250 300
[GeV]0 1χ∼m-q~m
5 10 15 20 25 30 35 40 45 50
51.0 75.4
39.2 49.3
31.1 39.6
25.6 31.0
24.3 27.5
218 92 61.3
305 162 116
ATLAS Preliminary s = 8 TeV,
∫
Ldt = 20.3 fb-1theo) σ
± 1 Observed limit (
exp) 1 σ Expected limit (±
Numbers give 95% CL excluded cross section [fb]
Figure 15: Upper limits at 95% CL on the cross section for the compressed squark model, as a function of
mq˜and
mq˜−mχ˜01
, in the compressed region
mq˜ −mχ˜01 <
50 GeV. The observed (solid line) and expected (dashed line) upper limits from this analysis are shown; the upper limit on the cross-section (in fb) is indicated for each model point.
8 Summary
Results are reported for the search for new phenomena in events with a high transverse-momentum photon and large missing transverse momentum in
ppcollisions at
√s =