ATLAS NOTE
ATLAS-CONF-2014-017
April 1, 2014
Search for high-mass states with one lepton plus missing transverse momentum in pp collisions at √
s = 8 TeV with the ATLAS detector
The ATLAS Collaboration
Abstract
A search is presented for new high-mass states decaying to a lepton (electron or muon) plus missing transverse momentum using 20.3 fb
−1of proton-proton collision data at
√s
=8 TeV recorded with the ATLAS experiment at the Large Hadron Collider. No significant excess beyond Standard Model expectations is observed. A W
0with Sequential Standard Model couplings is excluded at the 95% credibility level for masses up to 3.27 TeV. Excited chiral bosons (W
∗) with equivalent coupling strengths are excluded for masses up to 3.17 TeV.
Limits on the mass scale M
∗of the unknown mediating interaction for dark matter pair production in association with a leptonically decaying W are also set.
c
Copyright 2014 CERN for the benefit of the ATLAS Collaboration.
Reproduction of this article or parts of it is allowed as specified in the CC-BY-3.0 license.
1 Introduction
High-energy collisions at CERN’s Large Hadron Collider (LHC) provide new opportunities to search for physics beyond the Standard Model (SM) of strong and electroweak interactions. One extension common to many models is the existence of additional heavy gauge bosons, of which the charged are commonly denoted W
0. Such particles are most easily searched for in their decay to a charged lepton (either electron or muon) and a neutrino.
This note describes such a search performed using 8 TeV pp collision data collected with the ATLAS detector during 2012 corresponding to a total integrated luminosity of 20.3 fb
−1. The data are used to extend current limits [1–6]. Limits are evaluated in the context of the Sequential Standard Model (SSM), the extended gauge model of ref. [7] with the W
0coupling to WZ set to zero. In this model, the W
0has the same couplings to fermions as the SM W boson and a width that increases linearly with the W
0mass.
A search is also performed for the charged partners, denoted W
∗, of the chiral boson excitations described in ref. [8] with theoretical motivation in ref. [9]. The anomalous (magnetic-moment type) cou- pling of the W
∗leads to kinematic distributions significantly di
fferent from those of the W
0as demon- strated in the previous ATLAS search [6] for this resonance that was performed using 7 TeV pp collision data collected in 2011 corresponding to an integrated luminosity of 4.7 fb
−1. The search region is ex- panded to higher masses and the limits are considerably improved in the region covered by the previous search. A lower mass limit is evaluated by fixing the W
∗coupling strengths to give the same partial decay widths as the SSM W
0.
The analysis presented here identifies event candidates in the electron and muon channels, sets sepa- rate limits for W
0/W∗→eν and W
0/W∗ →µν, and then combines these assuming a common branchingfraction for the two final states. The kinematic variable used to identify the W
0/W∗is the transverse mass
m
T= q2 p
TE
missT(1
−cos
ϕ`ν), (1)
where p
Tis the lepton transverse momentum, E
Tmissis the magnitude of the missing transverse momentum vector (missing E
T), and
ϕ`νis the angle between the p
Tand missing E
Tvectors. Here and in the following, transverse refers to the plane perpendicular to the colliding beams, longitudinal means parallel to the beams,
θand
ϕare the polar and azimuthal angles with respect to the longitudinal direction, and pseudorapidity is defined as
η=−ln(tan(θ/2)).
The signal region for this analysis (defined in more detail later) is restricted to high m
Twhich results in a large uncertainty on the signal e
fficiency for large W
0masses. At the highest masses probed by this analysis, a significant fraction of the signal production is far off-shell, with m
`νm
W0, where m
W0is the pole mass of the W
0. The uncertainty for the mass-dependent higher order QCD signal cross- section corrections at high mass is dominated by the parton distribution functions (PDFs) uncertainty and increases quickly for masses above about 2 TeV. The combination of these two effects results in a larger uncertainty in the signal region than for the full phase space, and therefore, a large uncertainty on the signal e
fficiency for large W
0masses. The uncertainty on the signal selection e
fficiency is reduced by restricting to a phase space region with large invariant mass. In this note, limits are set on the signal cross- section times branching fraction (σB), defined as the product of total cross-section multiplied by the W
0/W∗→`νbranching fraction and then multiplied by the acceptance of events passing the requirement m
`ν>0.4 m
W0/W∗at the generator level. This phase space region encloses the signal region for the highest W
0masses in such a way that the contribution in the signal region from events failing the requirement is marginal.
The data are also used to set limits on the production of weakly interacting candidate dark matter (DM) particles. They can be pair produced at the LHC, pp
→ χχ, via a new intermediate state. Since¯ DM particles do not interact with the detector material, their production leads to only an E
missTsignature.
However, these events can be detected if there is associated initial-state radiation of a SM particle [10].
Both Tevatron and LHC collaborations have reported limits on the cross-section of pp
→χχ¯
+X where X is a hadronic jet [10–12], a photon [13, 14] or hadronically decaying W or Z boson [15]. Previous LHC results have also been reinterpreted to set limits on the scenarios where X is a leptonically decaying W [16] or Z [17, 18] boson, and this analysis is the first direct ATLAS search for the former case. Limits are reported in terms of the mass scale M
∗of a new SM-DM interaction expressed in an e
ffective field theory as a four-point contact interaction [19–27]. As discussed in the literature, e.g. refs. [28, 29], the effective field theory formalism becomes a poor approximation if the mass of the intermediate state is below the momentum transferred in the interaction, but this issue is not addressed any further in this note. Four effective operators are used as a representative set based on the definitions in ref. [23]: D1 scalar, D5 vector (both constructive and destructive interference cases, prior denoted as D5c and latter D5d) and D9 tensor. In contrast to the W
0/W∗limits, limits on M
∗in the DM search are evaluated using the total cross-section times branching fraction
σB.The main background to the W
0/W∗ → `νsignal comes from the high-m
Ttail produced by SM W boson decays to the same final state. Other backgrounds are Z bosons decaying into two leptons where one lepton is not reconstructed, W or Z decaying to
τleptons where a
τsubsequently decays to an electron or muon, and diboson production. These are collectively referred to as the electroweak (EW) background. In addition, there is a background contribution from t¯ t and single-top production, collectively referred to as top background, which is most important for the lowest W
0masses considered here, where it constitutes about 10% of the background after event selection in the electron channel and 15% in the muon channel. Other strong-interaction background sources, where a light or heavy hadron decays semileptonically or a jet is misidentified as an electron, are estimated to be at most 5% of the total background in the electron channel and a small fraction at the percent level in the muon channel. These are called QCD background in the note.
2 ATLAS Detector
The ATLAS detector [30] is a multipurpose particle detector with forward-backward symmetric cylin- drical geometry covering the pseudorapidity range
|η| <2.5 for measurement of charged particles and|η|<4.9 for all particles except for neutrinos. The inner tracking detector (ID) consists of a silicon pixel
detector, a silicon microstrip detector, and a straw-tube transition radiation tracker. The ID is surrounded by a thin superconducting solenoid, providing a 2 T magnetic field, and then by a high-granularity liquid- argon (LAr) sampling electromagnetic (EM) calorimeter. A steel and scintillator tile calorimeter is lo- cated outside the LAr EM calorimeter and provides hadronic coverage in the central rapidity range. The end-cap and forward regions are instrumented with LAr calorimetry with copper or tungsten as the ab- sorber for electromagnetic and hadronic measurements. The muon spectrometer (MS) surrounds the calorimeters and consists of three large superconducting toroid systems (each with eight coils) together with multiple layers of trigger and tracking chambers, providing precision track measurement for
|η|<2.7and triggering for
|η|<2.4.3 Trigger and Reconstruction
The data used in the electron channel were recorded with a trigger requiring the presence of an EM
cluster (that is an energy cluster in the EM compartment of the calorimeter) with energy corresponding
to an electron with p
T >120 GeV. For the muon channel, matching tracks in the MS and ID with
combined p
T>36 GeV are used to select events. In order to decrease loss in selection efficiency due to
the trigger, events are also recorded if a muon with p
T >40 GeV and
|η| <1.05 is found in the MS. The
average trigger efficiency (measured with respect to reconstructed objects) is above 99% in the electron
channel and 80–90% in the muon channel in the region of interest.
Each EM cluster with E
T >125 GeV and
|η| <1.37 (central region) or 1.52
< |η| <2.47 (forward region) is considered as an electron candidate if it matches an inner detector track. The electron direction is defined as that of the reconstructed track and its energy as that of the cluster, with a small
η-dependentenergy scale correction. In the high-E
Trange relevant to this analysis, the calorimeter energy resolution is measured in data to be 1.2% in the central region and 1.8% in the forward region [31]. To discriminate against hadronic jets, requirements are imposed on the lateral shower shapes in the first two layers of the EM compartment of the calorimeter and on the fraction of energy leaking into the hadronic compartment.
These requirements result in about 90% identification e
fficiency for electrons with E
T >125 GeV.
Muons are required to have p
T >45 GeV, where the momentum of the muon is obtained by com- bining the ID and MS measurements. To ensure an accurate measurement of the momentum, muons are required to have hits in all three muon layers and are restricted to the following
η-ranges approximately|η|<
1.0 and 1.3
< |η| <2.0. Including the muon candidates with
η-range up to|η| <2.5 leads to signalefficiency increase up to 12% for lower W
0masses, and up to 3% for W
0mass of 3 TeV. However, there is a substantial increase to the background levels, over 15% in the signal region. For the final selec- tion of good muon candidates, the individual ID and MS momentum measurements are required to be in agreement within 5 standard deviations of their errors. The average momentum resolution is about 15%–20% at p
T =1 TeV. About 80% of the muons in these
η-ranges are reconstructed, with most of theloss coming from regions with limited detector coverage.
The missing E
Tin each event is evaluated by summing over energy-calibrated physics objects (jets, photons and leptons) and adding corrections for calorimeter deposits away from these objects [32].
This analysis makes use of all the
√s
=8 TeV data collected in 2012 for which the relevant detector systems were operating properly. The integrated luminosity for the data used in this study is 20.3 fb
−1in both the electron and muon decay channels. The uncertainty on this measurement is 2.8%, which is derived following the methodology detailed in ref. [33].
4 Monte Carlo Simulation
With the exception of the QCD background, which is estimated from data, expected signals and back- grounds are evaluated using simulated samples, normalized with calculated cross-sections and the inte- grated luminosity of the data.
The W
0signal events are generated at leading-order (LO) with P
ythiav8.165 [34] using the MSTW- 2008 LO [35] PDFs. Pythia is also used for the W
∗ →`νevent generation, but with initial kinematics generated at LO with C
alcHEP [36] using the the MSTW2008 LO PDFs. DM signal samples were produced using a M
adgraph5 v1.4.5 [37] implementation interfaced to P
ythiav8.165 for the parton shower and hadronization.
The W
/Zboson and the t¯ t backgrounds are generated at next-to-leading-order (NLO) with P
owheg- B
oxr1556 [38] using the CT10 NLO [39] PDFs along with P
ythiav8.165 for the fragmentation and hadronization. The single-top background is generated at NLO with MC@NLO v4.06 [40] using the CT10 NLO PDFs for the Wt and s-channels, and with A
cerMC v3.8 [41] using CTEQ6L1 PDFs for the t-channel. Fragmentation and hadronization for the MC@NLO samples is performed with H
erwigv6.520 [42], using Jimmy v4.31 [43] for the underlying event, whereas Pythia v6.426 is used for the A
cerMC samples. The WW ,WZ and ZZ diboson backgrounds are generated at multi-leg LO with S
herpav1.4.1 [44] using the CT10 NLO PDFs.
The Pythia signal model for W
0has V− A SM couplings to fermions but does not include interference between W and W
0. For both W
0and W
∗, decays to channels other than eν and
µν, includingτν,ud, sc and tb, are included in the calculation of the widths but are not explicitly included as signal or background.
At high mass (m
W0 >1 TeV), the branching fraction to each of the lepton decay channels is 8.2%.
For all samples, final-state photon radiation from leptons is handled by Photos [45]. The ATLAS
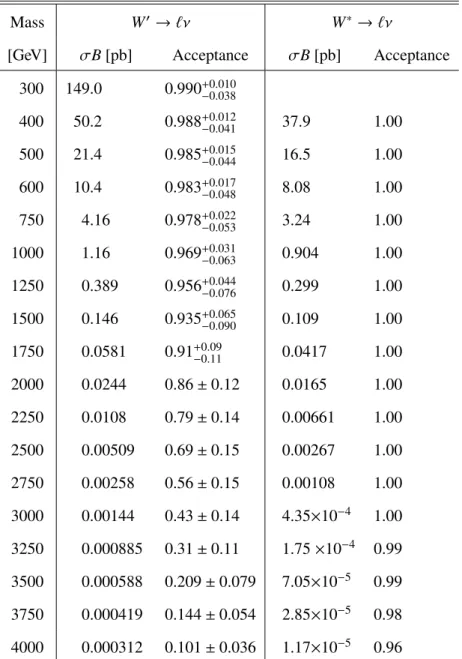
Table 1: Predicted values of
σBfor W
0 →`ν,W
∗→`ν, and corresponding acceptances for the require-ment m
`ν >0.4 m
W0/W∗. The
σBfor W
0 → `νare at NNLO while those for W
∗ → `νare at LO. The values are exclusive and are used for both
` =e and
` = µ. The uncertainties on the acceptance forW
0 → `νare calculated from variations of the MSTW 2008 NNLO PDF at 90% CL, while the uncer- tainties arising from renormalisation and factorisation scale variations are negligible with respect to the ones for PDFs and hence neglected. For the W
∗ →`ν, PDF uncertainties on the acceptance have beenneglected due to the non-renormalizability of the W
∗→`νmodel.
Mass W
0→`νW
∗→`ν[GeV]
σB[pb] Acceptance
σB[pb] Acceptance 300 149.0 0.990
+−0.0380.010400 50.2 0.988
+−0.0410.01237.9 1.00 500 21.4 0.985
+0.015−0.04416.5 1.00 600 10.4 0.983
+0.017−0.0488.08 1.00 750 4.16 0.978
+−0.0530.0223.24 1.00 1000 1.16 0.969
+−0.0630.0310.904 1.00 1250 0.389 0.956
+−0.0760.0440.299 1.00 1500 0.146 0.935
+−0.0900.0650.109 1.00 1750 0.0581 0.91
+−0.110.090.0417 1.00
2000 0.0244 0.86
±0.12 0.0165 1.00
2250 0.0108 0.79
±0.14 0.00661 1.00
2500 0.00509 0.69
±0.15 0.00267 1.00
2750 0.00258 0.56
±0.15 0.00108 1.00
3000 0.00144 0.43
±0.14 4.35×10
−41.00 3250 0.000885 0.31
±0.11 1.75
×10−40.99 3500 0.000588 0.209
±0.079 7.05×10
−50.99 3750 0.000419 0.144
±0.054 2.85×10
−50.98 4000 0.000312 0.101
±0.036 1.17×10
−50.96
full detector simulation [46] based on Geant4 [47] is used to propagate the particles and account for the
response of the detector. For the underlying event, the ATLAS tune AUET2B [48] is used. The effect of
multiple proton-proton collisions from the same or nearby beam bunch crossings (in-time or out-of-time
pile-up) is incorporated into the simulation by overlaying additional minimum-bias events generated with
P
ythiaonto hard-scatter events. Simulated events are weighted to match the distribution of the number
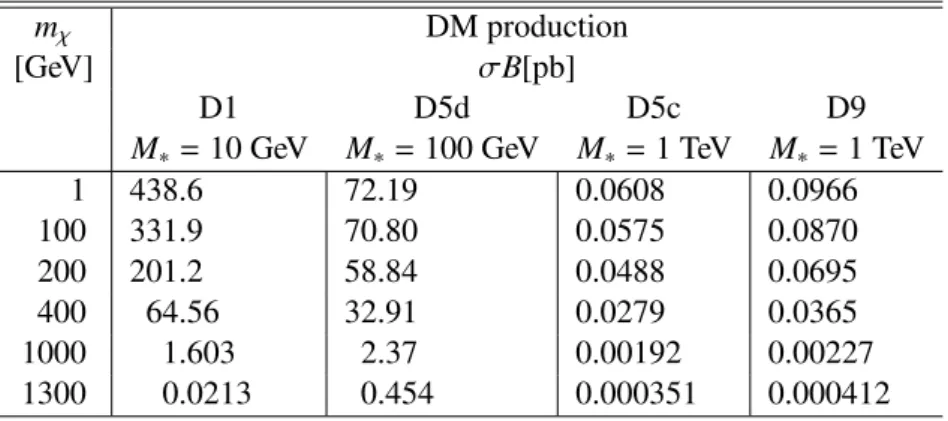
Table 2: Predicted values of
σBfor DM signal with mass of a DM particle labeled m
χ. The values of M
∗used for the calculation for a given operator are shown in the table. The cross-sections are leading order, and the values are inclusive for
`=e, µ, τ.
m
χDM production
[GeV]
σB[pb]D1 D5d D5c D9
M
∗=10 GeV M
∗=100 GeV M
∗=1 TeV M
∗=1 TeV
1 438.6 72.19 0.0608 0.0966
100 331.9 70.80 0.0575 0.0870
200 201.2 58.84 0.0488 0.0695
400 64.56 32.91 0.0279 0.0365
1000 1.603 2.37 0.00192 0.00227
1300 0.0213 0.454 0.000351 0.000412
of interactions per bunch crossing observed in data, but are otherwise reconstructed in the same manner as data.
The W
→`νand Z
→``cross-sections are calculated at next-to-next-to-leading-order (NNLO) with ZWPROD [49] using MSTW2008 NNLO PDFs. Consistent results are obtained using VRAP v0.9 [50]
and FEWZ v3.1b2 [51, 52]. Higher order electroweak corrections are calculated with MCSANC [53].
Mass-dependent K-factors obtained from the ratios of the calculated NNLO cross-sections, with addi- tional electroweak corrections, to the cross-sections of the generated samples are used to scale W
+, W
−and Z backgrounds separately. The W
0 → `νcross-sections are calculated in the same way, except that the electroweak corrections beyond final-state radiation are not included because the calculation for the SM W cannot be applied directly. Cross sections for W
∗ → `νare kept at LO due to the non- renormalizability of the model at higher orders in QCD. The t¯ t cross-section is also calculated at NNLO including resummation of next-to-next-to-leading logarithmic (NNLL) soft gluon terms obtained with T
op++v2.0 [54–59] for a top quark mass of 172.5 GeV. The W
0/W∗and DM particle signal cross sec- tions are listed in table 1 and table 2, respectively. The most important background cross-sections are listed in table 3.
Table 3: Calculated values of
σBfor the leading backgrounds. The value for t¯ t
→`Xincludes all final states with at least one lepton (e,
µor
τ). The others are exclusive and are used for both`=e and
`=µ.All calculations are NNLO except t¯ t which is approximate-NNLO.
Process
σB[pb]
W
→`ν12190
Z/γ
∗→``(m
Z/γ∗ >60 GeV) 1120
t¯ t
→`X137.3
Uncertainties on the W
0and the W
/Zbackground cross-sections are considered due to variations of
the renormalization and factorization scales, PDF
+αsvariations and PDF choice. The scale uncertainties
are estimated by varying both the renormalization and factorization scales simultaneously up or down by
a factor of two. The resulting maximum variation from the two fluctuations is taken as the symmetric
scale uncertainty. The PDF
+αsuncertainty is evaluated using 90% CL eigenvector and 90%
αsvari-
ations of the nominal MSTW2008 NNLO PDF set. The result of this step is combined with the scale uncertainty in quadrature. The PDF choice uncertainty is evaluated by comparing the central values of the MSTW2008 NNLO , CT10 NNLO, NNPDF 2.3 NNLO [60], ABM11 5N NNLO [61] and HER- APDF 1.5 NNLO [62] PDF sets. The envelope provided by the last step and combination of the scale and PDF
+αsuncertainties is taken as the total uncertainty on the di
fferential cross-section for the boson invariant mass. The PDF and
αsuncertainties on the t¯ t cross-section are calculated using the PDF4LHC prescription [63] with the MSTW2008 68% CL NNLO, CT10 NNLO and NNPDF2.3 5f FFN PDF error sets added in quadrature to the scale uncertainty. The systematic uncertainty arising from the variation of the top mass by
±1 GeV is also added in quadrature.
An uncertainty for the beam energy is calculated for the Charged-Current Drell-Yan process with VRAP at NNLO using CT10 NNLO PDFs by taking a 0.66% uncertainty on the energy of each 4 TeV proton beam as determined from ref. [64]. The size of the uncertainty is observed to be about 0.1% at an invariant mass of 100 GeV, 2% at 2 TeV, and 6% at 3 TeV. Uncertainties are propagated to the W
→`νsamples, which constitute the dominant background, in order to derive an uncertainty in each signal region. The beam energy uncertainty is neglected in the calculation of the signal e
fficiency uncertainty.
Uncertainties are not reported on the cross-sections for W
∗due to the breakdown of higher-order corrections for non-renormalizable models.
5 Event Selection
The primary vertex for each event is required to have at least three tracks with p
T >0.4 GeV and to have a longitudinal distance less than 200 mm from the centre of the collision region. There are on average 21 interactions per event in the data used for this analysis. The primary vertex is defined to be the one with the highest summed track p
2T. Spurious tails in the missing E
Tdistribution, arising from calorimeter noise and other detector problems are suppressed by checking the quality of each reconstructed jet and discarding events containing reconstructed jets of poor quality, following description given in ref. [65].
In addition, the inner detector track associated with the electron or muon is required to be compatible with originating from the primary vertex, specifically to have transverse distance of closest approach
|d0|<
1 (0.2) mm and longitudinal distance at this point
|z0|<5 (1) mm for the electron (muon). Events are required to have exactly one electron candidate or one muon candidate satisfying these requirements and passing identification criteria described in Section 3. In the electron channel, events with addi- tional electrons passing the same identification criteria as for the candidate electron but with a lower E
Tthreshold of 20 GeV, are not considered. Similarly in the muon channel, events with additional muon candidates with p
Tthreshold of 20 GeV are discarded.
To suppress the QCD background, the lepton is required to be isolated. In the electron channel, the isolation energy is measured with the calorimeter in a cone
∆R
= p(∆
η)2+(∆
ϕ)2 <0.2 around the electron track, and the requirement is
ΣE
Tcalo<0.007× E
T+5 GeV, where the sum includes all calorimeter energy clusters in the cone excluding the core energy deposited by the electron. The sum is corrected to account for additional interactions and leakage of the electron energy outside this core. The scaling of the threshold with the electron E
Treduces the e
fficiency loss due to radiation from the electron at high E
T. In the muon channel, the isolation energy is measured using inner detector tracks with p
trkT >1 GeV in a cone
∆R
<0.3 around the muon track. The isolation requirement is
Pp
trkT <0.05
×p
T, where the muon track is excluded from the sum. As in the electron channel, the scaling of the threshold with the muon p
Treduces the efficiency loss due to radiation from the muon at high p
T.
Missing E
Tthresholds are imposed to further suppress the background from QCD and W
+jets. Inboth channels, the threshold used for the charged lepton p
Tis also applied to the missing E
T: E
missT >125 GeV for the electron channel and E
missT >45 GeV for the muon channel.
The QCD background is evaluated using the matrix method [66] in both the electron and muon chan-
nels. In the electron channel, it constitutes about 2–4% of the total background at high m
T. Consistent results are obtained using the inverted isolation technique described in ref. [4]. In the muon channel, the QCD background constitutes about 1–3% of the total background at high m
T.
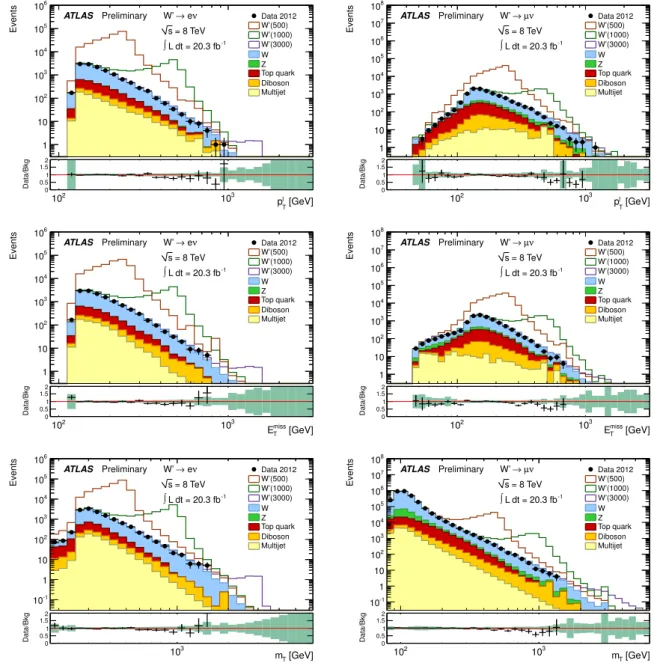
The same reconstruction and event selection are applied to both data and simulated samples. Figure 1 shows the p
T, E
missT, and m
Tspectra for each channel after event selection for the data, for the expected background, and for three examples of W
0signals at different masses. Prior to establishing if there is evidence for a signal, the agreement between data and predicted background is established for events with m
T <252 GeV, the lowest m
Tthreshold used to search for new physics. The optimization of m
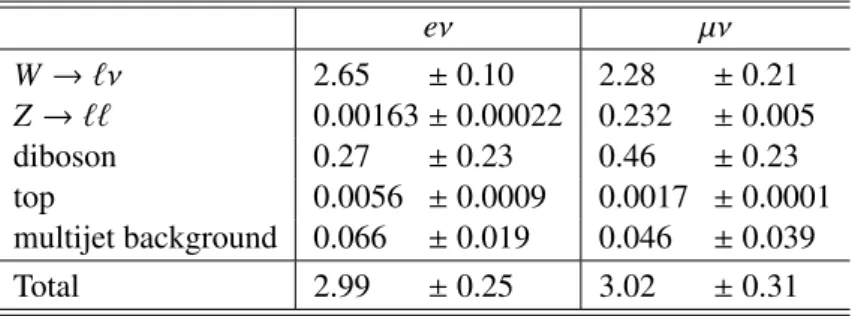
Tselection thresholds depending on the mass candidate is described below. The agreement between the data and expected background is good. Table 4 shows as an example how different sources contribute to the background for m
T >1500 GeV, the region used to search for a W
0with a mass of 2000 GeV. The W
→`νbackground is the dominant contribution for both the electron and muon channels.
Table 4: Expected numbers of events from the various background sources in each decay channel for m
T >1500 GeV, the region used to search for a W
0with a mass of 2000 GeV. The W
→`νand Z
→``rows include the expected contributions from the
τ-lepton. The uncertainties are statistical.eν
µνW
→`ν2.65
±0.10 2.28
±0.21
Z
→``0.00163
±0.00022 0.232
±0.005
diboson 0.27
±0.23 0.46
±0.23
top 0.0056
±0.0009 0.0017
±0.0001
multijet background 0.066
±0.019 0.046
±0.039
Total 2.99
±0.25 3.02
±0.31
[GeV]
l
pT
102 103
Events
1 10 102
103
104
105
106
Data 2012 W’(500) W’(1000) W’(3000) W Z Top quark Diboson Multijet ATLAS Preliminary W’ → eν
= 8 TeV s L dt = 20.3 fb-1
∫
[GeV]
l
pT
102 103
Data/Bkg 00.5 1 1.5 2
[GeV]
l
pT
102 103
Events
1 10 102
103
104
105
106
107
108
Data 2012 W’(500) W’(1000) W’(3000) W Z Top quark Diboson Multijet ATLAS Preliminary W’ →µν
= 8 TeV s L dt = 20.3 fb-1
∫
[GeV]
l
pT
102 103
Data/Bkg 00.5 1 1.5 2
[GeV]
miss
ET
102 103
Events
1 10 102
103
104
105
106
Data 2012 W’(500) W’(1000) W’(3000) W Z Top quark Diboson Multijet ATLAS Preliminary W’ → eν
= 8 TeV s L dt = 20.3 fb-1
∫
[GeV]
miss
ET
102 103
Data/Bkg 00.5 1 1.5 2
[GeV]
miss
ET
102 103
Events
1 10 102
103
104
105
106
107
108
Data 2012 W’(500) W’(1000) W’(3000) W Z Top quark Diboson Multijet ATLAS Preliminary W’ →µν
= 8 TeV s L dt = 20.3 fb-1
∫
[GeV]
miss
ET
102 103
Data/Bkg 00.5 1 1.5 2
[GeV]
mT
103
Events
10-1
1 10 102
103
104
105
106
Data 2012 W’(500) W’(1000) W’(3000) W Z Top quark Diboson Multijet ATLAS Preliminary W’ → eν
= 8 TeV s L dt = 20.3 fb-1
∫
[GeV]
mT
103 Data/Bkg 00.5
1 1.52
[GeV]
mT
102 103
Events
10-1
1 10 102
103
104
105
106
107
108
Data 2012 W’(500) W’(1000) W’(3000) W Z Top quark Diboson Multijet ATLAS Preliminary W’ →µν
= 8 TeV s L dt = 20.3 fb-1
∫
[GeV]
mT
102 103
Data/Bkg 00.5 1 1.52
Figure 1: Spectra of lepton p
T(top), E
missT(center) and m
T(bottom) for the electron (left) and muon (right) channels after the event selection. The spectra of p
Tand E
Tmissare shown with the requirement m
T>
252 GeV. The points represent data and the filled, stacked histograms show the predicted backgrounds.
Open histograms are W
0 → `νsignals added to the background with their masses in GeV indicated
in parentheses in the legend. The signal and background samples are normalized using the integrated
luminosity of the data and the NNLO cross-sections listed in tables 1 and 3, except for the multijet
background which is estimated from data. The error bars on the data points are statistical. The ratio
between the data and the total background prediction is shown below each of the distributions. The
bands include systematic uncertainties on the background including the ones arising from the statistical
uncertainty of the simulated samples.
6 Statistical Analysis and Systematics
A Bayesian analysis is performed to set limits on the studied processes. For each candidate mass and decay channel, events are counted above an m
Tthreshold, m
T >m
Tmin. The optimization of m
Tminis done separately for W
0→`νand W
∗→`ν, resulting in separate thresholds. For each m
W0/W∗, the m
Tminvalues are obtained in the electron and muon channels separately, but for simplicity the minimum one is used in both channels. A similar optimization is performed for setting the limits on DM production, and in this case a single m
Tminis chosen for a given operator. The expected number of events in each channel is
N
exp=εsigL
intσB+N
bg,(2)
where L
intis the integrated luminosity of the data sample,
εsigis the event selection e
fficiency that is the fraction of events that pass event selection criteria and have m
Tabove threshold, and N
bgis the expected number of background events.
σBis the cross-section as defined in Section 1, and B is the branching fraction of W
0/W∗decaying into lepton (electron or a muon) and a neutrino.
εsigis calculated by applying the generator level requirement m
`ν >0.4 m
W0only in the denominator. This increases
εsigby less than 1% relative to the
εsigcalculated by applying the same requirement in both the numerator and the denominator, except for the highest mass where the increase is 3%. For limits on DM production, total cross section times branching fraction is used. Using Poisson statistics, the likelihood to observe N
obsevents is
L
(N
obs|σB)=(L
intεsigσB+N
bg)
Nobse
−(LintεsigσB+Nbg)N
obs!
.(3)
Uncertainties are handled by introducing nuisance parameters
θi, each with a probability density function (pdf)
gi(θ
i), and integrating the product of the Poisson likelihood with the pdfs. The integrated likelihood is
LB(Nobs|σB)=Z
L(Nobs|σB)Y
gi(θi)dθi, (4)
where a log-normal distribution is used for the
gi(θ
i). The nuisance parameters are taken to be: L
int,
εsigand N
bg, with appropriate correlation between the first and the third parameters.
The measurements in the two decay channels are combined assuming the same branching fraction for each. Equation (4) remains valid with the Poisson likelihood replaced by the product of the Poisson likelihoods for the two channels. The electron and muon integrated luminosity measurements are fully correlated. For W
0 → `νthe signal e
fficiencies and background levels are partly correlated with each other and between the two channels due to the full correlation of the cross section uncertainties. If these correlations are not included, the observed
σBlimits for the lowest mass points improve by 25%–30%, for the high-mass points m
W0 >3000 GeV by 10%, while the improvement for intermediate mass points is at a percent level. For W
∗the background predictions are taken to be partly correlated between the two channels.
Bayes theorem gives the posterior probability that the signal has signal strength
σB:P
post(σB|N
obs)
=NL
B(N
obs|σB)P
prior(σB) (5) where P
prior(σB) is the assumed prior probability, here chosen to be one (that is flat in
σB) forσB>0.
The constant factor N normalizes the total probability to one. The posterior probability is evaluated for each mass and each decay channel and their combination, and then used to set a limit on
σB.The inputs for the evaluation of
LB(and hence P
post) are L
int,
εsig, N
bg, N
obsand the uncertainties
on the first three. The uncertainties on
εsigand N
bgaccount for experimental and theoretical systematic
e
ffects as well as the statistics of the simulation samples. The experimental systematic uncertainties
include those on efficiencies for the electron or muon trigger, reconstruction and selection. Lepton mo-
mentum and missing E
Tresponse, characterized by scale and resolution, are also included. Most of these
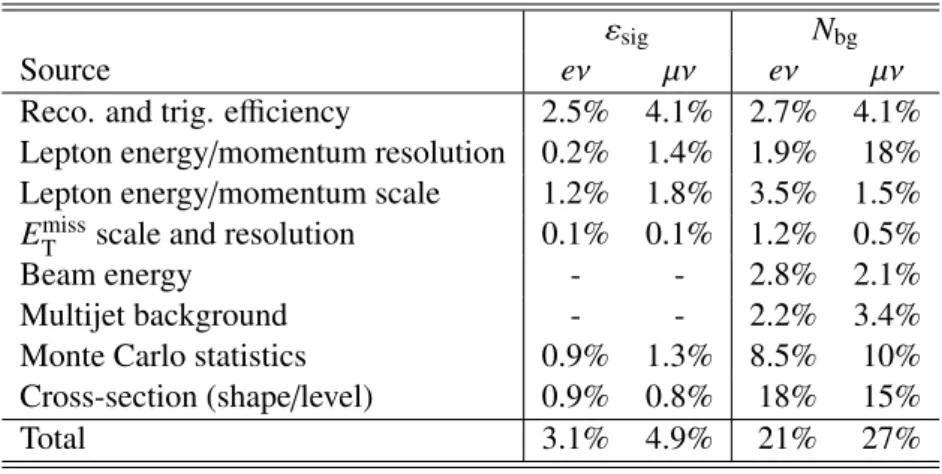
Table 5: Relative uncertainties on the event selection e
fficiency and background abundance for a W
0with a mass of 2000 GeV. The e
fficiency uncertainties include contributions from the trigger, reconstruction and event selection. The last row gives the total relative uncertainties.
εsig
N
bgSource eν
µνeν
µνReco. and trig. efficiency 2.5% 4.1% 2.7% 4.1%
Lepton energy
/momentum resolution 0.2% 1.4% 1.9% 18%
Lepton energy
/momentum scale 1.2% 1.8% 3.5% 1.5%
E
missTscale and resolution 0.1% 0.1% 1.2% 0.5%
Beam energy - - 2.8% 2.1%
Multijet background - - 2.2% 3.4%
Monte Carlo statistics 0.9% 1.3% 8.5% 10%
Cross-section (shape/level) 0.9% 0.8% 18% 15%
Total 3.1% 4.9% 21% 27%
performance metrics are measured at relatively low p
Tand their values are extrapolated to the high-p
Tregime relevant to this analysis. The uncertainties in these extrapolations are included but are too small to significantly a
ffect the results. Table 5 summarizes the uncertainties on the event selection e
fficiencies and background levels for the W
0 →`νsignal with m
W0 =2000 GeV using m
T >1500 GeV.
The inputs for the evaluation of
LBare listed in tables 6, 7 and 8. The uncertainties on
εsigand N
bgaccount for all relevant experimental and theoretical e
ffects except for the uncertainty on the integrated luminosity. The latter is included separately to allow for the correlation between signal and background.
The table also lists the predicted numbers of signal events, N
sig, with their uncertainties accounting
for the uncertainties in both
εsigand the cross-section calculation. The maximum value for the signal
selection efficiency is at m
W0 =2000 GeV. For lower masses, the efficiency falls because the relative m
Tthreshold, m
Tmin/mW0, increases to reduce the background level. The contribution from W
0 →τνwith
τleptonically decaying has been neglected. It would increase signal strength by 2-3% for the highest
masses. The background level is estimated for each mass by summing all the background sources.
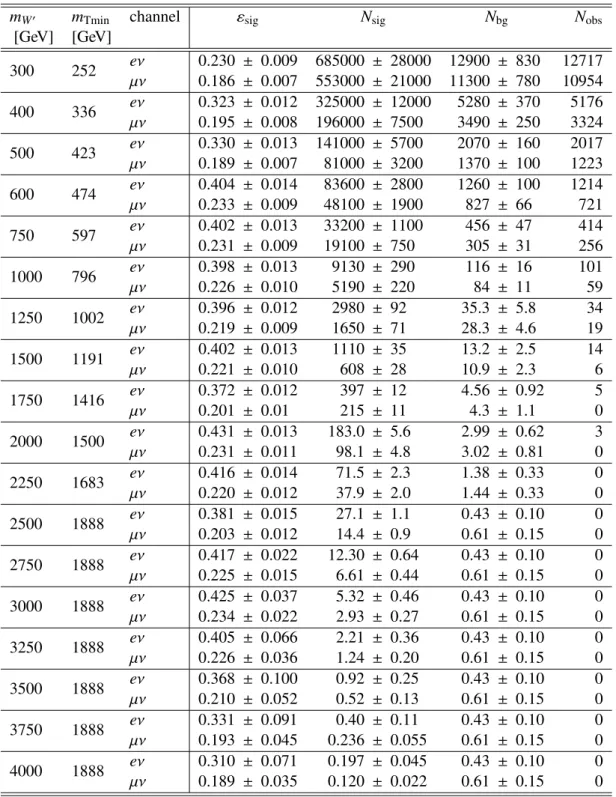
Table 6: Inputs to the W
0 → `ν σBlimit calculations. The first three columns are the W
0mass, m
Tthreshold and decay channel, respectively. The next two are the signal selection e
fficiency as defined in the text,
εsig, and the prediction for the number of signal events, N
sig, obtained with this efficiency.
The last two columns are the expected number of background events, N
bg, and the number of events observed in data, N
obs. The uncertainties on N
sigand N
bginclude contributions from the uncertainties on the cross-sections but not from that on the integrated luminosity.
m
W0m
Tminchannel
εsigN
sigN
bgN
obs[GeV] [GeV]
300 252 eν 0.230
±0.009 685000
±28000 12900
±830 12717
µν0.186
±0.007 553000
±21000 11300
±780 10954
400 336 eν 0.323
±0.012 325000
±12000 5280
±370 5176
µν
0.195
±0.008 196000
±7500 3490
±250 3324
500 423 eν 0.330
±0.013 141000
±5700 2070
±160 2017
µν
0.189
±0.007 81000
±3200 1370
±100 1223
600 474 eν 0.404
±0.014 83600
±2800 1260
±100 1214
µν
0.233
±0.009 48100
±1900 827
±66 721
750 597 eν 0.402
±0.013 33200
±1100 456
±47 414
µν
0.231
±0.009 19100
±750 305
±31 256
1000 796 eν 0.398
±0.013 9130
±290 116
±16 101
µν
0.226
±0.010 5190
±220 84
±11 59
1250 1002 eν 0.396
±0.012 2980
±92 35.3
±5.8 34
µν
0.219
±0.009 1650
±71 28.3
±4.6 19
1500 1191 eν 0.402
±0.013 1110
±35 13.2
±2.5 14
µν
0.221
±0.010 608
±28 10.9
±2.3 6
1750 1416 eν 0.372
±0.012 397
±12 4.56
±0.92 5
µν
0.201
±0.01 215
±11 4.3
±1.1 0
2000 1500 eν 0.431
±0.013 183.0
±5.6 2.99
±0.62 3
µν
0.231
±0.011 98.1
±4.8 3.02
±0.81 0
2250 1683 eν 0.416
±0.014 71.5
±2.3 1.38
±0.33 0
µν
0.220
±0.012 37.9
±2.0 1.44
±0.33 0
2500 1888 eν 0.381
±0.015 27.1
±1.1 0.43
±0.10 0
µν
0.203
±0.012 14.4
±0.9 0.61
±0.15 0
2750 1888 eν 0.417
±0.022 12.30
±0.64 0.43
±0.10 0
µν
0.225
±0.015 6.61
±0.44 0.61
±0.15 0
3000 1888 eν 0.425
±0.037 5.32
±0.46 0.43
±0.10 0
µν
0.234
±0.022 2.93
±0.27 0.61
±0.15 0
3250 1888 eν 0.405
±0.066 2.21
±0.36 0.43
±0.10 0
µν
0.226
±0.036 1.24
±0.20 0.61
±0.15 0
3500 1888 eν 0.368
±0.100 0.92
±0.25 0.43
±0.10 0
µν
0.210
±0.052 0.52
±0.13 0.61
±0.15 0
3750 1888 eν 0.331
±0.091 0.40
±0.11 0.43
±0.10 0
µν
0.193
±0.045 0.236
±0.055 0.61
±0.15 0
4000 1888 eν 0.310
±0.071 0.197
±0.045 0.43
±0.10 0
µν
0.189
±0.035 0.120
±0.022 0.61
±0.15 0
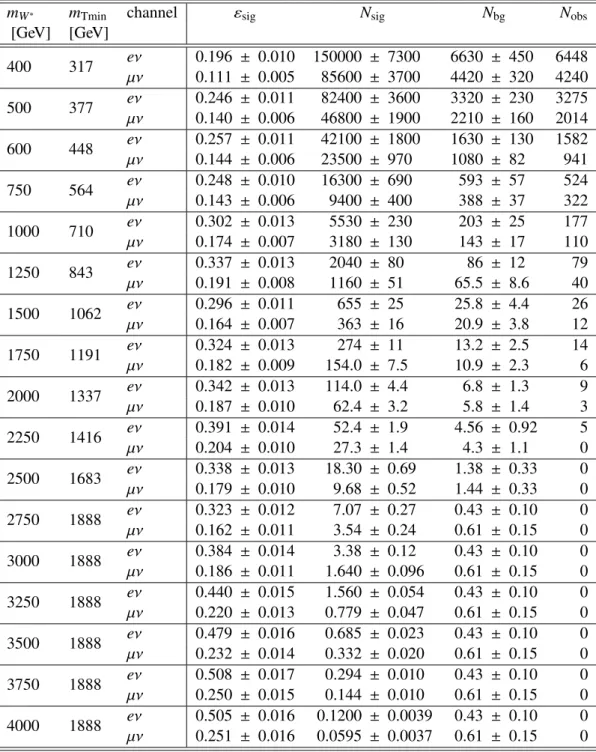
Table 7: Inputs to the W
∗→`ν σBlimit calculations. The columns are as for table 6.
m
W∗m
Tminchannel
εsigN
sigN
bgN
obs[GeV] [GeV]
400 317 eν 0.196
±0.010 150000
±7300 6630
±450 6448
µν
0.111
±0.005 85600
±3700 4420
±320 4240
500 377 eν 0.246
±0.011 82400
±3600 3320
±230 3275
µν
0.140
±0.006 46800
±1900 2210
±160 2014
600 448 eν 0.257
±0.011 42100
±1800 1630
±130 1582
µν
0.144
±0.006 23500
±970 1080
±82 941
750 564 eν 0.248
±0.010 16300
±690 593
±57 524
µν
0.143
±0.006 9400
±400 388
±37 322
1000 710 eν 0.302
±0.013 5530
±230 203
±25 177
µν
0.174
±0.007 3180
±130 143
±17 110
1250 843 eν 0.337
±0.013 2040
±80 86
±12 79
µν
0.191
±0.008 1160
±51 65.5
±8.6 40
1500 1062 eν 0.296
±0.011 655
±25 25.8
±4.4 26
µν
0.164
±0.007 363
±16 20.9
±3.8 12
1750 1191 eν 0.324
±0.013 274
±11 13.2
±2.5 14
µν
0.182
±0.009 154.0
±7.5 10.9
±2.3 6
2000 1337 eν 0.342
±0.013 114.0
±4.4 6.8
±1.3 9
µν
0.187
±0.010 62.4
±3.2 5.8
±1.4 3
2250 1416 eν 0.391
±0.014 52.4
±1.9 4.56
±0.92 5
µν
0.204
±0.010 27.3
±1.4 4.3
±1.1 0
2500 1683 eν 0.338
±0.013 18.30
±0.69 1.38
±0.33 0
µν
0.179
±0.010 9.68
±0.52 1.44
±0.33 0
2750 1888 eν 0.323
±0.012 7.07
±0.27 0.43
±0.10 0
µν
0.162
±0.011 3.54
±0.24 0.61
±0.15 0
3000 1888 eν 0.384
±0.014 3.38
±0.12 0.43
±0.10 0
µν
0.186
±0.011 1.640
±0.096 0.61
±0.15 0
3250 1888 eν 0.440
±0.015 1.560
±0.054 0.43
±0.10 0
µν
0.220
±0.013 0.779
±0.047 0.61
±0.15 0
3500 1888 eν 0.479
±0.016 0.685
±0.023 0.43
±0.10 0
µν
0.232
±0.014 0.332
±0.020 0.61
±0.15 0
3750 1888 eν 0.508
±0.017 0.294
±0.010 0.43
±0.10 0
µν
0.250
±0.015 0.144
±0.010 0.61
±0.15 0
4000 1888 eν 0.505
±0.016 0.1200
±0.0039 0.43
±0.10 0
µν0.251
±0.016 0.0595
±0.0037 0.61
±0.15 0
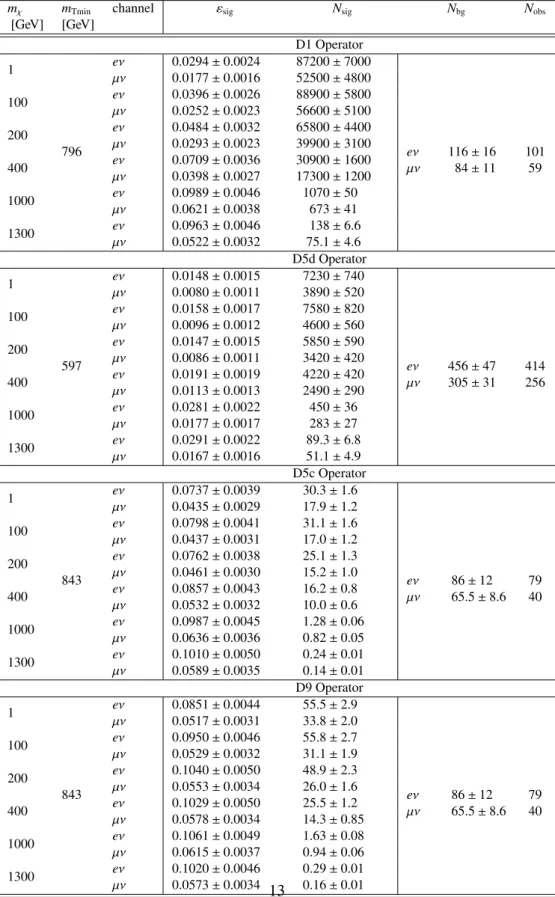
Table 8: Inputs to the limit calculations on pair production of DM particles for the operators D1, D5d, D5c and D9. Expected number of signal events for each operator is calculated for a different value of mass scale, notably M
∗ =10 GeV for D1, M
∗ =100 GeV for D5d, and M
∗ =1 TeV for operators D9 and D5c. The columns are as for table 6, except
εsigis inclusive efficiency, and m
χis the mass of DM particle.
mχ mTmin channel εsig Nsig Nbg Nobs
[GeV] [GeV]
D1 Operator 1
796
eν 0.0294±0.0024 87200±7000
eν 116±16 101 µν 0.0177±0.0016 52500±4800
µν 84±11 59
100 eν 0.0396±0.0026 88900±5800
µν 0.0252±0.0023 56600±5100
200 eν 0.0484±0.0032 65800±4400
µν 0.0293±0.0023 39900±3100
400 eν 0.0709±0.0036 30900±1600
µν 0.0398±0.0027 17300±1200
1000 eν 0.0989±0.0046 1070±50
µν 0.0621±0.0038 673±41
1300 eν 0.0963±0.0046 138±6.6
µν 0.0522±0.0032 75.1±4.6 D5d Operator 1
597
eν 0.0148±0.0015 7230±740
eν 456±47 414 µν 0.0080±0.0011 3890±520
µν 305±31 256
100 eν 0.0158±0.0017 7580±820
µν 0.0096±0.0012 4600±560
200 eν 0.0147±0.0015 5850±590
µν 0.0086±0.0011 3420±420
400 eν 0.0191±0.0019 4220±420
µν 0.0113±0.0013 2490±290
1000 eν 0.0281±0.0022 450±36
µν 0.0177±0.0017 283±27
1300 eν 0.0291±0.0022 89.3±6.8
µν 0.0167±0.0016 51.1±4.9 D5c Operator 1
843
eν 0.0737±0.0039 30.3±1.6
eν 86±12 79 µν 0.0435±0.0029 17.9±1.2
µν 65.5±8.6 40
100 eν 0.0798±0.0041 31.1±1.6
µν 0.0437±0.0031 17.0±1.2
200 eν 0.0762±0.0038 25.1±1.3
µν 0.0461±0.0030 15.2±1.0
400 eν 0.0857±0.0043 16.2±0.8
µν 0.0532±0.0032 10.0±0.6
1000 eν 0.0987±0.0045 1.28±0.06
µν 0.0636±0.0036 0.82±0.05
1300 eν 0.1010±0.0050 0.24±0.01
µν 0.0589±0.0035 0.14±0.01 D9 Operator 1
843
eν 0.0851±0.0044 55.5±2.9
eν 86±12 79 µν 0.0517±0.0031 33.8±2.0
µν 65.5±8.6 40
100 eν 0.0950±0.0046 55.8±2.7
µν 0.0529±0.0032 31.1±1.9
200 eν 0.1040±0.0050 48.9±2.3
µν 0.0553±0.0034 26.0±1.6
400 eν 0.1029±0.0050 25.5±1.2
µν 0.0578±0.0034 14.3±0.85
1000 eν 0.1061±0.0049 1.63±0.08
µν 0.0615±0.0037 0.94±0.06 eν 0.1020±0.0046 0.29±0.01
7 Results
Tables 9 and 10 and figure 2 present the 95% CL observed limits on
σBfor both W
0→`νand W
∗→`νin the electron channel, the muon channel and their combination. The tables also give the limits obtained without systematic uncertainties and with various subsets. The uncertainties on the signal selection e
fficiency have very little e
ffect on the final limits, and the background-level and luminosity uncertainties are important only for the lowest masses. The figure also shows the expected limits and the theoretical
σBfor a W
0and for a W
∗of the same width.
Table 9: Observed upper limits on W
0and W
∗ σBfor masses up to 2000 GeV. The first column is the W
0/W∗mass and the following are the 95% CL limits for W
0with headers indicating the nuisance parameters for which uncertainties are included: S for the event selection e
fficiency (ε
sig), B for the background level (N
bg), and L for the integrated luminosity (L
int). The column labeled SBL includes all uncertainties neglecting correlations. Results are also presented including correlation of the signal and background cross-sections uncertainties, as well as correlation for background cross-section uncertainties for the combined limits (SB
c, SB
cL). The last two columns are the limits for W
∗without the nuisance parameters and including all nuisance parameters with correlations.
mW0/W∗[GeV] channel 95% CL limit onσB[fb]
W0 W∗
none S SB SBL SBc SBcL none SBcL
300
e 28.7 28.8 305 342 305 342
µ 23.5 23.6 329 366 329 366
eµ 14.6 14.6 220 270 291 332
400
e 13.9 13.9 95.3 105 95.4 105 20.7 204
µ 12.8 12.8 92.6 103 92.6 103 26.0 234
eµ 7.58 7.59 64.3 77.5 84.5 95.7 12.8 198 500
e 9.01 9.04 39.3 42.8 39.4 42.9 17.3 88.1
µ 6.46 6.48 31.9 35.2 31.9 35.4 10.8 79.8
eµ 4.25 4.26 23.1 27.6 31.0 35.0 7.67 79.1 600
e 5.58 5.59 20.0 21.6 20.1 21.7 10.4 44.9
µ 4.37 4.39 16.1 17.6 16.2 17.7 7.23 34.1
eµ 2.76 2.76 11.5 13.6 16.2 18.0 4.81 35.3 750
e 2.88 2.89 8.36 8.79 8.41 8.86 4.23 15.3
µ 3.31 3.32 8.08 8.52 8.13 8.58 5.29 15.2
eµ 1.71 1.71 5.19 5.74 7.18 7.67 2.52 13.4 1000
e 1.79 1.79 3.19 3.28 3.22 3.31 2.69 6.11
µ 1.85 1.86 2.89 2.98 2.93 3.01 3.09 6.15
eµ 1.02 1.02 1.86 1.96 2.47 2.57 1.59 5.11 1250
e 1.56 1.56 1.97 2.00 1.98 2.01 2.29 3.67
µ 1.55 1.55 1.89 1.92 1.91 1.94 1.78 2.60
eµ 0.946 0.947 1.24 1.27 1.45 1.48 1.16 2.56 1500
e 1.19 1.19 1.31 1.32 1.31 1.32 1.99 2.39
µ 1.13 1.14 1.24 1.25 1.24 1.25 1.71 2.04
eµ 0.725 0.726 0.814 0.825 0.886 0.896 1.14 1.62 1750
e 0.871 0.874 0.897 0.901 0.900 0.904 1.48 1.63 µ 0.735 0.739 0.739 0.742 0.741 0.744 1.37 1.51 eµ 0.471 0.471 0.482 0.486 0.502 0.506 0.890 1.09 2000
e 0.617 0.619 0.629 0.631 0.631 0.633 1.34 1.40 µ 0.639 0.642 0.642 0.645 0.644 0.646 1.18 1.25 eµ 0.356 0.356 0.361 0.363 0.370 0.372 0.831 0.918
The numbers of observed events are generally in good agreement with the expected numbers of
Table 10: Observed upper limits on W
0and W
∗σBfor masses above 2000 GeV. The columns are as for table 9.
mW0/W∗[GeV] channel 95% CL limit onσB[fb]
W0 W∗
none S SB SBL SBc SBcL none SBcL
2250
e 0.356 0.357 0.357 0.357 0.358 0.359 0.829 0.858 µ 0.672 0.675 0.675 0.677 0.677 0.679 0.725 0.732 eµ 0.233 0.233 0.233 0.234 0.234 0.235 0.456 0.487 2500
e 0.388 0.389 0.389 0.390 0.390 0.391 0.437 0.440 µ 0.729 0.735 0.735 0.736 0.737 0.739 0.827 0.834 eµ 0.253 0.254 0.254 0.254 0.255 0.256 0.286 0.288 2750
e 0.354 0.356 0.356 0.357 0.358 0.358 0.458 0.460 µ 0.657 0.663 0.663 0.665 0.667 0.668 0.914 0.925 eµ 0.230 0.231 0.231 0.231 0.233 0.234 0.305 0.307 3000
e 0.348 0.354 0.354 0.354 0.356 0.357 0.385 0.387 µ 0.633 0.643 0.643 0.645 0.649 0.651 0.795 0.802 eµ 0.225 0.226 0.226 0.227 0.231 0.232 0.260 0.261 3250
e 0.366 0.385 0.385 0.386 0.391 0.392 0.336 0.337 µ 0.655 0.688 0.688 0.689 0.699 0.701 0.673 0.680 eµ 0.235 0.240 0.240 0.241 0.254 0.255 0.224 0.225 3500
e 0.402 0.462 0.462 0.463 0.473 0.474 0.309 0.310 µ 0.704 0.789 0.789 0.791 0.810 0.812 0.637 0.643 eµ 0.256 0.271 0.271 0.272 0.305 0.306 0.208 0.209 3750
e 0.447 0.516 0.516 0.517 0.528 0.529 0.291 0.292 µ 0.765 0.849 0.849 0.851 0.870 0.872 0.592 0.598 eµ 0.282 0.299 0.299 0.299 0.336 0.337 0.195 0.196 4000
e 0.477 0.528 0.528 0.529 0.539 0.540 0.293 0.294 µ 0.781 0.836 0.836 0.838 0.853 0.855 0.590 0.595 eµ 0.296 0.308 0.308 0.309 0.336 0.337 0.195 0.196
Table 11: Lower limits on the W
0and W
∗masses. The first column is the decay channel (eν,
µνor both combined) and the following give the expected (Exp.) and observed (Obs.) mass limits.
m
W0[TeV] m
W∗[TeV]
decay Exp. Obs. Exp. Obs.
eν 3.15 3.15 3.04 3.04
µν
2.98 2.98 2.80 2.80
both 3.19 3.27 3.08 3.17
background events for all mass bins. None of the observations for any mass point in either channel or their combination show an excess above background, so there is no evidence for the observation of W
0 →`νor W
∗→`ν. A deficit of the number of observed events with respect to the expected numbersof background events is observed in the muon channel. This deficit is at most at 2σ local significance.
The intersection between the central theoretical prediction and the observed limits provides the 95%
CL lower limits on the mass. Table 11 presents the expected and observed W
0and W
∗mass limits for the electron and muon decay channels and their combination. The band around the theoretical prediction indicates the PDF uncertainty given in table 1. The mass limits for the W
0decrease by 100 GeV if the intersection between the lower theoretical prediction and observed limit is used. The uncertainties on
εsig, N
bgand L
inthave a marginal impact on the derived mass limits.
The results above are obtained using log normal distributions for the probability density functions of
[GeV]
mW’
500 1000 1500 2000 2500 3000 3500 4000
B [fb]
10-1
1 10 102
103 NNLO theory
Observed limit Expected limit 1
± Expected
± 2 Expected
= 8 TeV,
s = 8 TeV, Ldt = 20.3 fb-1 s
e W’
> 0.4 mW’
ml
ATLAS Preliminary
[GeV]
mW*
500 1000 1500 2000 2500 3000 3500 4000
B [fb]
10-1
1 10 102
103 LO theory
Observed limit Expected limit 1
± Expected
± 2 Expected
= 8 TeV,
s = 8 TeV, Ldt = 20.3 fb-1 s
e W*
> 0.4 mW*
ml
ATLAS Preliminary
[GeV]
mW’
500 1000 1500 2000 2500 3000 3500 4000
B [fb]
10-1
1 10 102
103 NNLO theory
Observed limit Expected limit
± 1 Expected
2
± Expected
= 8 TeV,
s = 8 TeV, Ldt = 20.3 fb-1 s
W’ µ > 0.4 mW’
ml
ATLAS Preliminary
[GeV]
mW*
500 1000 1500 2000 2500 3000 3500 4000
B [fb]
10-1
1 10 102
103 LO theory
Observed limit Expected limit
± 1 Expected
2
± Expected
= 8 TeV,
s = 8 TeV, Ldt = 20.3 fb-1 s
W* µ > 0.4 mW*
ml
ATLAS Preliminary
[GeV]
mW’
500 1000 1500 2000 2500 3000 3500 4000
B [fb]
10-1
1 10 102
103 NNLO theory
Observed limit Expected limit 1
± Expected
± 2 Expected
= 8 TeV,
s = 8 TeV, Ldt = 20.3 fb-1 s
l W’
> 0.4 mW’
ml
ATLAS Preliminary
[GeV]
mW*
500 1000 1500 2000 2500 3000 3500 4000
B [fb]
10-1
1 10 102
103 LO theory
Observed limit Expected limit 1
± Expected
± 2 Expected
= 8 TeV,
s = 8 TeV, Ldt = 20.3 fb-1 s
l W*
> 0.4 mW*
ml
ATLAS Preliminary