ATLAS-CONF-2014-036 04July2014
ATLAS NOTE
ATLAS-CONF-2014-036
July 2, 2014
Search for pair and single production of new heavy quarks that decay to a Z Z Z boson and a third generation quark in p p pp p p collisions at √
s = = = 8 8 8 TeV with the ATLAS detector
The ATLAS Collaboration
Abstract
A search is presented for the production of new heavy quarks that decay to a Z boson and a third generation Standard Model quark. In the case of a new charge
+2/3 quark(T ), the decay targeted is T
→Zt, while the decay targeted for a new charge
−1/3 quark (B) is
√B
→Zb. The search uses a dataset corresponding to 20.3 fb
−1of pp collisions at s
=8 TeV recorded in 2012 with the ATLAS detector at the CERN Large Hadron Collider.
Selected events contain a high transverse momentum Z boson candidate reconstructed from a pair of oppositely-charged same-flavor leptons (electrons or muons), and are analyzed in two channels defined by the presence or absence of a third lepton. Hadronic jets, in particular those with properties consistent with the decay of a b hadron, are also required to be present in selected events. Different requirements are made on the jet activity in the event in order to enhance the sensitivity to either heavy quark pair production mediated by the strong interaction, or single production mediated by the electroweak interaction. No significant excess of events above the Standard Model expectation is observed, and lower limits are derived on the mass of vector-like T and B quarks under various branching ratio hypotheses, as well as upper limits on the magnitude of electroweak coupling parameters.
c Copyright 2014 CERN for the benefit of the ATLAS Collaboration.
Reproduction of this article or parts of it is allowed as specified in the CC-BY-3.0 license.
1 Introduction
A cornerstone of the Standard Model (SM) is the formulation of the electroweak interactions as arising from a spontaneously broken gauge symmetry. Experiments over the past four decades have confirmed this hypothesis with precision, most notably the LEP and SLC collider programs [1, 2]. However, the nature of the symmetry breaking mechanism is not yet determined. The ATLAS and CMS collaborations have reported observations [3, 4] of a new particle produced at the CERN Large Hadron Collider (LHC) possessing properties thus far consistent with those predicted for the SM Higgs boson. The default elec- troweak symmetry breaking mechanism, whereby a weak-isospin doublet of fundamental scalar fields obtains a vacuum expectation value, therefore remains a valid hypothesis.
Even with the existence of a Higgs-like particle confirmed, the SM cannot be considered a complete description of Nature. For example, the theory does not explain the fermion generations and mass hi- erarchy, or the origin of the matter-antimatter asymmetry in the universe. Nor does it possess a viable dark matter particle or describe gravitational interactions. The SM is therefore generally regarded as a low-energy approximation of a more fundamental theory with new degrees of freedom and symme- tries that would become manifest at higher energy. In fact, the SM violates a concept of naturalness [5]
when extrapolated to energies above the electroweak scale, as fine tuning is required to compensate the quadratic mass-squared divergences of fundamental scalar fields.
Proposed models of physics beyond the SM typically address the naturalness problem by postulating a new symmetry. For example, supersymmetry is a Bose-Fermi symmetry, and the new states related to the SM bosons and fermions by this symmetry introduce new interactions that cancel the quadrat- ically divergent ones. Alternatively, the symmetry could be a spontaneously broken global symmetry of the extended theory, with the Higgs boson emerging as a pseudo-Nambu-Goldstone boson [6]. Ex- amples of models that implement this idea are Little Higgs [7, 8] and Composite Higgs [9, 10] models.
The new states realizing the enhanced symmetry are generically strongly coupled resonances of some new confining dynamics. These include vector-like quarks, defined as color-triplet spin-1/2 fermions whose left- and right-handed chiral components have the same transformation properties under the weak- isospin gauge group. Such quarks could mix with like-charge SM quarks [11, 12], and the mixing of the SM top quark with a charge
+2/3 vector-like quark could play a role in regulating the divergence ofthe Higgs mass-squared. Hence, vector-like quarks emerge as a characteristic feature of several non- supersymmetric natural models [13].
Search strategies for vector-like quarks have been outlined previously [14–17]. Results of searches for chiral fourth-generation quarks apply, though interpreting the exclusions was difficult in the past when the quarks were assumed to decay entirely via the charged-current process. The GIM mechanism [18]
ceases to operate when vector-like quarks are added to the SM, thus allowing for tree-level neutral-current decays of such new heavy quarks [19]. Some searches traditionally targeting chiral quarks, and hence the charged-current decay, have since provided vector-like quark interpretations [20]. Dedicated searches for neutral-current decay channels have also been made [21, 22]. More recently, the CMS collaboration has published an inclusive vector-like top quark search [23] that achieves commensurate sensitivity in the charged- and neutral-current decay modes, and sets lower mass limits ranging from 690 to 780 GeV.
These previous searches assumed the pair production mechanism is dominant, and the strategies were tailored accordingly.
This note describes a search with ATLAS data collected in pp collisions at
√s
=8 TeV for the
production of charge
+2/3 (T) and
−1/3 (B) vector-like quarks that decay to aZ boson and a third
generation quark (T
→Zt and B
→Zb). Selected events contain a high transverse momentum Z boson
candidate reconstructed from a pair of oppositely-charged same-flavor leptons (electrons or muons), and
are analyzed in two channels defined by the presence or absence of a third lepton. Hadronic jets, in
particular those likely to have contained a b hadron, are also required. Lastly, different requirements on
the jet activity in the event are made to enhance the sensitivity to heavy quark pair production mediated by the strong interaction, or single production mediated by the electroweak interaction.
2 ATLAS detector
The ATLAS detector [24] identifies and measures the momentum and energy of particles created in proton-proton ( pp) collisions at the LHC. It has a cylindrical geometry, approximate 4π solid angle cov- erage, and consists of particle-tracking detectors, electromagnetic and hadronic calorimeters, and a muon spectrometer. At small radii transverse to the beamline, the inner tracking system utilizes fine-granularity pixel and microstrip detectors designed to provide precision track impact parameter and secondary vertex measurements. These silicon-based detectors cover the pseudorapidity range
|η|<2.5
1. A gas-filled straw tube tracker complements the silicon tracker at larger radii. The tracking detectors are immersed in a 2 T magnetic field produced by a thin superconducting solenoid located in the same cryostat as the barrel electromagnetic (EM) calorimeter. The EM calorimeters employ lead absorbers and utilize liquid argon as the active medium. The barrel EM calorimeter covers
|η|<1.5, and the end-cap EM calorime- ters 1.4
<|η|<3.2. Hadronic calorimetry in the region
|η|<1.7 is achieved using steel absorbers and scintillating tiles as the active medium. Liquid argon calorimetry with copper absorbers is employed in the hadronic end-cap calorimeters, which cover the region 1.5
<|η|<3.2. Forward liquid argon calorimeters employing copper and tungsten absorbers cover the region 3.1
<|η|<4.9. The muon spectrometer measures the deflection of muons with
|η|<2.7 using multiple layers of high-precision tracking chambers located in a toroidal field of approximately 0.5 T and 1 T in the central and end- cap regions, respectively. The muon spectrometer is also instrumented with separate trigger chambers covering
|η|<2.4. The first-level trigger system is implemented in custom electronics, using a subset of the detector information to reduce the event rate to a design value of 75 kHz, while the second and third levels use software algorithms running on PC farms to yield a recorded event rate of approximately 400 Hz.
3 Reconstruction of physics objects
The physics objects utilized in this search are electrons, muons, and hadronic jets, including jets that have been tagged for the presence of a b hadron. This section briefly summarizes the reconstruction methods and identification criteria applied to each object.
Electron candidates [25] are reconstructed from energy deposits (clusters) in the EM calorimeter that are matched to corresponding reconstructed inner detector tracks. The candidates are required to have a transverse energy, E
T, greater than 25 GeV and
|ηcluster|<2.47 (where
ηclusteris the pseudorapidity of the cluster associated with the electron candidate). Candidates in the transition region between the barrel and end-cap calorimeters, 1.37
<|ηcluster|<1.52, are not considered. The longitudinal impact parameter of the electron track with respect to the selected primary vertex of the event is required to be less than 2 mm.
Electron candidates used to reconstruct Z boson candidates satisfy medium quality requirements [25] on the EM cluster and associated track. No additional requirements, for example on calorimeter energy or track isolation, are made. Electron candidates not associated with Z candidates are required to sat- isfy tighter identification requirements [25] to suppress fake electron contributions from hadronic jets.
1ATLAS uses a right-handed coordinate system with its origin at the nominal interaction point (IP) in the center of the detector and thez-axis coinciding with the axis of the beam pipe. Thex-axis points from the IP to the center of the LHC ring, and they-axis points upward. Cylindrical coordinates(r,φ)are used in the transverse plane,φbeing the azimuthal angle around the beam pipe. The pseudorapidity is defined in terms of the polar angleθasη=−ln tan(θ/2). For the purpose of the fiducial selection, this is calculated relative to the geometric center of the detector; otherwise, it is relative to the reconstructed primary vertex of each event.
Further, these electrons are required to be isolated in order to reduce the contribution of non-prompt electrons produced from hadron decays in jets. A calorimeter isolation requirement is applied, based on the scalar sum of transverse energy in cells within a cone of radius
∆R≡ p∆η2+∆φ2<
0.2 around the electron, as well as a track isolation requirement, based on the scalar sum of track transverse momenta within
∆R<0.3. Both isolation requirements are adjusted to be 90% efficient for electrons from W and Z boson decays.
Muon candidates [26, 27] are reconstructed from track segments in the various layers of the muon spectrometer and matched to corresponding inner detector tracks. The final candidates are refitted us- ing the complete track information from both detector systems. A muon candidate is required to sat- isfy p
T>25 GeV and
|η|<2.5. The hit pattern in the inner detector must be consistent with a well- reconstructed track, and the longitudinal impact parameter of the muon track with respect to the selected primary vertex of the event is required to be less than 2 mm. Muons must also satisfy a p
T-dependent track isolation requirement: the scalar sum of the track p
Tin a cone of variable radius
∆R<10 GeV/p
µTaround the muon (excluding the muon itself) must be less than 5% of the muon p
T.
Jets are reconstructed using the anti-k
talgorithm [28–30] with a radius parameter R
=0.4 from cal- ibrated topological clusters built from energy deposits in the calorimeters. Prior to jet finding, a local cluster calibration scheme [31] is applied to correct the topological cluster energy for the effects of non- compensation, dead material, and out-of-cluster leakage. The corrections are obtained from simulation of charged and neutral particles. After energy calibration [32], central jets are defined as those recon- structed with
|η|<2.5 and satisfying p
T>25 GeV. To reduce the contribution of central jets originating from secondary pp interactions, a requirement is made on jets with p
T <50 GeV and
|η|<2.4 that ensures at least 50% of the scalar sum of track transverse momenta associated with the jet comes from tracks also compatible with originating from the primary vertex. Forward jets, utilized in the search for the electroweak single production of vector-like quarks, are defined as those with 2.5
<|η|<4.5 and p
T>35 GeV. During jet reconstruction, no distinction is made between identified electron and hadronic jet energy deposits. Therefore, if any selected jet is within
∆R<0.2 of a selected electron, the jet is dis- carded in order to avoid double-counting of electrons as jets. After this, any electrons or muons within
∆R<
0.4 of selected jets are discarded.
Central jets are identified as originating from the hadronization of a b quark (b-tagging) using a multivariate discriminant that combines information from the impact parameters of displaced tracks as well as topological properties of secondary and tertiary decay vertices reconstructed within the jet [33, 34]. The operating point used corresponds to a b-tagging efficiency of 70%, as determined for b-tagged jets with p
T>20 GeV and
|η|<2.5 in simulated t¯ t events, with light and charm quark rejection factors of approximately 130 and 5, respectively.
4 Data sample and event preselection
The data analyzed in this search were collected with the ATLAS detector between April and Decem- ber 2012 during LHC pp collisions at
√s
=8 TeV and correspond to an integrated luminosity of
20.3
±0.6 fb
−1[35]. Events recorded by single electron or muon triggers under stable beam condi-
tions and for which all detector subsystems were operational are considered. Single lepton triggers with
different p
Tthresholds are combined to increase the overall efficiency. The p
Tthresholds are 24 and
60 GeV for electron triggers and 24 and 36 GeV for muon triggers. The lower threshold triggers include
isolation requirements on the candidate leptons, resulting in inefficiencies at higher p
Tthat are recovered
by the higher p
Tthreshold triggers. Events satisfying the trigger requirements must also have a recon-
structed vertex with at least five associated tracks, consistent with the beam collision region in the x
−y
plane. If more than one such vertex is found, the primary vertex selected is the one with the largest sum
of the squared transverse momenta of its associated tracks.
Events selected for analysis contain at least one pair of same flavor reconstructed leptons (electrons or muons) with opposite electric charge, and at least one reconstructed lepton in the event must match (∆R
<0.15) a lepton reconstructed by the high-level trigger. Reconstructed Z boson candidates are formed if the invariant mass of a same-flavor opposite-charge lepton pair differs from the Z boson mass by less than 10 GeV. If more than one Z boson candidate is reconstructed in an event, the one whose mass is closest to the Z boson mass is considered. Selected events are then separated into two categories defined by the presence or absence of a third electron or muon that is not associated with the Z candidate, referred to as the dilepton and trilepton channels. After preselection, 12.5 million and 1.76 thousand events are selected in the dilepton and trilepton channels, respectively.
5 Signal modeling
This section introduces the production mechanisms and decay properties of the new heavy quark signal, and describes how they are modeled in this analysis.
5.1 Heavy quark pair production and vector-like quark decay modes
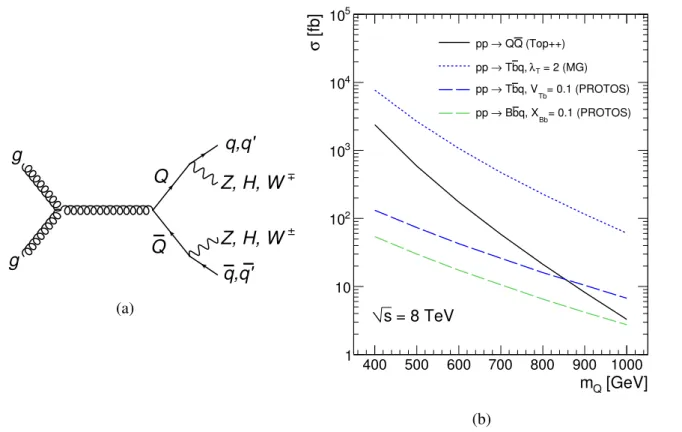
One source of heavy quark production at the LHC is through pair production via the strong interaction, as illustrated in Fig. 1(a). The cross section at
√s
=8 TeV versus the new quark mass is denoted by the solid line in Fig. 1(b). The prediction was computed using T
OP++ v2.0 [36, 37], a next-to-next-to- leading-order (NNLO) in QCD calculation including resummation of next-to-next-to-leading logarithm (NNLL) soft gluon terms, using the MSTW 2008 NNLO [38, 39] set of parton distribution functions (PDFs). It is independent of the charge of the new heavy quark. The cross section prediction ranges from 2.4 pb for a quark mass of 400 GeV to 3.3 fb for a quark mass of 1000 GeV, with an uncertainty that increases from 8 to 14% over this mass range. The PDF and
αsuncertainties dominate over the scale uncertainty, and were evaluated according to the PDF4LHC recommendations [40].
Once produced, the final state topology depends on the decay modes of the new quarks. Unlike chiral quarks, which only decay at tree-level in the charged-current decay mode, vector-like quarks may decay at tree-level to a W, Z, or H boson plus a SM quark. Additionally, vector-like quarks are often assumed to couple preferentially to third generation SM quarks [11, 41], particularly in the context of naturalness arguments. Thus, Fig. 1(a) depicts a T or a B vector-like quark, represented by Q, decaying to either a SM t or b quark, represented by q or q
0, and a Z, H, or W boson. The branching ratios of a T quark versus its mass, as computed by
PROTOSv2.2 [15, 42], are shown in Fig. 2(a),
2. A weak-isospin (SU
(2))singlet T quark hypothesis is depicted, as well as a T that is part of an SU
(2)doublet. The doublet prediction is valid for an
(X,T)doublet, where the charge of the X quark is
+5/3, as well as a (T,B)doublet when a mixing assumption of V
T bV
tBis made [15]. Note that BR(T
→W b) = 0 in the doublet cases. Similarly, Fig. 2(b) shows the branching ratio of a B quark versus mass for the singlet and doublet hypotheses. In the case of a
(T,B) doublet, BR(B
→W t) = 1. Branching ratio values are also shown in Fig. 2(b) for a
(B,Y)doublet, where the charge of the Y quark is
−4/3. The charged-current mode,BR(B
→W t), is absent in this case.
Monte Carlo (MC) simulated samples of leading-order (LO) pair production events were generated for the T T ¯ and B B ¯ hypotheses with
PROTOSv2.2 interfaced with
PYTHIA[43] v6.421 for parton shower and fragmentation, and using the MSTW 2008 LO 68% confidence level (CL) [38] set of PDFs. These samples are normalized using the T
OP++ cross section predictions. The vector-like quarks were decayed
2The branching ratios in Fig. 2 are valid for small mixing between the new heavy quark and the third generation quark. For example, using the mass eigenstate basis notation of Refs. [15, 17, 46], and the relations in Appendix A of Ref. [17],VT b≈XtT
in the limit of small mixing, and hence these mixing parameters cancel when computing branching ratios using the width expressions in Eq. 22 of Ref. [15].
(a)
[GeV]
mQ
400 500 600 700 800 900 1000
[fb]σ
1 10 102
103
104
105
(Top++) Q Q pp →
= 2 (MG) λT
q, b T pp →
= 0.1 (PROTOS) q, VTb
b T pp →
= 0.1 (PROTOS) q, XBb
b B pp →
= 8 TeV s
(b)
Figure 1: A representative diagram (a) illustrating the pair production and decay modes of a vector-like quark (Q
=T,B). The
√s
=8 TeV LHC cross section versus quark mass (b) for pair production, denoted by the solid line, as well as for the T bq ¯ and B bq ¯ single production processes, denoted by dashed lines.
The pair production cross section has been calculated with T
OP++ [37]. The single production cross
sections were calculated with
PROTOS[42] and
MADGRAPH[48] using different electroweak coupling
parameters that are discussed in the text.
[GeV]
mT 300 400 500 600 700 800 900 1000
Branching Ratio
0 0.2 0.4 0.6 0.8 1
Wb T →
Zt T →
Ht T →
Wb T →
Zt T →
Ht T → SU(2) Singlet (X,T) Doublet
(T,B) or
PROTOS
(a)
[GeV]
mB 300 400 500 600 700 800 900 1000
Branching Ratio
0 0.2 0.4 0.6 0.8 1
Wt B →
Zb B →
Hb B →
Wt B →
Zb B →
Hb B →
Wt B → SU(2) Singlet (B,Y) Doublet (T,B) Doublet
PROTOS
(b)
Figure 2: Vector-like T quark branching ratios (a) to the W b, Zt, and Ht decay modes versus the T quark mass, computed with
PROTOS[42] for an SU(2) singlet and two types of doublets. Likewise, vector-like B quark branching ratios (b) to the W t, Zb, and Hb decay modes for a singlet and two types of doublets.
The X quark in an
(X,T
)doublet has charge
+5/3, and theY quark in a
(B,Y)doublet has charge
−4/3.with a branching ratio of 1/3 to each of the three modes ( W,Z,H). Arbitrary sets of branching ratios consistent with the three modes summing to unity are obtained by reweighting the samples using particle- level information. A SM Higgs boson with a mass of 125 GeV is assumed. The primary set of samples span quark masses between 350 GeV and 850 GeV in steps of 50 GeV, and were produced assuming SU
(2)singlet couplings. Additional samples were produced at two mass points (350 and 600 GeV) using SU
(2)doublet couplings in order to confirm that kinematic differences arising from the different chirality of singlet and doublet couplings are negligible in this analysis. The above samples were passed through a fast detector simulation [44], while additional samples with quark masses of 400, 600 and 800 GeV were also produced using full detector simulation [45] to test the agreement.
5.2 Electroweak single production
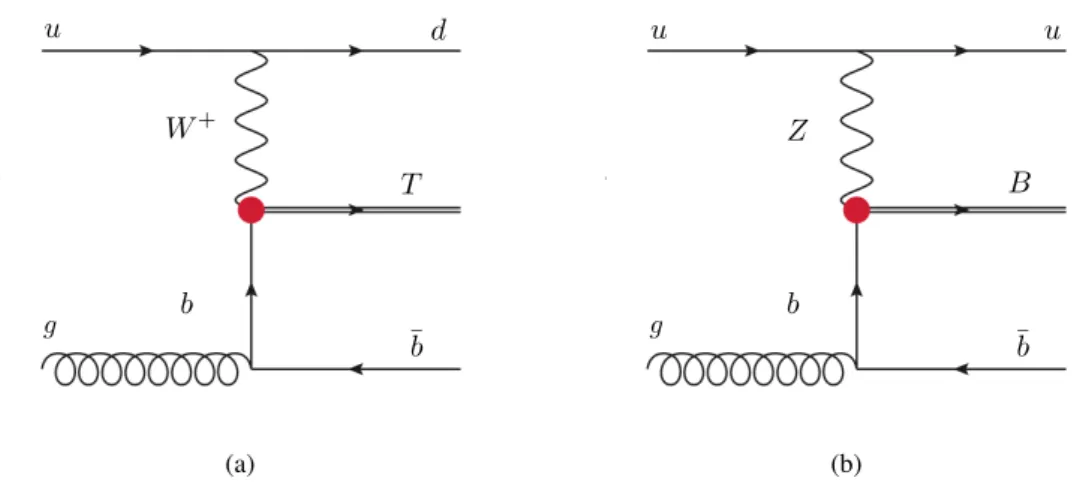
Another source of heavy quark production is singly via the electroweak interaction. The t-channel pro- cess provides the largest contribution, as is also the case for SM single top production at the LHC.
Figures 3(a,b) illustrate the t-channel 2
→3 process (four-flavor scheme) producing a vector-like T and B quark, respectively, in association with a b quark
3and a light-generation quark. Cross sections as a function of the heavy quark mass are also shown in Fig. 1(b) for the T bq ¯ and B bq ¯ processes, with the long-dashed lines indicating the prediction using
PROTOSwith mixing parameter values [15, 17] of V
T b=0.1 and X
bB=0.1, respectively. These reference values were chosen to reflect the magnitude of indirect upper bounds on mixing [17, 46] from precision electroweak data when assuming a single vector-like multiplet is present in the low-energy theory. No kinematic requirements are placed on the b quark or the light-flavor quark produced in association with the heavy quark. The single production cross sections scale quadratically with the mixing parameter.
3t-channel production in association with a top quark is also possible, but the cross section is over an order of magnitude smaller for the same heavy quark mass, and for the same mixing parameter value.
T W+(Z)
u d(u)
b
¯b g
(a)
u
Z
u
B
b
¯b g
(b)
Figure 3: Representative diagrams illustrating the t-channel electroweak single production of (a) a T quark via the T bq ¯ process and (b) a B quark via the B bq ¯ process.
The indirect constraints on the mixing parameters may be relaxed if several multiplets are present in the low-energy spectrum, as would be the case in realistic composite Higgs models [46]. Several authors have emphasized the importance of the single production mechanism in this context [16, 46, 47], in particular, that it could represent a more favorable discovery mode than the pair production mechanism.
Figure 1(b) shows the predicted T bq ¯ cross section in a specific composite Higgs model [47] that was implemented in
MADGRAPHv5 [48] and provided by the model authors. In this model, the W T b vertex is parameterized by the variable
λT, which is related to the Yukawa coupling in the composite sector and the degree of compositeness of the third generation SM quarks
4. The prediction shown corresponds to
λT =2, and values between 1 and 5 were considered in Ref. [47].
Fast simulation samples for the T bq ¯ process were produced for the T singlet of Ref. [47] with
MAD-
GRAPH
. Samples were generated for T masses between 400 and 1050 GeV in 50 GeV steps and setting
λT =2. In addition, samples were generated for
λTbetween 1 and 5 in integer steps at the 700 GeV mass point, in order to study the dependence of the experimental acceptance and the sensitivity to large T widths. Parton-level T bq ¯ samples were also produced with
PROTOSfor several mass and V
T bvalues to check the degree of consistency between the two generators in the kinematic distributions of relevance to this analysis. Fully simulated samples for the B bq ¯ process were produced with
PROTOSfor SU(2) sin- glet B quarks with masses between 400 and 1200 GeV and X
bB=0.1. Parton-level B bq ¯ process samples were also produced for different mixing values, and for a B in a
(B,Y)doublet. The B bq ¯ process is absent in some composite Higgs models [16, 47]. This is not a generic prediction, however, and the B bq ¯ pro- cess may be relevant in the context of a
(B,Y)doublet and corresponding improvements to electroweak fits [17].
6 Background modeling
The SM backgrounds in this analysis are predicted primarily with simulated samples normalized to next-to-leading order or higher cross section calculations. Unless stated otherwise, all samples for SM processes are passed through a full detector simulation. Two leading-order multi-parton event generators,
ALPGEN
[49] and
SHERPA[50], were carefully compared at each stage of the dilepton channel analysis
4The notation of Ref. [47] follows that adopted in Ref. [14], and uses the weak eigenstate basis. For small values ofλT, or large heavy quark masses,VT b≈(λTv)/(√
2MT), withv=246 GeV. See footnote 2 of Ref. [14] for more details.
to provide a robust characterization of the dominant Z+jets background. The cross section normalization of both is set by the NNLO prediction calculated with the
DYNNLOprogram [51].
The
ALPGENZ+jets samples were produced using v2.13 with the CTEQ6L1 [52] PDF set and interfaced to
PYTHIAfor parton-shower and hadronization. Separate inclusive Z+jets and dedicated Z
+c c+jets and ¯ Z
+b b+jets samples were simulated. Heavy flavor quarks in the former arise from ¯ the parton shower, while in the latter they can be produced directly in the matrix element. To avoid double-counting of partonic configurations generated both by the matrix element and the parton shower, a parton-jet matching scheme [53] is employed in the generation of the samples. Likewise, to remove double-counting when combining the inclusive and dedicated heavy flavor samples, another algorithm is employed based on the angular separation between heavy quarks (q
h =c,b). The matrix-element prediction is used if
∆R(qh,q ¯
h)>0.4, and the parton-shower prediction is used otherwise.
The
SHERPAZ+jets samples were produced using v1.4.1 with the CT10 [54] PDF set, and generated setting the charm and bottom quarks to be massive. Filters are used to divide the samples into events containing a bottom hadron, events without a bottom hadron but containing a charm hadron, and events with neither a charm nor a bottom hadron. In this note, the Z+bottom background category corresponds to the bottom hadron filtered samples, while the Z+light category combines those without a bottom hadron. To increase the statistical precision of the prediction at large values of the Z boson transverse momentum, p
T(Z), each hadron filtered sample was produced in differentp
T(Z)intervals: inclusive, 70
−140 GeV, 140
−280 GeV, 280
−500 GeV, and greater than 500 GeV. Samples in the first three ranges are reconstructed with a fast detector simulation while the latter two use full detector simulation.
As a result of the higher statistical precision in the final stages of selection, these
SHERPAsamples constitute the default Z+ jets prediction.
The dominant source of background events in the early selection stages of the trilepton channel analysis arise from Z bosons produced in association with W bosons. The diboson processes ( W Z, ZZ, and WW ) are predicted with
SHERPA, and normalized to NLO cross section predictions obtained with
MCFM
[55]. In the final selection stages of the trilepton analysis, an important source of background events arise from Z bosons produced in association with top quark pairs. The t t ¯
+Vprocesses, where V
=W,Z, are modeled withMADGRAPH[48], using
PYTHIAfor parton shower and hadronization. These samples are also normalized to NLO cross section predictions [56].
Processes that do not contain a Z boson constitute subleading background contributions. Simulated t¯ t events are produced using
POWHEG[57] for the matrix element with the CT10 PDF set. Parton shower and hadronization are performed with
PYTHIA. The t t ¯ cross section is determined by the T
OP++
prediction, computed as in the signal hypothesis, but setting the top quark mass to 172.5 GeV. Samples generated with
MC@
NLO[58] interfaced to
HERWIG[59] are used to estimate the W t and s-channel single top processes, while A
CERMC [60] interfaced to
PYTHIAis used to estimate the t-channel process.
The single top processes are normalized to NLO cross section predictions [61].
Processes that enter the selected Z candidate sample as a result of a fake or non-prompt lepton passing the lepton selection criteria are estimated with data using samples obtained by relaxing or inverting certain lepton identification requirements. Such contributions are found to be less than 5% of the total background in the early stages of event selection and negligible in the final stages.
7 Search strategies
This section outlines the search strategies. The single and pair production signal hypotheses are targeted
in both the dilepton and trilepton channels. A common set of event selection requirements are made first,
and a small number of specific requirements are added to enhance the significance of the dilepton and
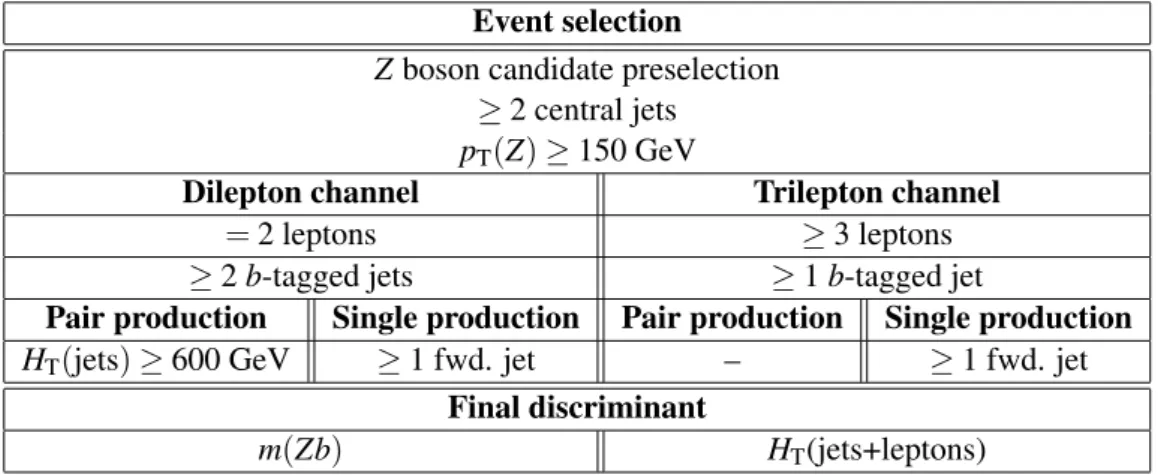
trilepton channels to the single or pair production hypotheses. Table 1 summarizes the selection criteria
for reference.
Event selection
Z boson candidate preselection
≥
2 central jets p
T(Z)≥150 GeV
Dilepton channel Trilepton channel
=
2 leptons
≥3 leptons
≥
2 b-tagged jets
≥1 b-tagged jet
Pair production Single production Pair production Single production
H
T(jets)≥600 GeV
≥1 fwd. jet –
≥1 fwd. jet
Final discriminant
m(Zb) H
T(jets+leptons)
Table 1: Summary of the event selection criteria. Preselected Z boson candidate events are divided into dilepton and trilepton categories. The requirements on the number of central jets and the Z candidate transverse momentum are common to both channels, and for the pair and single production hypotheses.
Other requirements are specific to a lepton channel or the targeted production mechanism. The last row lists the final discriminant used for hypothesis testing.
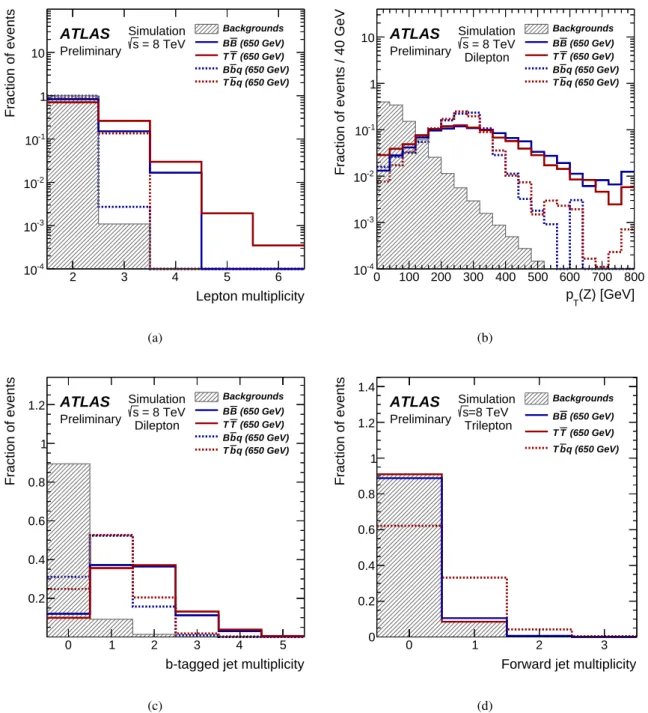
Figure 4 presents unit-normalized distributions of simulated signal and background events in several discriminating variables employed in the event selection. The reference signals correspond to the single and pair production of SU
(2)singlet T and B quarks with a mass of 650 GeV. Figure 4(a) presents the lepton multiplicity distribution after selecting events with a Z boson candidate and at least two central jets. The shapes of the signal and background distributions motivate separate criteria for events with ex- actly two leptons, and those with three or more, with the strategy for the former focused on background rejection, and the strategy for the latter focused on maintaining signal efficiency. The only signal hy- pothesis not expected to produce events with a third isolated lepton is the B(→ Zb) bq ¯ process. The other three processes are capable of producing, in addition to the Z boson, a W boson that decays to leptons.
The W could arise from a top quark decay, or directly from the other heavy quark decay in the case of the pair production signal.
At least two central jets are required in both lepton channels, and when testing both production mechanism hypotheses. The requirement is over 95% efficient for the pair production signals, and over 70% efficient for the single production signals, while suppressing the backgrounds by a factor of 20 and 5 in the dilepton and trilepton channels, respectively. A second common requirement is on the minimum transverse momentum of the Z boson candidate: p
T(Z) >150 GeV. Figure 4(b) presents the p
T(Z)distribution in signal and background dilepton channel events after the Z+
≥2 central jets selection.
Figure 4(c) presents the b-tagged jet multiplicity, also after the Z+
≥2 central jets selection in the dilepton channel. Pair production signal events are expected to yield at least two b jets, whether produced directly from a heavy quark decay, the decay of a top quark, or the decay of a Higgs boson.
Single production signal events also yield two b jets, but the one arising from the b quark produced in association is less often in the acceptance for b-tagging. In order to effectively suppress the large Z+
jets background, dilepton channel events are required to contain at least two b-tagged jets when testing both the single and pair production hypotheses. A requirement of at least one b-tagged jet sufficiently balances signal efficiency and background rejection in the trilepton channel.
Signal events from pair production often produce several energetic jets. The scalar sum of the trans-
verse momentum of all central jets in the event, H
T(jets), is a powerful variable to further reduce the back-ground in the dilepton channel. Selected events in this channel are required to satisfy H
T(jets)>600 GeV
when testing the pair production hypotheses. The transverse momentum of leptons is not included, as
Lepton multiplicity
2 3 4 5 6
Fraction of events
10-4
10-3
10-2
10-1
1 10
ATLAS
Preliminary
Simulation = 8 TeV s
Backgrounds (650 GeV) B B
(650 GeV) T T
q (650 GeV) b
B
q (650 GeV) b
T
(a)
(Z) [GeV]
pT
0 100 200 300 400 500 600 700 800
Fraction of events / 40 GeV
10-4
10-3
10-2
10-1
1
10 ATLAS
Preliminary
Simulation = 8 TeV s
Dilepton
Backgrounds (650 GeV) B B
(650 GeV) T T
q (650 GeV) b
B
q (650 GeV) b
T
(b)
b-tagged jet multiplicity
0 1 2 3 4 5
Fraction of events
0.2 0.4 0.6 0.8 1
1.2 ATLAS
Preliminary
Simulation = 8 TeV s
Dilepton
Backgrounds (650 GeV) B B
(650 GeV) T T
q (650 GeV) b
B
q (650 GeV) b
T
(c)
Forward jet multiplicity
0 1 2 3
Fraction of events
0 0.2 0.4 0.6 0.8 1 1.2 1.4
Backgrounds (650 GeV) B B
(650 GeV) T T
q (650 GeV) b
T
ATLAS
Preliminary s=8 TeV Simulation
Trilepton
(d)
Figure 4: Unit-normalized distributions of signal sensitive variables employed in this analysis. The filled
histograms correspond to SM backgrounds. Unfilled histograms correspond to signal, with solid (dashed)
lines representing pair (single) production of SU
(2)singlet T and B quarks with a mass of 650 GeV. The
rightmost bin in each histogram contains overflow events. Panel (a) shows the lepton multiplicity after a
Z+
≥2 central jets selection. Panel (b) shows the p
T(Z)distribution, and (c) the b-tagged jet multiplicity,
for dilepton channel events. Panel (d) shows the forward jet multiplicity in trilepton events.
(jets+leptons) [GeV]
HT
0 400 800 1200 1600 2000
Fraction of events / 200 GeV
0.1 0.2 0.3 0.4 0.5 0.6 0.7
0.8 Backgrounds
(650 GeV) B B
(650 GeV) T T
q (650 GeV) b
T
ATLAS
Preliminary s=8 TeV Simulation
Trilepton
(a)
m(Zb)[GeV]
0 200 400 600 800 1000 1200 1400
Fraction of events / 50 GeV
0.05 0.1 0.15 0.2 0.25 0.3 0.35
0.4 ATLAS
Preliminary
Simulation = 8 TeV s
Dilepton
Backgrounds (650 GeV) B B
(650 GeV) T T
q (650 GeV) b
B
q (650 GeV) b
T
(b)
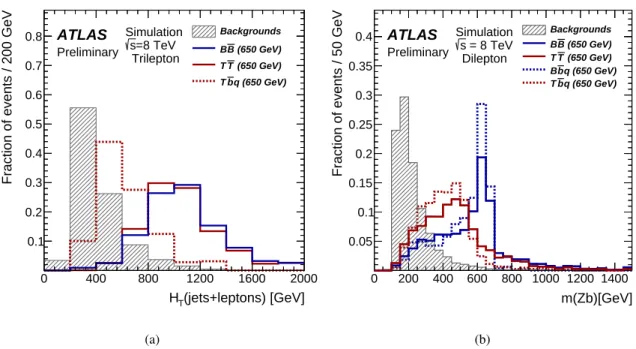
Figure 5: Unit-normalized distributions of the discriminating variables used for hypothesis testing, shown at the Z+
≥2 central jets selection stage: (a) H
T(jets+leptons) in the trilepton channel, and (b) the m(Zb) distribution in the dilepton channel.
the same information is effectively utilized in the p
T(Z)requirement, and it is advantageous to study the jet activity separately. In the trilepton channel, however, the lepton transverse momenta are used in the variable H
T(jets+leptons) to include, in particular, the discriminating power of the transverse momen- tum of the third lepton. Figure 5(a) shows the H
T(jets+leptons) distribution in trilepton events with at least two central jets. A minimum requirement on this variable is not imposed, but rather the full shape is used as the final discriminant for hypothesis testing. The variable provides good separation between the background and pair production signals and, although the separation is not as powerful for the single production hypotheses, the variable becomes increasingly effective for higher quark masses.
The associated light-flavor quark produced in the electroweak single production of heavy quarks gives rise to an energetic forward jet. Figure 4(d) presents the forward jet multiplicity distribution in trilepton channel events after all requirements are made to select events for the pair production hy- potheses. The presence of a forward jet is an additional requirement when testing the single production hypotheses.
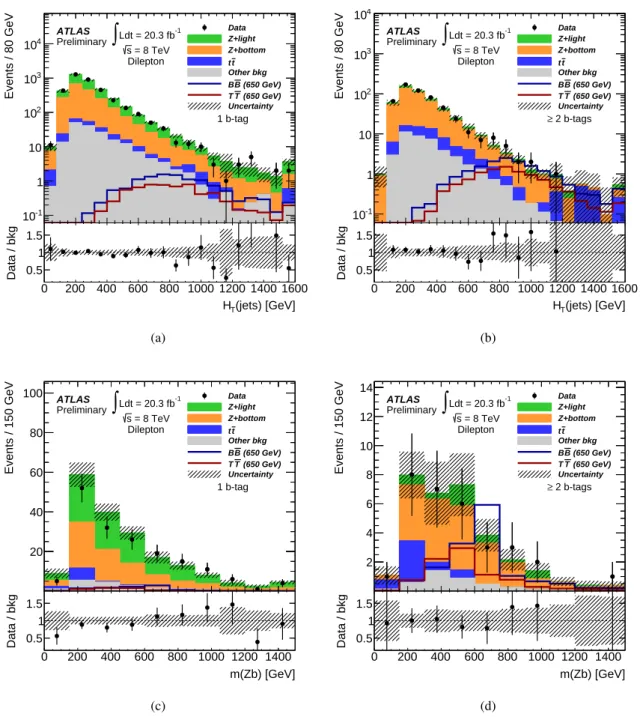
The invariant mass of the Z boson candidate and highest p
Tb-tagged jet, m(Zb), is used as the final discriminant in the dilepton channel, and is shown in Fig. 5(b). The distribution is strongly peaked at the heavy quark mass in the case of a B quark. The distribution peaks at a lower value and is wider in the case of a T quark; both features are consequences of the W boson that is not included in the mass reconstruction. The H
T(jets)requirement is removed and the forward jet requirement is added when testing the single production hypotheses in the dilepton channel.
8 Comparison of the data to the predictions
Section 7 motivated the selection criteria that are applied in the dilepton and trilepton channel analyses
and when considering the single and pair production hypotheses. This section presents the comparison
of the data to the predictions. Section 8.1 presents the dilepton channel analysis, and focuses on the
pair production hypotheses. Section 8.2 presents the trilepton channel analysis, also focusing on the pair production hypotheses. Section 8.3 shows the results of both channels under the modified selection criteria used to test the single production hypotheses.
8.1 Dilepton channel analysis targeting the pair production hypotheses
The preselected sample of Z boson candidate events with exactly two leptons comprises 12.5 million events (5.5 and 7.0 million events in the ee and µµ channels, respectively). These yields are consistent with the predictions within uncertainties, which at this stage of the analysis are less than 5% and domi- nated by the Drell-Yan cross section and acceptance, luminosity, and lepton reconstruction uncertainties.
The predicted distributions of several kinematic variables are observed to agree well with the data, and the sample is then restricted to the subset of events with at least two central jets. This sample comprises 501 thousand events, and is also found to be well described by the
SHERPAand
ALPGENpredictions within the uncertainties, now also including those associated with jet reconstruction.
Events passing the Z+
≥2 central jets selection are then separated according to the number of b- tagged jets in the event (N
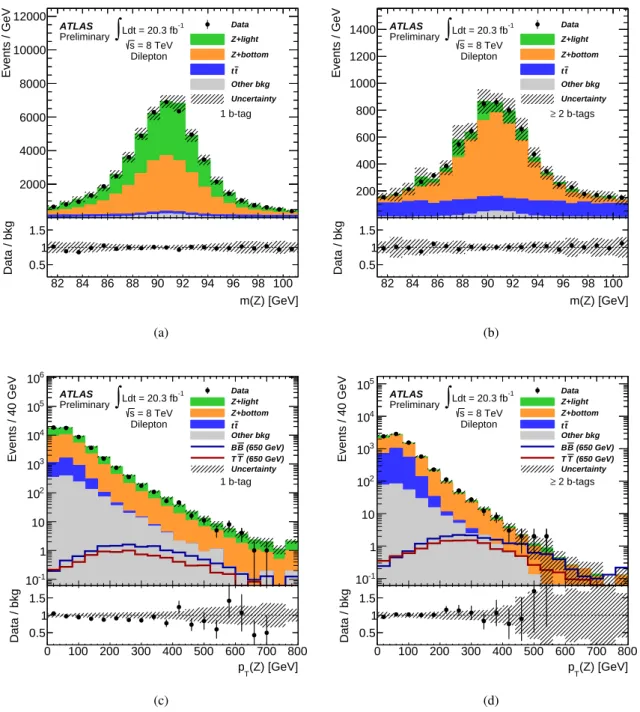
tag). Figure 6(a) shows the Z candidate mass distribution using the
SHERPAZ+ jets prediction in the control region consisting of events with N
tag=1. Table 2 presents the cor- responding event yields, with 51 thousand events observed in data before additional requirements are applied. Figure 6(b) shows the Z candidate mass distribution in the signal region consisting of events with N
tag≥2. Table 3 presents the corresponding yields, with 7.8 thousand events observed before fur- ther requirements are applied. Differences in the predicted yields are observed in both the N
tag=1 and N
tag≥2 categories when using
ALPGENin place of
SHERPA. While the predictions with
SHERPAare consistent with the data within the experimental uncertainties (5
−8%), those withALPGENare systemat- ically low by 20% and 15% in the N
tag=1 and N
tag≥2 categories, respectively. The agreement between data and the prediction outside the 10 GeV mass window, particularly in events with N
tag≥2 where t¯ t events are predicted to contribute significantly, indicates that
ALPGENunderestimates the Z+ jets con- tribution in events with b-tagged jets. Therefore, scaling factors for the Z+ jets prediction are derived at this stage such that the total background prediction matches the data yields in the signal depleted re- gion defined by p
T(Z)<100 GeV. The procedure is performed separately for events with N
tag=1 and N
tag≥2, and is repeated when evaluating the impact of systematic uncertainties. It is also applied to the
SHERPA
prediction, though not necessary a priori, in order that the same data-driven correction methods are applied to both generators.
Figure 6(c) shows the Z boson candidate transverse momentum distribution in events with N
tag=1, again using
SHERPAto model the Z+ jets processes. The expected background is observed to increas- ingly over-predict the data with increasing p
T(Z). This bias would result in a 14% over-prediction of thenumber of N
tag=1 events passing the p
T(Z)>150 GeV requirement, compared with the 8% experimen- tal uncertainty. The trend is likewise observed in the N
tag=0 control region, and also to a similar degree when using the
ALPGENsamples. In order to mitigate this bias, a Z+ jets reweighting function is derived by fitting a third degree polynomial to the residual defined by w
i≡[(Ndata−N
non Z+jetspred )/NZ+jetspred ]i, where i denotes the i
thbin of the p
T(Z)distribution shown in Fig. 6(c). The degree of the polynomial is chosen to accurately fit the trend while avoiding higher order terms that could fit statistical fluctuations. The fit is also performed separately in the dielectron and dimuon channels, and consistent results are obtained.
Table 2 presents the predicted yields in the control region with and without this correction applied. Fig- ure 6(d) shows the p
T(Z)distribution in N
tag≥2 signal region after the correction has been applied. The correction results in a 9% (7%) decrease in the predicted number of events satisfying p
T(Z)>150 GeV when using
SHERPA(
ALPGEN).
Figures 7(a,b) present the H
T(jets)distributions in the N
tag=1 and N
tag≥2 categories, respec-
tively, after applying the p
T(Z)correction and requiring p
T(Z)>150 GeV. The distributions are well
m(Z) [GeV]
82 84 86 88 90 92 94 96 98 100
Events / GeV
2000 4000 6000 8000 10000 12000
ATLAS Preliminary
= 8 TeV s Ldt = 20.3 fb-1
∫
Dilepton
Data Z+light Z+bottom
t t Other bkg Uncertainty 1 b-tag
m(Z) [GeV]
82 84 86 88 90 92 94 96 98 100
Data / bkg 0.5
1 1.5
(a)
m(Z) [GeV]
82 84 86 88 90 92 94 96 98 100
Events / GeV
200 400 600 800 1000 1200 1400 ATLAS
Preliminary
= 8 TeV s Ldt = 20.3 fb-1
∫
Dilepton
Data Z+light Z+bottom
t t Other bkg Uncertainty 2 b-tags
≥
m(Z) [GeV]
82 84 86 88 90 92 94 96 98 100
Data / bkg 0.5
1 1.5
(b)
(Z) [GeV]
pT
0 100 200 300 400 500 600 700 800
Events / 40 GeV
10-1
1 10 102
103
104
105
106
ATLAS Preliminary
= 8 TeV s Ldt = 20.3 fb-1
∫
Dilepton
Data Z+light Z+bottom
t t Other bkg
(650 GeV) B B
(650 GeV) T T Uncertainty 1 b-tag
(Z) [GeV]
pT
0 100 200 300 400 500 600 700 800
Data / bkg 0.5
1 1.5
(c)
(Z) [GeV]
pT
0 100 200 300 400 500 600 700 800
Events / 40 GeV
10-1
1 10 102
103
104
105
ATLAS Preliminary
= 8 TeV s Ldt = 20.3 fb-1
∫
Dilepton
Data Z+light Z+bottom
t t Other bkg
(650 GeV) B B
(650 GeV) T T Uncertainty 2 b-tags
≥
(Z) [GeV]
pT
0 100 200 300 400 500 600 700 800
Data / bkg 0.5
1 1.5
(d)
Figure 6: The Z boson candidate mass, m(Z), in dilepton channel events with
≥2 central jets and (a)
N
tag=1 or (b) N
tag≥2. Panels (c) and (d) show the transverse momentum, p
T(Z), under the sameselection criteria. Panel (c) presents the Z+ jets prediction before the p
T(Z)correction described in the
text is applied, while panel (d) is shown with it applied. Reference signals are displayed for B B ¯ and T T ¯
production assuming SU
(2)singlet quarks with a mass of 650 GeV. The hatched bands in the upper and
lower panels represent the total background uncertainty.
(jets) [GeV]
HT
0 200 400 600 800 1000 1200 1400 1600
Events / 80 GeV
10-1
1 10 102
103
104
ATLAS Preliminary
= 8 TeV s Ldt = 20.3 fb-1
∫
Dilepton
Data Z+light Z+bottom
t t Other bkg
(650 GeV) B B
(650 GeV) T T Uncertainty 1 b-tag
(jets) [GeV]
HT
0 200 400 600 800 1000 1200 1400 1600
Data / bkg 0.5
1 1.5
(a)
(jets) [GeV]
HT
0 200 400 600 800 1000 1200 1400 1600
Events / 80 GeV
10-1
1 10 102
103
104
ATLAS Preliminary
= 8 TeV s Ldt = 20.3 fb-1
∫
Dilepton
Data Z+light Z+bottom
t t Other bkg
(650 GeV) B B
(650 GeV) T T Uncertainty 2 b-tags
≥
(jets) [GeV]
HT
0 200 400 600 800 1000 1200 1400 1600
Data / bkg 0.5
1 1.5
(b)
m(Zb) [GeV]
0 200 400 600 800 1000 1200 1400
Events / 150 GeV
20 40 60 80 100 ATLAS
Preliminary
= 8 TeV s Ldt = 20.3 fb-1
∫
Dilepton
Data Z+light Z+bottom
t t Other bkg
(650 GeV) B B
(650 GeV) T T Uncertainty 1 b-tag
m(Zb) [GeV]
0 200 400 600 800 1000 1200 1400
Data / bkg 0.5
1 1.5
(c)
m(Zb) [GeV]
0 200 400 600 800 1000 1200 1400
Events / 150 GeV
2 4 6 8 10 12 14
ATLAS Preliminary
= 8 TeV s Ldt = 20.3 fb-1
∫
Dilepton
Data Z+light Z+bottom
t t Other bkg
(650 GeV) B B
(650 GeV) T T Uncertainty 2 b-tags
≥
m(Zb) [GeV]
0 200 400 600 800 1000 1200 1400
Data / bkg 0.5
1 1.5
(d)
![Figure 2: Vector-like T quark branching ratios (a) to the W b, Zt, and Ht decay modes versus the T quark mass, computed with PROTOS [42] for an SU(2) singlet and two types of doublets](https://thumb-eu.123doks.com/thumbv2/1library_info/4017005.1541479/7.892.120.776.113.460/figure-vector-branching-ratios-computed-protos-singlet-doublets.webp)