ATLAS-CONF-2016-044 08August2016
ATLAS NOTE
ATLAS-CONF-2016-044
3rd August 2016
Search for new resonances decaying to a Z boson and a photon in 13.3 fb
−1of pp collisions at √
s = 13 TeV with the ATLAS detector
The ATLAS Collaboration
Abstract
This note presents a search for new resonances decaying to aZ boson and a photon. TheZ bosons are identified through their decays to charged, light lepton pairs (e+e−, µ+µ−). The dataset consists of 13.3 fb−1 of pp collisions collected at √
s = 13 TeV with the ATLAS detector at the Large Hadron Collider during 2015 and 2016. The data are found to be consistent with the expected background in the mass range investigated, and upper limits are set on the production cross section times decay branching ratio toZγof a narrow scalar boson with mass between 250 GeV and 2.4 TeV.
c
2016 CERN for the benefit of the ATLAS Collaboration.
Reproduction of this article or parts of it is allowed as specified in the CC-BY-4.0 license.
1 Introduction
Many models of physics beyond the Standard Model (SM) introduce new bosons through either an ex- tension of the Higgs sector or additional gauge fields. As such, a broad experimental survey of physics beyond the SM can be made by searching for new massive bosons. Some models predict that these bosons decay to final states containing the SM electroweakW or Z bosons or photons [1,2]. Attractive decays from an experimental perspective are toγγ[3–5], Zγ [6–8] orZ Z [9,10] final states, since leptonic Z boson decays (especiallye and µdecays) and photons can be well measured with relatively low back- grounds. If such new bosons were produced, the complete reconstruction of these final states could be used to accurately measure their properties, such as their mass.
Previous searches for non-SM bosons decaying into Zγ final states were carried out at the Tevatron and the Large Hadron Collider (LHC). The D0 collaboration has set limits onX →Zγproduction using proton–antiproton (pp) collisions at¯ √
s=1.96 TeV [11]. At the LHC, the ATLAS and CMS collaborations used proton–proton (pp) collision data collected in 2011 and 2012 at √
s = 7 and 8 TeV for X → Zγ searches in the mass range from≈200 GeV to 1.6 TeV [6–8]. Recently, the ATLAS collaboration explored a 13 TeV dataset with 3.2 fb−1 ofppcollisions collected in 2015 for theX →Zγ searches in the mass range from 200 GeV to 1.5 TeV using leptonic Z boson decays and in the mass range from 700 GeV to 2.75 TeV using hadronicZ boson decays [12]. The data were found to be consistent with the expected background in all of these searches and no significant excess has been observed.
This note presents a search for new resonances in the mass range of 250 GeV to 2.4 TeV which decay to Zγ using 13.3 fb−1 of ppcollisions at a centre-of-mass energy of 13 TeV, collected in 2015 and 2016 with the ATLAS detector at the LHC. Events in which theZboson decays to light leptons`+`−(`=e, µ) are considered in this search. This analysis supersedes the one using leptonicZboson decays in Ref. [12]
with a further optimised event selection and categorisation, a wider mass search range and a larger data sample. The note is organised as follows. Section2contains a brief description of the ATLAS detector.
The data and simulation samples used in this study are summarised in Sec.3 and Sec.4, respectively.
The event selection is presented in Sec.5. The signal and background modelling are discussed in Sec.6.
Section7lists the systematic uncertainties. In Sec.8the statistical procedures used to estimate the signal yield in the selected sample, to quantify its significance and to set limits on the signal production cross section are presented. The final results are given in Sec.9with the conclusion summarised in Sec.10.
2 The ATLAS detector
The ATLAS detector is a multi-purpose particle detector with approximately forward-backward symmet- ric cylindrical geometry1. Its original design [13] has been complemented with the installation, prior to the 2015 data taking, of a new innermost silicon pixel layer [14]. A two-level trigger system [15] selects events to be recorded for offline analysis.
1ATLAS uses a right-handed coordinate system with its origin at the nominal interaction point (IP) in the centre of the detector and thez-axis along the beam pipe. The x-axis points from the IP to the centre of the LHC ring, and the y-axis points upward. Cylindrical coordinates (r, φ) are used in the transverse plane,φbeing the azimuthal angle around thez-axis. The pseudorapidity is defined in terms of the polar angleθasη=−ln tan(θ/2).
3 Data sample
The data used in the analysis described in this note were collected with the ATLAS detector duringpp collisions at a centre-of-mass energy of 13 TeV. The sample includes 3.2 fb−1of data collected in 2015 and 10.1 fb−1 of data collected in 2016. The beam bunch spacing was 25 ns and the average number of inelastic interactions per crossing was 14 in 2015 and 21 in 2016.
The search is performed on events recorded using the lowest-threshold unprescaled single-lepton or di- lepton triggers. The single-muon trigger has a nominal transverse momentum (pT) threshold of 26 GeV and a requirement on the track isolation of the muon, which is defined in a similar manner as the offline isolation, described in Sec. 5, but with looser requirements. An additional single-muon trigger with a higherpT threshold (50 GeV) but no isolation requirement is also used. The di-muon trigger has apT threshold of 22 GeV for one muon and 8 GeV for the other muon and applies no isolation criteria for either muon. The single-electron trigger has a nominalpT threshold of 26 GeV and a loose requirement on the track isolation, which is defined in a similar manner as the offline isolation, described in Sec.5, but with looser requirements. Additional single-electron triggers with higherpTthresholds (60 and 140 GeV) but no isolation requirement and looser identification requirements are also used. The di-electron trigger has apT threshold of 17 GeV for both electrons. Electron candidates were required to pass likelihood-based identification criteria looser than those applied offline and described in Sec.5. The electron identification likelihood is computed from the properties of the track reconstructed in the inner detector (ID) and the energy deposited in the electromagnetic (EM) calorimeter.
The trigger efficiency for events satisfying the offline selection criteria described in Sec.5is greater than 99% in theeeγchannel and is about 96% in theµµγchannel due to the reduced geometric acceptance of the muon trigger system.
4 Monte Carlo simulation
Samples of simulated signal and background events are generated with a Monte Carlo (MC) technique.
These samples are used to optimise the selection criteria, quantify the signal efficiency of the final selec- tion and obtain the analytic parametrisation used for the Zγ invariant mass spectra of signal and back- ground.
All MC samples are generated at a centre-of-massppcollision energy of 13 TeV. The samples are passed through a detailed simulation of the ATLAS detector response [16] based on Geant4 [17]. Multiple inelasticppcollisions (denoted as pile-up) are simulated with the soft QCD processes of Pythia8.186 [18]
using the A2 set of tuned parameters (tune) [19] and the MSTW2008LO parton distribution function (PDF) set [20], and are overlaid on each simulated event. The distribution of the number of pile-up events in the simulation is reweighted to match the data. The simulated signals in the detector are passed through the event reconstruction algorithms used for the data. The simulation is corrected to take into account data-simulation differences in photon and lepton efficiencies and energy or momentum resolution, and muon momentum scale. The corrections are obtained from control samples selected in √
s = 13 TeV data.
In the signal simulation, a scalar bosonX is produced inppcollisions via gluon fusion and decayed with an intrinsic width of 4 MeV to a photon and aZboson. This width is much smaller than the experimental resolution, regardless of the resonance mass. Due to the assumed narrow width of the X boson and
to the small contribution of gluon fusion to the non-resonant SM production of Z+γ events [21], the interference between thegg→X → Zγsignal process and the SMgg→Zγbackground is neglected in the simulation. Single samples are produced for differentmX hypotheses between 200 GeV and 2.5 TeV.
The signal samples are generated with POWHEG-BOX version 1 [22,23] interfaced with Pythia8.186 for the underlying event, parton showering and hadronisation. The CT10 [24] PDF set and the AZNLO tune [25] of the underlying event are used.
The background originates mainly from non-resonant production of a prompt photon and a Z boson, with a smaller contribution from production of Z bosons in association with jets (Z+jets), with one jet misidentified as a photon. Z+γ production within the SM is primarily due to radiation of photons from final-state leptons (FSR) or initial-state quarks (ISR). Both SM processes are simulated using the Sherpa generator [26] (version 2.1 for Z+γ and 2.2 for Z+jets), and the matrix elements are calculated using the Comix [27] and OpenLoops [28] generators, whereZ+γproduction is calculated for real emission of up to three partons at leading order (LO) in the strong coupling constantαs and merged with the Sherpa parton shower [29] using the ME+PS@LO prescription [30]. The process of Z+jets is calculated for up to two partons at next-to-leading order (NLO) and four partons at LO and merged with the parton shower using the ME+PS@NLO prescription [31]. For all the background samples, the CT10 PDF set is used in conjunction with dedicated parton shower tuning developed by the Sherpaauthors. TheZ+γ samples are generated in binned ranges of the transverse momentum of the photon to ensure precision of the predictions over the full spectrum relevant for this analysis. Similarly,Z+jets events are generated in binned ranges of transverse momentum of the di-lepton pair from theZ boson decay.
5 Event selection
Events with at least one primary vertex candidate reconstructed from two or more tracks with pT >
400 MeV are selected. In each event, the primary vertex candidate with the largest sum of thep2Tof the associated tracks is chosen as the hard-interaction primary vertex.
Events are required to contain at least one photon candidate and one Z boson candidate. The Z boson candidate is formed from a pair of opposite-sign, same-flavour leptons. In the following, the selection of photons, leptons and of the finalX →Zγcandidates is described.
Photons and electrons are reconstructed from clusters of energy deposits in the EM calorimeter cells found by a sliding-window algorithm and from tracks reconstructed in the ID and extrapolated to the calorimeter [32, 33]. A multivariate regression algorithm [34] is used to calibrate electron and photon energy measurements. Corrections are made for the energy deposited in front of the calorimeter and outside the cluster, as well as to account for the variation of the energy response as a function of the impact point on the calorimeter.
Photon candidates are required to have a pseudorapidity within the regions where the first calorimeter layer has high granularity, namely |η| < 1.37 or 1.52 < |η| < 2.37. Photon candidates can broadly be classified into two categories, unconverted and converted, the former being those whose cluster does not match to a track in the ID while the latter are associated with ID tracks consistent with originating from a conversion. The transverse momentum of photon candidates is initially required to pass a loose preselection, pT > 10 GeV, whereas the final photon pT requirement is applied when a Zγ candidate is reconstructed, as described later. The efficiency of the identification criteria is about 98% for converted photon candidates and 94% for unconverted ones of pT > 100 GeV. Background from hadronic jets is
further reduced by requiring the transverse isolation energyET,iso[35] of the photon candidates in a cone of∆R=p
(∆η)2+(∆φ)2=0.4 around the photon direction to be less than 2.45 GeV+0.022× pT. Electron candidates are required to havepT > 19 GeV and |η| < 2.47, excluding the transition region between the barrel and endcaps in the EM calorimeter (1.37 < |η| < 1.52). To suppress the background from hadronic jets misidentified as electrons, electron candidates are required to pass likelihood-based identification criteria [36]. Such requirements provide approximately 85% identification efficiency for electrons with a transverse momentum of 20 GeV, increasing to 95% forpT >80 GeV.
Muons with |η| < 2.5 are reconstructed by combining tracks in the ID and in the muon spectrometer (MS) [37]. The acceptance is extended in the region 2.5 < |η| < 2.7 by selecting also muons for which the trajectory is reconstructed only in the MS. Muon candidates are required to have transverse momentum above 24 GeV for the higher–pT muons and above 10 GeV for the lower–pT muons. Background muons originating mainly from pion and kaon decays, as well as hadrons reconstructed as muons, are rejected by applying a set of quality requirements on the number of hits in the MS and (for |η| < 2.5) on the compatibility between the ID and MS momentum measurements. The muon identification efficiency is around 97% for transverse momenta above 10 GeV.
If two electron candidates share the same track, or have clusters in the calorimeter closer than |∆η| <
0.075 and |∆φ| < 0.125, only the candidate with the highest energy measured by the calorimeter is kept.
In addition, if the track associated to an electron candidate is within a distance∆R<0.02 from the track associated to a muon candidate, the electron candidate is rejected.
Track isolation requirements are also applied to the selected leptons. For electrons, the criterion is applied on theP
trackspT, in a cone of radius∆R =0.2 for electrons with transverse momentapT < 50 GeV and of radius∆R= (10 GeV)/pT forpT > 50 GeV. In the calculation of the track isolation, the contribution from the electron track itself is not included. The criterion is chosen to provide an efficiency of about 99%, independently of the electron transverse momentum and pseudorapidity, as determined using a control sample of Z → e+e− decays selected with a tag-and-probe technique [36]. For muons, the criterion is applied on theP
trackspTinside a cone of radius∆R=0.3 for muons with transverse momenta pT < 33 GeV and of radius ∆R = (10 GeV)/pT for pT > 33 GeV. The efficiency of this criterion increases with the muon transverse momentum, reaching 95% at 25 GeV and 99% at 60 GeV, as measured inZ→ µ+µ− events selected with a tag-and-probe method [37].
After the selection of photons and leptons, theZγcandidate is chosen. In case of multiple photon candid- ates, only the photon candidate with the highest transverse momentum is kept. OnlyZ →`+`−candidates with the invariant massm`` within±15 GeV of the Z boson pole mass [38] are retained; in the case of multiple candidates, only the di-lepton candidate with an invariant mass closest to theZ boson mass is kept. Moreover, the triggering leptons are required to match one of theZ candidate’s leptons, or both in the case of events collected with di-lepton triggers.
The invariant mass,mZγ, of the selectedZγcandidates is computed from the four-momenta of the photon candidate and the selected leptons. The four-momentum of the photon is recalculated using the identified primary vertex as the origin of the photon, and the four-momenta of the leptons are corrected for collinear FSR (muons only) and are finally recomputed by means of aZ-mass-constrained kinematic fit. The Z- mass-constrained kinematic fit improves the final mass resolution by 15% atmX = 200 GeV, rising to 20% atmX =2.5 TeV for Z → µ+µ− decays. ForZ →e+e− decays the resolution improvement is 16%
atmX =200 GeV, but this decreases with mass and the benefit becomes negligible above 1.5 TeV.
Finally, only candidates for which the photon transverse momentum is larger than 30% of mZγ are re- tained. This requirement exploits the isotropic distribution of the decay products of a spin-0 particle in its centre-of-mass frame.
To further enhance the sensitivity of the analysis, the selected events are classified into two categories based on the lepton flavours, due to different signal resolutions and experimental systematic uncertainties as shown in Sec.7. In the Z → e+e− category, the signal resolution ranges from 2 GeV for mX = 200 GeV (1% relative resolution) to 15 GeV formX =2.5 TeV (0.6%), and in the Z → µ+µ− category, the corresponding signal resolution ranges from 2 GeV formX = 200 GeV (1%) to 35 GeV formX = 2.5 TeV (1.4%). The resolution difference between the two categories becomes larger as the mass of the resonance increases.
6 Signal and background models
The final discrimination between signal and background events is achieved by means of an unbinned maximum-likelihood fit of a signal plus background model to the distribution ofmZγ in data. Both the signal and background models are parameterised with analytic functions.
6.1 Signal model
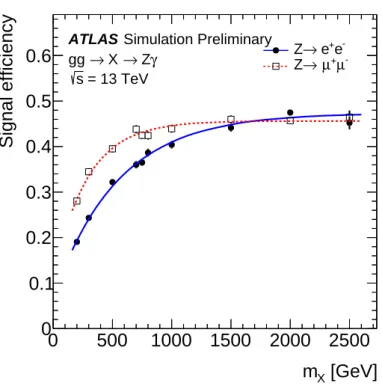
Figure1illustrates the distributions of mZγ in the two categories for simulated signal events produced with a resonance mass of 800 GeV. The intrinsic width of the simulated resonance is 4 MeV, negligible compared to the experimental resolution. ThemZγdistribution can be well modelled with a double-sided Crystal Ball function (a Gaussian function with power-law tails on both sides). Polynomial paramet- erisations of the signal shape parameters as a function of the resonance mass mX are obtained from a simultaneous fit to the invariant mass distributions of all simulated signal samples for each Z boson de- cay channel. The signal efficiency as a function ofmX is computed by interpolating the efficiencies of all the simulated signal samples up tomX = 2.5 TeV with a function of the forma+bec mX. As shown in Fig.2, the signal selection efficiency ranges between 19% formX =200 GeV and 47% formX =2.5 TeV for theZ →e+e− decay channel, and between 26% formX =200 GeV and 46% formX =2.5 TeV for theZ →µ+µ−decay channel,
6.2 Background model
The main background arises from continuum production of aZ boson in association with a photon and to a lesser extent from the Z+jets process where a hadronic jet is misidentified as a photon. A very large simulated sample (up to one thousand times more events than in data) is obtained by passing the events generated by Sherpathrough a fast simulation of the detector response [39]. The shape of themZγ distribution of the lower-statistics simulatedZ+γ events described in Sec.4agrees well with that of this parametric simulation.
The mZγ distribution of Z+jets events is obtained by reweighting the mZγ distribution of the high- statistics Z +γ sample by a second-order polynomial function dependent onmZγ. The parameters of this function are determined from a fit to the ratio of the mZγ distributions of a Z+jets enriched data control sample and of the parameterised simulation ofZ+γevents.
[GeV]
γ
mZ
750 800 850
]-1 [GeV γZ1/N dN/dm
0 0.01 0.02 0.03 0.04 0.05 0.06 0.07
0.08 ATLAS Simulation Preliminary γ
→ Z
→ X gg
= 800 GeV mX
= 13 TeV s
e-
e+
→ Z→µ+µ-
Z
Figure 1: Invariant mass distribution forX → Zγ,Z →e+e−(full circles) orZ → µ+µ− events (open squares) in a simulation of a narrow resonanceXwith a mass of 800 GeV produced in a gluon-fusion process in√
s=13 TeV ppcollisions. All selection requirements have been applied. The blue solid (red dashed) lines represent the fits of the points with a double-sided Crystal Ball function.
The shape of the total background is obtained by summing together the invariant mass distributions of Z+γandZ+jets simulated events, normalised according to their relative fractions measured in data (90%
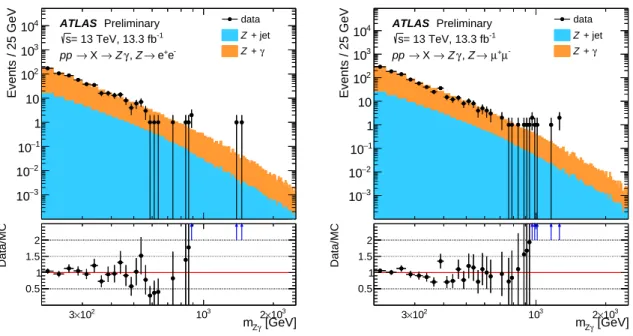
and 10%, respectively). These fractions are determined by means of a simultaneous fit of the ET,iso distributions of the photon candidates passing or failing the identification requirements. Figure3shows the comparison between data and simulation of the``γinvariant mass distribution for theZ →e+e−and Z →µ+µ−events, respectively. There is good agreement between data and the expected SM background contribution.
The mZγ spectrum of the total background exhibits a smoothly falling spectrum that is parameterised with a function similar to the one used in previous searches in theγ+jet and di-photon final states [5,40]:
fbkg(x)=N(1−xk)p1xp2. (1) Herex =mZγ/√
s, the exponentkis set to 1/3,N is a normalisation factor, andp1andp2are dimension- less shape parameters. The parametersN,p1andp2are fitted to the data. This parameterisation has been chosen as it satisfies the following two requirements: (i) the bias on the fitted signal due to the choice of this functional form is estimated to be sufficiently small compared to the statistical uncertainties from the background, and (ii) the addition of further degrees of freedom to Eq. (1) does not lead to a significant improvement in the goodness of the fit to the data distribution.
The bias is checked by performing signal+background fits to the high-statistics background control samples, scaled to the luminosity of the data, as illustrated in Figure 3. The fitted signal yield Nspur
[GeV]
mX
0 500 1000 1500 2000 2500
Signal efficiency
0 0.1 0.2 0.3 0.4 0.5 0.6
Simulation Preliminary ATLAS
γ
→ Z
→ X gg
= 13 TeV s
e-
e+
→ Z→µ+µ-
Z
Figure 2: Selection efficiency for simulated signal events in which Z bosons decay to e+e− (full circles), and µ+µ− (open squares), as a function of the resonance mass mX. The solid line and the dashed line represent the corresponding interpolations with a smooth function (of the typea+bec mX) of the selection efficiency .
(spurious signal in the following) is required to be less than 20% of its statistical uncertainty in the analysis [41]. F-test to check whether the degrees of freedom of the chosen function are sufficient to ac- curately describe the background distribution in data is performed by comparing the goodness of the fits to the data using either the nominal background function or a function with one or two additional degrees of freedom. A test statisticΛ12to discriminate between two background models f1and f2is built. This uses the χ2and number of degrees of freedom computed from a binned comparison between the data and the fit, for the fits performed to data using either f1or f2. The simpler model f1is then rejected in favour of f2if the probability of finding values ofΛ12more extreme than the one measured in data is lower than 5%. No significant improvement in goodness of fit over the model of Eq. (1) is found when adding one or two extra degrees of freedom to it.
7 Systematic uncertainties
The systematic uncertainty on the measurement of σ(pp → X) × BR(X → Zγ) = Nsig/(εLint) has contributions from uncertainties in the integrated luminosityLintof the analysed data, the estimated signal yield Nsig and efficiency ε. The systematic uncertainties make a small contribution to the final result, which is dominated by the statistical uncertainties.
Integrated luminosity uncertainties of±2.1% and±3.7% for 2015 and 2016, respectively, are derived, following a methodology similar to that detailed in Ref. [42]. The uncertainties in the signal yield arise
(GeV)
γ
Mll
103
Events / 25 GeV
−3
10
−2
10
−1
10 1 10 102
103
104 data
+ jet Z
γ + Z Preliminary
ATLAS
= 13 TeV, 13.3 fb-1
s
e-
e+
→ Z γ,
→Z
→ X pp
[GeV]
γ
mZ 102
×
3 103 2×10³
Data/MC
0.5 1 1.5
2 Mllγ(GeV)
103
Events / 25 GeV
−3
10
−2
10
−1
10 1 10 102
103
104
data + jet Z
γ + Z Preliminary
ATLAS
= 13 TeV, 13.3 fb-1
s
µ-
µ+
→ Z γ,
→Z
→ X pp
[GeV]
γ
mZ 102
×
3 103 2×10³
Data/MC
0.5 1 1.5 2
Figure 3: Data and MC comparison of the invariant mass distributions for X → Zγ, for Z → e+e− (left) and Z → µ+µ− events (right), where the black dots are data, the blue and orange histograms are the background contributions from Z+γand Z+jets processes, respectively. The bottom panels show the ratio of the data to the sum of the invariant mass distributions ofZ+γandZ+jets and the blue arrows indicate bins for which the value is out of scale.
from the choice of the background functional forms as well as the parameters of the signal model. Ef- fects from the choice of background function on the signal yield are quantified with the spurious signal yield as described in Sec.6.2. The uncertainties in the signal model parameters, which are determined from the simulation, arise from the uncertainties in the energy scales and resolutions of the final state particles, including photons, electrons and muons. Contributions to the uncertainty of the signal detection efficiency εoriginate from the trigger and the reconstruction, identification and isolation requirements on the selected final state particles. There is also a contribution from the kinematic requirements used to select the final state particles due to uncertainties on the energy scale and resolution.
The effects of the lepton and photon trigger, reconstruction, identification and isolation efficiency un- certainties are estimated by varying the simulation-to-data efficiency correction factors within their±1σ uncertainties and recalculating the signal efficiency. The impact of the lepton and photon energy scale and resolution uncertainties is estimated by computing the relative change in efficiency and in the pos- ition and the width of the invariant mass distribution of the signal after varying these quantities within their uncertainties in the simulation. The dominant effect is the resolution uncertainty of the signal shape arising from the electron and photon energy resolution uncertainty. The impact ranges from 11% to 33%
in the Z → e+e− channel and from 11% to 25% in the Z → µ+µ− channel over themX range from 250 GeV to 2.4 TeV. The other contributions include 2% from photon identification in both channels, 1%
from electron identification, as well as 1% from reconstruction efficiency for the Z →e+e− channel and 1.5% from muon trigger efficiency for theZ → µ+µ− channel. The uncertainties from other sources are very small (<0.5%).
8 Statistical procedure
A profile-likelihood-ratio method [43] is used to search for a localised excess over the SM background in the mZγ distribution of the data, to quantify its significance or to set limits on the signal cross sec- tion. The extended likelihood functionL(α,θ) is given by the product of a Poisson term, the values of the probability density function f(mZγ,θ) of the invariant mass evaluated for each candidate event and constraint termsG(θ):
L
(α,θ){miZγ}i=1..n
= e−N(α,θ)Nn(α,θ) n!
Yn
i=1
f(miZγ, α,θ) ×G(θ), (2)
The parameter of interest (POI)αrepresentsσ×BR,θarenuisance parameters,nis the observed number of events, the expected event yieldNis the sum of the number of observed signal eventsNsig, the number of background events Nbkg, and the bias on the signal yield Nspur due to the choice of the background model as described in Sec.6.2.
The function f(miZγ, α,θ) is built from the signal and background probability density functions of the mZγdistribution fsigand fbkg:
f(miZγ, α,θ) = 1 N
h Nsig(mX, α,θsig)+Nspur(mX)θspur
(3)
×fsig(miZγ,θsig)+Nbkg × fbkg(miZγ,θbkg)i .
The uncertainties on the signal parametrisation, efficiency and bias on the signal yield due to the choice of the background model are included in the fit via some of the nuisance parameters and are constrained with Gaussian or log-normal penalty terms for signal modelling and a Gaussian penalty term for the background model uncertainty.
The significance of the signal is estimated by computing thep-value of the compatibility of the data with the background-only hypothesis (p0). A modified frequentist (C Ls) method [44] is used to set upper limits on the signal cross section times branching ratio at 95% confidence level (CL), by identifying the value ofσ× BRfor whichC Ls is equal to 0.05.
Closed-form asymptotic formulae [43] are used to derive the results. Due to the small size of the selected dataset and of the expected background for large values ofmX, the results for some values ofmX across the full tested range are checked using ensemble tests. The results obtained using the asymptotic formulae are in good agreement with those from the ensemble tests in the low mass region, but are lower (10-30%) in the highmZγregions which have no observed event.
9 Results
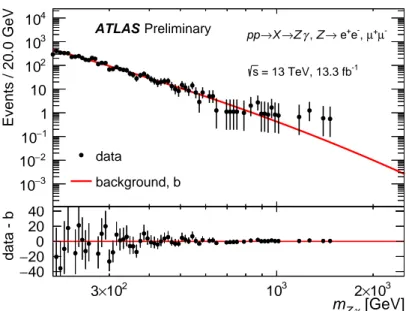
In the data there are 306 (485) candidates withmZγ >200 GeV in the Z →e+e− (Z → µ+µ− ) channel where the largest invariant mass ismZγ =1.5 (1.3) TeV. The invariant mass distribution of selected Zγ candidates in data are shown in Figure4. The solid line represents the results of a background-only fit.
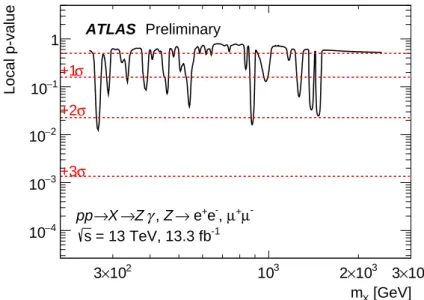
There is no significant excess with respect to the background-only hypothesis and, as shown in Figure5, the largest deviation is observed aroundmX =268 GeV (2.2σlocal significance).
[GeV]
γ
mZ
102
×
3 4×10² 103 2×10³
Events / 20.0 GeV
−3
10
−2
10
−1
10 1 10 102
103
104
data
b background,
µ-
µ+ -,
+e
→ e Z γ,
→Z
→X pp
= 13 TeV, 13.3 fb-1
s Preliminary ATLAS
[GeV]
γ
mZ
102
×
3 103 2×10³
data - b
−4020
− 0 20 40
Figure 4: Distribution of the reconstructedZγinvariant mass in events including theZ boson decays to electrons and muons. The solid lines show the results of background-only fits to the data. The residuals of the data points with respect to the fit are also shown.
[GeV]
mX
102
×
3 103 2×10³ 3×10³
Local p-value
−4
10
−3
10
−2
10
−1
10
1 ATLAS Preliminary σ
+1 σ +2
σ +3
µ-
µ+ -,
+e
→ e Z γ,
→Z
→X pp
= 13 TeV, 13.3 fb-1
s
Figure 5: Observedp0 (p-value of the data with respect to the background-only hypothesis) as a function of the mass of a narrow scalar boson decaying toZγ, usingZ bosons reconstructed in decays to electrons and muons. A mass step of 2 GeV is used.
The observed and expected limits as a function ofmX is shown in Figure6. Upper limits at 95% CL on σ(pp→ X) × BR(X → Zγ) are set, for a resonanceX with massmX between 250 GeV and 2.4 TeV.
The search is performed over this mass range, which is smaller than the total fit range (200 GeV to 2.5 TeV), to take into account the experimental resolution. The observed limits range between 215 fb for mX = 270 GeV and 5 fb for mX = 2.4 TeV, while the expected limits range between 103 fb for
mX =250 GeV and 5 fb formX =2.4 TeV.
The results are dominated by the statistical uncertainty. The main contributions to the systematic uncer- tainty arise from the uncertainty on the photon and electron energy resolution, from the spurious signal and from the luminosity uncertainty. These effects worsen the search sensitivity of the analysis by only 1.0%–0.1%, 0.4%–0.1% and 0.1%, respectively, over themX range from 250 GeV to 2.4 TeV.
[GeV]
mX
102
×
3 103 2×10³ 3×10³
)[fb]γZ→ BR(X×σ 95% CL limit on
1 10 102
103
Observed Expected
σ
± 1 σ
± 2 Preliminary
ATLAS
µ-
µ+ -,
+e
→e γ, Z
→Z
→X pp
= 13 TeV, 13.3 fb-1
s
Figure 6: Observed (solid lines) and median expected (dashed lines) 95% CL limits on the product of the production cross section times the branching ratio for the decay to a Z boson and a photon of a narrow scalar boson X, σ(pp→X)×BR(X → Zγ), as a function of the boson massmXin the mass range of 250 GeV – 2.4 TeV. A mass step of 2 GeV is used. The green and yellow solid bands correspond to the±1σand±2σintervals for the expected upper limit, respectively.
10 Conclusion
A search for new resonances with masses between 250 GeV and 2.4 TeV decaying to a photon and aZ boson has been performed using 13.3 fb−1of proton–proton collision data at a centre-of-mass energy of
√s = 13 TeV collected by the ATLAS detector at the Large Hadron Collider. The Z bosons have been reconstructed through their decays to charged, light lepton pairs (e+e−, µ+µ−).
No significant excess in the measured invariant mass distribution of the final state particles was found over the smoothly falling background from SM processes. The largest deviation from the background- only hypothesis is found for masses around 268 GeV and corresponds to a local significance of 2.2σfor a scalar boson with a narrow width (4 MeV) produced by a gluon fusion process.
Upper limits at 95% CL using a profile likelihood method have been set. The observed limits of pro- duction cross section times decay branching ratio to Zγ of such a boson range between 215 fb for mX = 270 GeV and 5 fb for mX = 2.4 TeV, while the expected limits range between 103 fb for mX =250 GeV and 5 fb formX =2.4 TeV.
References
[1] E. Eichten and K. Lane,Low-scale technicolor at the Tevatron and LHC, Phys. Lett. B669(2008) 235, arXiv:0706.2339 [hep-ph].
[2] I. Low, J. Lykken and G. Shaughnessy,
Singlet scalars as Higgs imposters at the Large Hadron Collider,Phys. Rev. D84(2011) 035027, arXiv:1105.4587 [hep-ph].
[3] ATLAS Collaboration,Search for high-mass diphoton resonances in pp collisions at√
s =8TeV with the ATLAS detector,Phys. Rev. D92(2015) 032004, arXiv:1504.05511 [hep-ex].
[4] CMS Collaboration,Search for diphoton resonances in the mass range from 150 to 850 GeV in pp collisions at√
s=8 TeV,Phys. Lett. B750(2015) 494, arXiv:1506.02301 [hep-ex].
[5] ATLAS Collaboration,
Search for resonances in diphoton events at√
s=13 TeV with the ATLAS detector, (2016), arXiv:1606.03833 [hep-ex].
[6] ATLAS Collaboration,Measurements of Wγand Zγproduction in pp collisions at√
s=7TeV with the ATLAS detector at the LHC,
Phys. Rev. D87(2013) 112003, [Erratum: Phys. Rev. D91 (2015) 119901], arXiv:1302.1283 [hep-ex].
[7] ATLAS Collaboration,Search for new resonances in Wγand Zγ final states in pp collisions at
√s =8TeV with the ATLAS detector,Phys. Lett. B738(2014) 428, arXiv:1407.8150 [hep-ex].
[8] CMS Collaboration,Search for scalar resonances in the 200-500 GeV mass range decaying into a Z and a photon in pp collisions at√
s=8TeV, CMS-PAS-HIG-14-031 (2015), url:http://cds.cern.ch/record/1997885.
[9] CMS Collaboration,
Search for exotic resonances decaying into W Z/Z Z in pp collisions at√
s=7TeV, JHEP1302(2013) 036, arXiv:1211.5779 [hep-ex].
[10] ATLAS Collaboration,Combination of searches for W W , W Z, and Z Z resonances in pp collisions at√
s=8TeV with the ATLAS detector,Phys. Lett. B755(2016) 285, arXiv:1512.05099 [hep-ex].
[11] D0 Collaboration, V. M. Abazov et al,
Search for a scalar or vector particle decaying into Zγ in pp collisions at¯ √
s=1.96 TeV, Phys. Lett. B671(2009) 349, arXiv:0806.0611 [hep-ex].
[12] ATLAS Collaboration,Search for heavy resonances decaying to a Z boson and a photon in pp collisions at√
s=13TeV with the ATLAS detector, (2016), arXiv:1607.06363 [hep-ex].
[13] ATLAS Collaboration,The ATLAS Experiment at the CERN Large Hadron Collider, JINST3(2008) S08003.
[14] ATLAS Collaboration,ATLAS Insertable B-Layer Technical Design Report, ATLAS-TDR-19, 2010,url:http://cds.cern.ch/record/1291633,
ATLAS Insertable B-Layer Technical Design Report Addendum, ATLAS-TDR-19-ADD-1, 2012,
URL:http://cds.cern.ch/record/1451888.
[15] ATLAS Collaboration,2015 start-up trigger menu and initial performance assessment of the ATLAS trigger using Run-2 data, ATL-DAQ-PUB-2016-001 (2016),
url:http://cds.cern.ch/record/2136007.
[16] ATLAS Collaboration,The ATLAS Simulation Infrastructure,Eur. Phys. J. C70(2010) 823, arXiv:1005.4568 [physics.ins-det].
[17] S. Agostinelli et al., GEANT4 Collaboration,GEANT4 - a simulation toolkit, Nucl. Instrum. Methods A506(2003) 250.
[18] T. Sjöstrand, S. Mrenna, P. Z. Skands,A Brief Introduction to PYTHIA 8.1, Comput. Phys. Commun.178(2008) 852, arXiv:0710.3820 [hep-ph].
[19] ATLAS Collaboration,Summary of ATLAS Pythia 8 tunes, ATL-PHYS-PUB-2012-003 (2012), url:http://cds.cern.ch/record/1474107.
[20] A. D. Martin et al.,Parton distributions for the LHC,Eur. Phys. J. C63(2009) 189, arXiv:0901.0002 [hep-ph].
[21] M. Grazzini et al.,Zγproduction at hadron colliders in NNLO QCD, Phys. Lett. B731(2014) 204, arXiv:1309.7000 [hep-ph].
[22] S. Alioli et al.,A general framework for implementing NLO calculations in shower Monte Carlo programs: the POWHEG BOX,JHEP1006(2010) 043, arXiv:1002.2581 [hep-ph].
[23] E. Bagnaschi et al.,
Higgs production via gluon fusion in the POWHEG approach in the SM and in the MSSM, JHEP1202(2012) 088, arXiv:1111.2854 [hep-ph].
[24] H.-L. Lai et al.,New parton distributions for collider physics,Phys. Rev. D82(2010) 074024, arXiv:1007.2241 [hep-ph].
[25] ATLAS Collaboration,Measurement of the Z/γ∗ boson transverse momentum distribution in pp collisions at√
s=7 TeV with the ATLAS detector,JHEP1409(2014) 145, arXiv:1406.3660 [hep-ex].
[26] T. Gleisberg et al.,Event generation with SHERPA 1.1,JHEP0902(2009) 007, arXiv:0811.4622 [hep-ph].
[27] T. Gleisberg and S. Höche,Comix, a new matrix element generator,JHEP0812(2008) 039, arXiv:0808.3674 [hep-ph].
[28] F. Cascioli, P. Maierhöfer and S. Pozzorini,Scattering Amplitudes with Open Loops, Phys. Rev. Lett.108(2012) 111601, arXiv:1111.5206 [hep-ph].
[29] S. Schumann and F. Krauss,
A Parton shower algorithm based on Catani-Seymour dipole factorisation, JHEP0803(2008) 038, arXiv:0709.1027 [hep-ph].
[30] S. Höche et al.,QCD matrix elements and truncated showers,JHEP0905(2009) 053, arXiv:0903.1219 [hep-ph].
[31] S. Höche et al.,QCD matrix elements+parton showers: The NLO case,JHEP1304(2013) 027, arXiv:1207.5030 [hep-ph].
[32] ATLAS Collaboration,Measurement of the photon identification efficiencies with the ATLAS detector using LHC Run-1 data, (2016), arXiv:1606.01813 [hep-ex].
[33] ATLAS Collaboration,Electron efficiency measurements with the ATLAS detector using the 2012 LHC proton-proton collision data, ATLAS-CONF-2014-032 (2014),
url:http://cds.cern.ch/record/1706245.
[34] ATLAS Collaboration,
Electron and photon energy calibration with the ATLAS detector using LHC Run 1 data, Eur. Phys. J. C74(2014) 3071, arXiv:1407.5063 [hep-ex].
[35] ATLAS Collaboration,Measurement of isolated-photon pair production in pp collisions at
√s =7TeV with the ATLAS detector,JHEP1301(2013) 086, arXiv:1211.1913 [hep-ex].
[36] ATLAS Collaboration,Electron efficiency measurements with the ATLAS detector using the 2015 LHC proton-proton collision data, ATLAS-CONF-2016-024 (2016),
url:http://cds.cern.ch/record/2157687.
[37] ATLAS Collaboration,Muon reconstruction performance of the ATLAS detector in proton–proton collision data at√
s=13 TeV,Eur. Phys. J. C76(2016) 292, arXiv:1603.05598 [hep-ex].
[38] K. A. Olive et al.,Review of Particle Physics,Chin. Phys. C38(2014) 090001.
[39] ATLAS Collaboration,
The simulation principle and performance of the ATLAS fast calorimeter simulation FastCaloSim, ATL-PHYS-PUB-2010-013 (2010),url:http://cds.cern.ch/record/1300517.
[40] ATLAS Collaboration,Search for new phenomena in photon+jet events collected in proton–proton collisions at√
s=8TeV with the ATLAS detector,Phys. Lett. B728(2014) 562, arXiv:1309.3230 [hep-ex].
[41] ATLAS Collaboration,Measurement of Higgs boson production in the diphoton decay channel in pp collisions at center-of-mass energies of 7 and 8 TeV with the ATLAS detector,
Phys. Rev. D90(2014) 112015, arXiv:1408.7084 [hep-ex].
[42] ATLAS Collaboration,Improved luminosity determination in pp collisions at√
s=7 TeV using the ATLAS detector at the LHC,Eur. Phys. J. C73(2013) 2518, arXiv:1302.4393 [hep-ex].
[43] G. Cowan et al.,Asymptotic formulae for likelihood-based tests of new physics, Eur. Phys. J. C71(2011) 1554, [Erratum: Eur. Phys. J.C73 (2013) 2501], arXiv:1007.1727 [physics.data-an].
[44] A. L. Read,Presentation of search results: The C Ls technique, J. Phys. G: Nucl. Part. Phys.28(2002) 2693.
Appendix
[GeV]
Z
PT,
0 200 400 600 800 1000 1200 1400
]-1 [GeV ZT, 1/N dN/dP
0.05 0.1 0.15 0.2 0.25 0.3
0.35 mX = 200 GeV
= 300 GeV mX
= 500 GeV mX
= 750 GeV mX
= 1000 GeV mX
= 1500 GeV mX
= 2000 GeV mX
= 2500 GeV mX
Simulation Preliminary ATLAS
= 13 TeV s
γ
→Z
→X gg
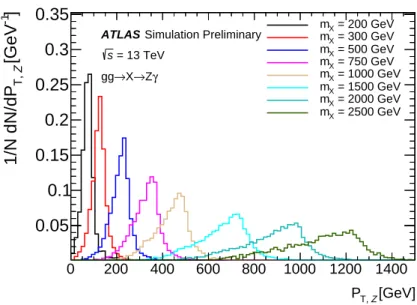
Figure 7: Evolution of the transverse momentum distributions of the Z boson with resonance mass inX → Zγ decays at generator-level.
[GeV]
T, l1
P
0 200 400 600 800 1000 1200 1400
]-1 [GeV 1T, l1/N dN/dP
0.05 0.1 0.15 0.2 0.25 0.3 0.35
= 200 GeV mX
= 300 GeV mX
= 500 GeV mX
= 750 GeV mX
= 1000 GeV mX
= 1500 GeV mX
= 2000 GeV mX
= 2500 GeV mX
Simulation Preliminary ATLAS
= 13 TeV s
γ
→Z
→X gg
Figure 8: Evolution of the transverse momentum distributions of the higherpT lepton, from Z boson decays with resonance mass inX →Zγdecays at generator-level.
[GeV]
T, l2
P
0 100 200 300 400 500 600 700
]-1 [GeV 2T, l1/N dN/dP
0.1 0.2 0.3 0.4
0.5 mX = 200 GeV = 300 GeV
mX
= 500 GeV mX
= 750 GeV mX
= 1000 GeV mX
= 1500 GeV mX
= 2000 GeV mX
= 2500 GeV mX
Simulation Preliminary ATLAS
= 13 TeV s
γ
→Z
→X gg
Figure 9: Evolution of the transverse momentum distributions of the lowerpT lepton, from Z boson decays with resonance mass inX →Zγdecays at generator-level.
[GeV]
γ
mZ
280 300 320
]-1 [GeV γZ1/N dN/dm
0 0.02 0.04 0.06 0.08 0.1 0.12 0.14 0.16 0.18
Simulation Preliminary ATLAS
γ
→ Z
→ X gg
= 300 GeV mX
= 13 TeV s
e-
e+
→ Z→µ+µ-
Z
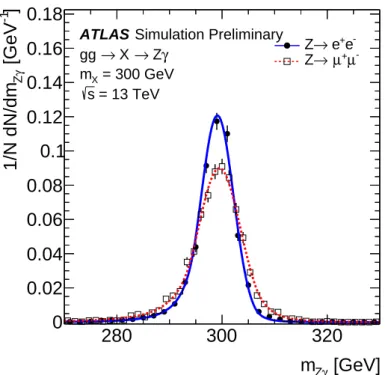
Figure 10: Invariant mass distribution forX →Zγ,Z→e+e−(full circles) orZ → µ+µ−events (open squares) in a simulation of a narrow resonanceXwith a mass of 300 GeV produced in a gluon-fusion process in√
s=13 TeV ppcollisions. All selection requirements have been applied. The blue solid (red dashed) lines represent the fits of the points with a double-sided Crystal Ball function.
[GeV]
γ
mZ
1400 1500 1600
]-1 [GeV γZ1/N dN/dm
0 0.01 0.02 0.03 0.04
0.05 ATLAS Simulation Preliminary γ
→ Z
→ X gg
= 1500 GeV mX
= 13 TeV s
e-
e+
→ Z→µ+µ-
Z
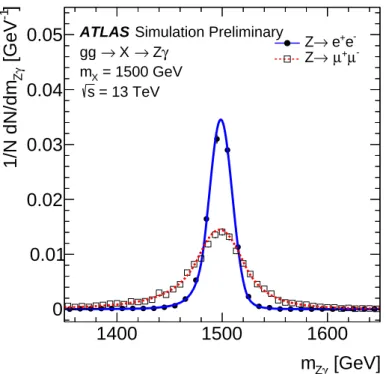
Figure 11: Invariant mass distribution forX →Zγ,Z→e+e−(full circles) orZ → µ+µ−events (open squares) in a simulation of a narrow resonanceX with a mass of 1.5 TeV produced in a gluon-fusion process in√
s=13 TeV ppcollisions. All selection requirements have been applied. The blue solid (red dashed) lines represent the fits of the points with a double-sided Crystal Ball function.
[GeV]
γ mZ 103
Events / 20.0 GeV
−3
10
−2
10
−1
10 1 10 102
103
data b background,
e-
e+
→ Z γ,
→Z
→X pp
= 13 TeV, 13.3 fb-1
s Preliminary ATLAS
[GeV]
γ
mZ 102
×
3 103 2×10³
data - b 10−
0
10 [GeV]
γ mZ 103
Events / 20.0 GeV
−3
10
−2
10
−1
10 1 10 102
103
104
data b background,
µ-
µ+
→ Z γ,
→Z
→X pp
= 13 TeV, 13.3 fb-1
s Preliminary ATLAS
[GeV]
γ
mZ 102
×
3 103 2×10³
data - b 20− 0 20
Figure 12: Distribution of the reconstructedZγinvariant mass in events in which the Zboson decays to electrons (a) or to muons (b). The solid lines show the results of background-only fits to the data. The residuals of the data points with respect to the fit are also shown.
[GeV]
γ
mZ
102
×
3 4×10² 103 2×10³
Events / 20.0 GeV
−3
10
−2
10
−1
10 1 10 102
103
104
data
b background,
µ-
µ+ -,
+e
→ e Z γ,
→Z
→X pp
= 13 TeV, 13.3 fb-1
s Preliminary ATLAS
[GeV]
γ
mZ
102
×
3 103 2×10³
data - b
−4020
− 0 20 40
Figure 13: Distribution of the reconstructedZγinvariant mass in events in which theZboson decays to electrons or to muons. The solid lines show the results of background-only fits to the data. The binning of the x-axis is roughly three times the expected signal resolution, which is different from constant bin width of 20 GeV used in Figure4 The residuals of the data points with respect to the fit are also shown.