ATLAS-CONF-2016-059 08August2016
ATLAS NOTE
ATLAS-CONF-2016-059
5th August 2016
Search for scalar diphoton resonances with 15.4 fb − 1 of data collected at √
s = 13 TeV in 2015 and 2016 with the ATLAS detector
The ATLAS Collaboration
Abstract
A search for new spin-0 resonances decaying into two photons in the ATLAS experiment at the LHC is described. The analysis is based on pp collision data corresponding to an integ- rated luminosity of 15.4 fb
−1at √
s =13 TeV recorded in 2015 and 2016. A deviation from the Standard Model background-only hypothesis corresponding to 3.4 standard deviations is observed in the 2015 data for a resonance mass hypothesis of 730 GeV. No significant excess at such mass over the background expectation is observed in the 2016 data. Limits on the production cross section times branching ratio to two photons of such resonances are reported.
c
2016 CERN for the benefit of the ATLAS Collaboration.
1 Introduction
New high-mass states decaying into two photons are predicted in many extensions of the Standard Model (SM). The diphoton final state provides a clean experimental signature with excellent invariant mass resolution and moderate backgrounds.
Using 3.2–3.3 fb
−1of √
s = 13 TeV proton–proton (pp) collision data recorded in 2015 at the CERN Large Hadron Collider (LHC), the ATLAS and CMS Collaborations reported an excess in the diphoton invariant mass spectra with respect to the SM continuum background near the mass value of 750 GeV [1, 2]. The searches were performed using two benchmark signal models, the lightest Kaluza–Klein [3] spin- 2 graviton excitation (G
∗) of a Randall–Sundrum (RS) [4] model or a spin-0 resonance (X) such as those predicted in theories with an extended Higgs sector [5–11]. The ATLAS results in Ref. [1] correspond to a global significance of about two standard deviations.
An update of this search is given in this note using both the 2015 and 2016 pp collision datasets, cor- responding to a total integrated luminosity of 15.4 fb
−1. The 2015 data and simulated samples, used in Ref. [1], have been reprocessed with the same reconstruction software as used for the 2016 data pro- cessing, which includes small improvements in the reconstruction and selection of converted photons and in the photon energy calibration. The analysis follows closely the description given in Ref. [1], but limited at this time to the spin-0 resonance search analysis. With the higher number of inelastic pp collisions per bunch crossing (pileup) of the 2016 data, more work is needed to complete the analysis in the extended acceptance of the spin-2 selection.
The note is organized as follows: after a description of the data and simulated event samples in Section 2, the photon selection and energy measurements are presented in Section 3. In Sections 4 to 7 the event selection, the modelling of the signal and the estimation of the background as well as the statistical procedure to analyze the data are presented. The results are discussed in Section 8.
2 Data and simulated event samples
Data were collected by the ATLAS detector [12] in 2015 and 2016 using pp collisions at a centre-of-mass energy of √
s = 13 TeV with a bunch spacing of 25 ns. The average number of pp interactions per bunch crossing ranged from 13 in 2015 to 22 in 2016, with a peak instantaneous luminosity up to 1.0 · 10
34cm
−2s
−1. Events from pp collisions were recorded using a diphoton trigger with transverse energy E
T1thresholds of 35 GeV and 25 GeV for the E
T-ordered leading and subleading photon candidates, respect- ively. In the high-level trigger, clusters of energy in the electromagnetic calorimeter are reconstructed and required to satisfy loose criteria according to expectations for showers initiated by photons. The trigger has a signal efficiency close to 99% for events fulfilling the final event selection. Only events taken in stable beam conditions, and in which the trigger system, the tracking devices and the calorimeters were fully operational, are considered. After data-quality requirements, the data sample corresponds to an in- tegrated luminosity of 3.2 fb
−1for the 2015 data and 12.2 fb
−1for the 2016 data. The measurement of the integrated luminosity has an uncertainty of ±2.1% for the 2015 data and a preliminary uncertainty of
1The ATLAS experiment uses a right-handed coordinate system with its origin at the nominal interaction point (IP) in the centre of the detector and thez-axis along the beam pipe. Thex-axis points from the IP to the centre of the LHC ring, and the y-axis points upward. Cylindrical coordinates (r, φ) are used in the transverse plane,φbeing the azimuthal angle around the z-axis. The pseudorapidity is defined in terms of the polar angleθasη=−ln tan(θ/2). The transverse energy is defined as ET=Esin(θ).
±3.7% for the 2016 data. The preliminary uncertainty on the combined 2015 + 2016 integrated luminosity is 2.9%. These uncertainties are derived, following a methodology similar to that detailed in Ref. [13], from a preliminary calibration of the luminosity scale using x–y beam-separation scans performed in August 2015 and May 2016.
Simulated Monte Carlo (MC) samples are used to optimize the search strategy and to study background sources. Interference e ff ects between signal and background processes are neglected. The generated events are passed through a full detector simulation [14] based on Geant4 [15]. Pileup is simulated by overlaying each MC event with a variable number of simulated inelastic pp collisions generated using P ythia 8 [16], version 8.186, with the AZNLO set of tuned parameters (tune) [17]. The MC events are weighted to reproduce the distribution of the average number of interactions per bunch crossing observed in the data.
The signal MC samples are generated using the e ff ective field theory approach implemented in M ad - Graph5_aMC@NLO [18] at next-to-leading order in QCD. From the Higgs characterization frame- work [19], CP-even dimension five operators coupling the new resonance to gluons and photons are included. Samples are generated with the NNPDF3.0 NLO [20] parton distribution functions (PDF), us- ing the A14 tune [21] of Pythia8 for the parton shower. Fully simulated samples are produced for fixed values of the mass and width of the assumed resonance, spanning the range 200–2400 GeV for the mass and the range from 4 MeV to 15% of the mass for the decay width, respectively. The mass lineshape for any value of the mass and width is computed by combining the parton luminosity term, the Breit–Wigner term and the diphoton mass to the seventh power which comes from the product of the matrix element of the e ff ective field theory by the flux factor (∝ m
6γγ) and from the phase space (∝ m
γγ). This approach is validated by comparing the particle-level invariant mass distributions of the generated events in the fully simulated samples to the model predicted for the corresponding values of the mass and the width. The choice of a di ff erent generator compared to what has been used in Ref. [1] allows a description of the signal which is less model-dependent. It does not change significantly the compatibility of the data with the background-only hypothesis. To investigate the impact of the assumed production process, alternative spin-0 resonance signal samples are simulated as if it was a SM Higgs boson produced by vector-boson fusion or associated production with a vector-boson or a t¯ t pair [1].
Events containing two prompt photons, representing the largest irreducible background to the search, are simulated using the S herpa [22] generator, version 2.1.1. Matrix elements are calculated with up to two partons at leading order in QCD and merged with the Sherpa parton shower [23] using the ME+PS@LO prescription [24]. The gluon-induced box process is also included. The CT10 PDF set [25] is used in conjunction with a dedicated parton-shower tune of S herpa . Samples of the photon + jet reducible background component are also generated using Sherpa 2.1.1. Matrix elements are calculated at LO with up to four partons. The same PDF, parton shower and merging prescription as the diphoton sample are used. For comparison, P ythia 8 is also used to generate Standard Model diphoton events, based on the leading-order quark–antiquark t-channel annihilation diagram and the gluon-induced box process, and photon+jet events. The NNPDF23LO [26] PDF and the A14 parton shower tune are used.
3 Photon selection
Photon and electron candidates are reconstructed from clusters of energy deposited in the electromagnetic
calorimeter and tracks and conversion vertices reconstructed in the inner detector. A specific electron-
track reconstruction assuming the pion hypothesis. Compared to the processing used in Ref. [1], a small bias in the track parameter fitting has been corrected. The criteria used to select converted photons have also been modified to cope with the higher pileup expected for the 2016 data taking period. These new criteria are applied to both reprocessed 2015 data and 2016 data. This leads to event-by-event di ff erences in the classification of the photons as converted and unconverted compared to the reconstruction used in Ref. [1].
Only photon candidates with |η| < 2.37 are considered, not including the transition region 1.37 < |η| <
1.52 between the barrel and end-cap calorimeters. In the excluded transition region, the calorimeter granularity is reduced, and the presence of significant additional inactive material degrades the photon identification capabilities and energy resolution.
Photon identification is based primarily on shower shapes in the calorimeter [27], with selection criteria optimized for the conditions expected for the 2015 and 2016 data. An initial loose selection is derived using only the information from the hadronic calorimeter and the lateral shower shape in the second layer of the electromagnetic calorimeter, which contains most of the energy. The final tight selection has tighter criteria applied to these variables, di ff erent for converted and unconverted photon candidates.
Requirements on the shower shape in the finely segmented first calorimeter layer are applied to ensure the compatibility of the measured shower profile with that originating from a single photon impacting the calorimeter. When applying the photon identification criteria to simulated events, the shower shapes are corrected for small differences in their average values between data and simulation. The efficiency of the photon identification increases with E
Tfrom 85% at 50 GeV to 95% at 200 GeV. For E
T> 50 GeV, the uncertainty in the photon identification e ffi ciency varies between ±2% and ±5% depending on η and E
T. This uncertainty is estimated from the effect of differences between shower-shape variable distributions in data and simulation. From the studies done in Ref. [27], this procedure is found to provide a conservative estimate of the uncertainties. The same conclusion is found on studies performed with 2015 data [28].
To further reject the background from jets misidentified as photons, the photon candidates are required to be isolated using both calorimeter and tracking detector information. The calorimeter isolation variable, E
Tiso, is defined as the sum of the E
Tof energy clusters deposited in a cone of size ∆ R = p
( ∆ η)
2+ ( ∆ φ)
2= 0.4 around the photon candidate, excluding an area of size ∆ η × ∆ φ = 0.125 × 0.175 centred on the photon cluster; the expected photon energy deposit outside the excluded area is subtracted. The pileup and underlying-event contribution to the calorimeter isolation variable is subtracted from the isolation en- ergy event-by-event [29–31]. The selection requirement on the calorimeter isolation variable is defined by E
isoT< 0.022E
T+ 2.45 GeV, where E
Tis the transverse energy of the photon candidate. The track isolation variable (p
isoT) is defined as the scalar sum of the transverse momenta of the tracks in a cone of
∆ R = 0.2 around the photon candidate. Only tracks with p
T> 1.0 GeV and longitudinal impact parameter with respect to the primary vertex, weighted by the track polar angle (|z
0× sin θ|), smaller than 3 mm are considered. For converted photons, the tracks associated to reconstructed photon conversion vertices are excluded from the p
isoTcomputation. This tighter requirement with respect to Ref. [1] improves the effi- ciency for genuinely converted photons by a few percent. The requirement applied for the track isolation variable is p
isoT< 0.05E
T.
The efficiency of the isolation requirements is studied using several data control samples. Electrons
from Z-boson decays are used to validate the isolation variables up to E
T= 100 GeV. Inclusive photon
samples are used to check the e ffi ciency of the isolation requirement in a wide E
Trange from 50 GeV
up to 1000 GeV. Small differences between data and simulation in the average value of the calorimeter
isolation variable are observed as a function of E
Tand η of the photon candidates. Theses di ff erences
are used as systematic uncertainties. The e ffi ciency of the combined isolation requirement for photons
fulfilling tight identification selection in signal MC samples is 88% to 97% in the E
Trange 100 GeV to 500 GeV, with an uncertainty between 1% and 2%. The isolation requirement reduces the rate at which jets are misidentified as photons by about one order of magnitude.
Both identification and isolation requirements are slightly sensitive to the pileup activity, with a 4% (1.5%) expected difference for the combined identification and isolation efficiency for 100 GeV (300 GeV) E
Tphotons between 13 and 22 average interactions per bunch crossing.
The measurement of the electron or photon energy is based on the energy collected in calorimeter cells in an area of size ∆ η × ∆ φ of 0.075 × 0.175 in the barrel and 0.125 × 0.125 in the end-caps. A mul- tivariate regression algorithm [32] to calibrate electron and photon energy measurements was developed and optimized on simulated events. It uses the same input variables as the one used in Ref. [1] and has been re-trained to account for the small changes in the conversion reconstruction. For photons near the transition region between the barrel and end-cap calorimeter, the energy resolution is also slightly im- proved with respect to the one of Ref. [1] by using the information from the scintillators located in front of the end-cap cryostat. The calibration of the input layer energies in the calorimeter is based on the measurement performed with 2012 data [32]. The overall energy scale in data, as well as the di ff erence in the constant term of the energy resolution between data and simulation, are estimated with the sample of Z-boson decays to electrons recorded in 2015 [33]. At E
Tvalues larger than 100–200 GeV, the en- ergy resolution is dominated by the constant term of the calorimeter energy resolution, which amounts to 0.6% − 1.5% depending on η. The uncertainty in the photon energy scale at high E
Tis typically ± (0.5–
2.0)% depending on η, and the relative uncertainty in the photon energy resolution for E
T= 300 GeV is
±(30–45)% depending on η.
4 Event selection and sample composition
4.1 Event selection
Triggered events with two photon candidates fulfilling the tight identification criteria with E
Tabove 40 GeV and 30 GeV are selected. The primary vertex corresponding to the pp collision that produced the diphoton candidate is identified, with the algorithm used in Ref. [1], combining the photon direc- tion measurements with the calorimeter and the information of reconstructed tracks in the inner detector from charged particles associated to the different pp collision vertices. In addition, the calorimeter and the track isolation requirements are applied to further reduce the background from jets misidentified as photons, thus increasing the expected sensitivity of the analysis.
Given the isotropic distribution of the decay products of a spin-0 resonance in its center-of-mass reference frame, the transverse energies of the two photons are expected to be higher than those of photons from background processes of the same invariant mass. The transverse energy is thus required to be E
T>
0.4m
γγfor the photon with the highest E
Tand E
T> 0.3m
γγfor the photon with the second-highest E
T, for a given value of m
γγ, thus selecting events in which the photons are preferentially emitted in the central part of the detector. Finally, the diphoton invariant mass is required to be larger than m
γγ> 150 GeV.
With these requirements, 35891 events are selected in the data.
4.2 Sample composition
The selected sample mainly consists of events from diphoton production, followed by photon + jet produc- tion, with one jet misidentified as a photon, and dijet production with two jets misidentified as photons.
Background sources from Drell–Yan, Wγ or Zγ production, with either one or two isolated electrons misidentified as photons, are negligible. A quantitative assessment of the sample composition is required in the studies for the choice of the functional form used to model the background.
As in Ref. [1], two methods [34, 35], a matrix method and a 2x2D sidebands method, based on control regions built from events failing the isolation requirement and / or some of the tight photon identification requirements are used to estimate the relative contribution of the various sources of background directly from data. To avoid significant correlation with the isolation variable, only specific tight photon identific- ation requirements using the first layer of the calorimeter are inverted.
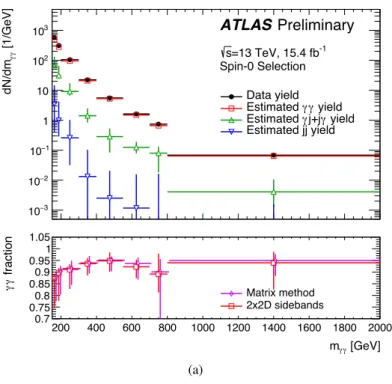
Both methods can be applied over the full selected kinematic range, or in bins of m
γγ, thus providing both inclusive and differential yields. Figure 1 shows the decomposition of the selected data sample into the contributions from diphoton, photon + jet or jet + photon, and dijet events and the corresponding diphoton purity, defined as the ratio of diphoton events over the total number of events in the sample. The average purity is (90
+−103)%. Uncertainties in these estimates come from the statistical uncertainty in the data sample, the definition of the control region failing the tight identification requirement, the modelling of the isolation distribution and possible correlations between the isolation variable and the identification criteria that are inverted. Both methods give consistent results within their uncertainties. The estimate of these uncertainties is sensitive to the small number of events in the control regions.
A third method based on a fit to the two-dimensional isolation distribution of the photons in data is also used to further cross-check the background fractions over the full selected kinematic range, giving results in good agreement with the other two methods.
4.3 Signal acceptance and e ffi ciency
The signal yield can be expressed as the product of three terms: the production cross section times branching ratio to two photons, the acceptance (A) of the kinematic requirements, and the reconstruction and identification e ffi ciency (C). The acceptance is expressed as the fraction of events satisfying the fiducial acceptance at the generator level. The factor C is defined as the ratio of the number of events fulfilling all the selections placed on reconstructed quantities to the number of events in the fiducial acceptance. The fiducial acceptance closely follows the selection criteria applied to the reconstructed data: |η
γ| < 2.37, E
T> 0.4m
γγ(leading γ), E
T> 0.3m
γγ(sub-leading γ). The isolation requirement E
Tiso< 0.05E
Tγ+ 6 GeV is applied, where E
isoTis computed using all particles with lifetime greater than 10 ps at the generator level in a cone of ∆ R = 0.4 around the photon direction. The value of the isolation requirement applied at the particle level is adjusted to reproduce the selection applied at the reconstruction level.
The acceptance factor A ranges from 54% to 61% in the mass range from 200 GeV to 700 GeV for a
particle produced by gluon fusion and is almost constant above 700 GeV. Different production modes
lead to A values that di ff er by up to 10% at the same value of the mass: to reduce the dependence on
the production mechanism, the results of the search are thus quoted in terms of the fiducial cross section,
defined as the product of the cross section times the branching ratio to two photons within the fiducial
acceptance. The simulation of a narrow-width signal produced by gluon fusion is used to compute the
[GeV]
γ
mγ
[1/GeV]γγdN/dm
−3
10
2
10− 1
10−
1 10 102
103 ATLAS Preliminary
=13 TeV, 15.4 fb-1
s
Spin-0 Selection Data yield
yield γ Estimated γ
yield j+jγ Estimated γ Estimated jj yield
[GeV]
γ
mγ
200 400 600 800 1000 1200 1400 1600 1800 2000
fractionγγ
0.7 0.75 0.8 0.85 0.9 0.95 1 1.05
Matrix method 2x2D sidebands
(a)
Figure 1: The diphoton invariant mass distribution (upper panel) of the data and its decomposition in contributions from genuine diphoton, photon+jet and dijet events as determined using the 2x2D sidebands method. The bottom panel show the purity of diphoton events as determined from the matrix and the 2x2D sidebands methods. The total uncertainties are shown, including statistical and systematic components.
nominal value of C, which ranges from 66% for a particle of mass 200 GeV to 74% at 700 GeV and is almost constant above 700 GeV. Di ff erent production modes (vector-boson fusion, associated production with a W or Z boson or with a t¯ t pair) and decay widths larger than the detector resolution lead to variations of the correction factor C by up to ±2.8%. This maximum variation is taken as an uncertainty on C.
Experimental uncertainties in C arise from uncertainties in the photon identification e ffi ciency (±3% to
±2% depending on the assumed mass and on the selection), the photon isolation efficiency (±4% to ±1%
depending on the assumed mass and on the selection), and the trigger efficiency (±0.6%). Uncertainties in C related to the photon energy scale and resolution have a negligible impact on the uncertainty in the expected signal yield.
5 Signal modelling
The invariant mass distribution of the diphoton pair for the signal is expected to peak near the assumed
mass of the new particle, with a spread given by the convolution of its intrinsic decay width with the
experimental resolution. The invariant mass experimental resolution is modelled with a double-sided
Crystal Ball (DSCB) function.
The DSCB function is defined as:
N ·
e
−t2/2if −α
low≥ t ≥ α
highe−0.5α2low α
low nlow
n
αlowlow−αlow−t
nlow
if t < −α
low e−0.5α2 high
α
high nhigh
n
high αhigh−αhigh+t
nhigh
if t > α
high,
(1)
where t = ∆ m
X/σ
CB, ∆ m
X= m
X− µ
CB, N is a normalisation parameter, µ
CBis the peak of the Gaussian distribution, σ
CBrepresents the width of the Gaussian part of the function, α
low(α
high) parameterizes the mass value where the invariant mass resolution distribution becomes a power-law function on the low (high) mass side, n
low(n
high) is the exponent of this power-law function.
The parameters of the DSCB function are expressed as analytical functions of the mass of the resonance.
The coefficients of such functions are obtained from a simultaneous fit to the invariant mass distributions of all the simulated narrow-width signal samples.
The diphoton invariant mass resolution for a narrow-width resonance, as measured by the σ
CBparameter, varies from 2.3 GeV at a mass of 200 GeV to 15 GeV at a mass of 2 TeV. The relative uncertainty in the signal mass resolution is mostly driven by the uncertainty in the constant term of the energy resolution, which is the dominant contribution at high energy, and varies as a function of the mass from ±17% at a mass of 200 GeV to ±40% at a mass of 2 TeV.
The signal mass distribution for any value of the mass and width hypothesis is obtained by a convolution of the intrinsic detector resolution, modelled by a DSCB function, with the predicted mass line-shape distribution at the generator level, as discussed in Section 2. This signal mass distribution is then assumed for the fiducial cross-section limit.
[GeV]
γ
mγ
720 740 760 780 800 820 840
/ 1 GeVγγ1/N dN/dm
0 0.01 0.02 0.03 0.04 0.05 0.06 0.07 0.08
ATLAS Simulation Preliminary γ
γ
→ = 13 TeV, X s
Spin-0 Selection = 800 GeV mX
= 4 MeV ΓX
(a)
[GeV]
γ
mγ
550 600 650 700 750 800 850 900 950
/ 5 GeVγγ1/N dN/dm
0 0.01 0.02 0.03 0.04 0.05 0.06 0.07
0.08 ATLAS Simulation Preliminary γ
γ
→ = 13 TeV, X s
Spin-0 Selection = 800 GeV mX
= 6%
/mX
ΓX
(b)
Figure 2: Themγγ distributions for a scalar resonance with a mass of 800 GeV with (a) a narrow decay width (ΓX =4 MeV) or with (b)ΓX/mX =0.06. A fit is superimposed using the convolution of the theoretical mass line shape with the detector resolution. Figures (a) and (b) have different x-axis scales.
Figure 2 illustrates the signal modelling for an 800 GeV scalar particle with either a narrow width (Γ
X=
4 MeV) or a width equal to 6% of the mass. The bias from the modelling of the signal mass resolution has a negligible impact on the extracted signal yield.
6 Background estimates
The estimate of the background m
γγcontribution in the selected sample is based on a fit using a smooth functional form, with parameters determined in situ, to model the total background. The mass distribution from data is fitted in the range above 180 GeV, and the search range for the signal is 200–2400 GeV. In the analysis of the 2015 data alone, the fit range starts at 150 GeV, to increase the number of events in the invariant mass sideband (m
γγ< 200 GeV) and thus improve the precision of the fit results. In the data there are 19717 events with m
γγ> 180 GeV. The number of candidates used in the fit to the 2016 (2015) data alone, i.e. the candidates with m
γγ> 180 GeV (m
γγ> 150 GeV) in the 2016 (2015) data is 15466 (7765).
A family of functions, adapted from those used by searches for new physics signatures in dijet final states [36], is chosen to describe the shape of the invariant mass distribution:
f
(k)(x; b, {a
k}) = N(1 − x
1/3)
bx
Pkj=0aj(logx)j, (2) where x = m
γγ/ √
s, b and a
kare free parameters, and N is a normalization factor. The number of free parameters describing the normalized mass distribution is thus k + 2.
To validate the choice of this functional form and to derive the corresponding uncertainties, the method detailed in Ref. [37] is used to check that the functional form is flexible enough to accommodate dif- ferent physics-motivated underlying distributions. The shape of the mass distribution for the irreducible diphoton background is obtained from the simulated Sherpa diphoton samples. The shape of the mass distribution for the reducible photon+jet and dijet backgrounds is estimated from data control samples selected with one or two of the photons failing the tight identification criteria but fulfilling a looser set of requirements. As the limited number of data events does not directly allow a precise estimate of the mass distribution for masses above 500 GeV, the invariant mass distributions of these samples are fitted with various smooth functions providing an adequate fit to the data. The final pseudo-data set is obtained by summing the diphoton contribution and the smoothed estimate of the photon+jet and dijet backgrounds, normalised to their yields estimated in the data with the methods described in Section 4.2.
The bias related to the choice of functional form is estimated as the fitted "spurious" signal [37] yield in these pseudo-data, which consist only of background events, when performing a signal-plus-background fit for various signal mass hypotheses. To be selected for the analysis, the functional form is required to have a fitted "spurious" signal of less than 30% of the statistical uncertainty in the fitted signal yield over the full investigated mass range. Among the forms fulfilling this criteria, the one with the lowest number of degrees of freedom is preferred. Based on these criteria, the functional form defined in Equation (2) with k = 0 is selected. The uncertainty in the background is estimated from the fitted "spurious" signal.
For a narrow-signal hypothesis, it varies from 18 events at 200 GeV to 0.012 events at 2400 GeV, for the
combined 2015+2016 dataset. For larger hypothesized signal widths, the signal is integrated over a wider
mass range and the background uncertainty is larger, varying from 117 events at 200 GeV to 0.35 events
at 2400 GeV, for a hypothesized signal with a relative width Γ
X/m
Xof 10%.
7 Statistical procedure
The numbers of signal and background events are obtained from maximum-likelihood fits of the m
γγdis- tribution of the selected events. Various (m
X, α) hypotheses, corresponding to the presence of a resonance of mass m
Xand width Γ
X= αm
X, are probed. Each fit allows for a single signal component.
The function used to describe the data can be written as
N
S(σ
S) f
S(m
γγ) + N
Bf
B(m
γγ), (3) where N
Sis the fitted number of signal events, f
S(m
γγ) is the normalized invariant mass distribution for a given signal hypothesis, N
Bis the fitted number of background events and f
B(m
γγ) is the normalized invariant mass distribution of the background events. The fitted number of signal events is related to the assumed signal cross section times branching ratio to two photons (σ
S) in the fiducial acceptance via the integrated luminosity and the detector efficiency correction factors.
Uncertainties in the signal parameterization, in the detector e ffi ciency correction factors for the signal and in the description of the background shape are included in the fit via nuisance parameters. Uncertainties in the signal modelling are constrained with Gaussian or log-normal penalty terms. The parameters of the functional form used to describe the background are nuisance parameters without penalty terms, and the systematic uncertainty in the background description is implemented by the "spurious" signal term, which is constrained by a Gaussian penalty term and, for a given (m
X, α) hypothesis, has the same invariant mass distribution as the signal. This "spurious" signal uncertainty is considered separately for each (m
X, α) hypothesis without any correlation between the different investigated mass ranges.
The local p-value (p
0) for the compatibility with the background-only hypothesis when testing a given signal hypothesis (m
X, α) is based on scanning the q
0(m
X, α) test statistic [38]:
q
0(m
X, α) = − 2 log L(σ
S= 0, m
X, α, ν) ˆˆ
L( ˆ σ
S, m
X, α, ν) ˆ , (4)
where the values of the parameters marked with the hat superscript are chosen to unconditionally max- imize the likelihood L, while the value with a double hat is chosen to maximize the likelihood in a background-only fit, and ν represents the nuisance parameters which are varied in the fit. This p
0-value is calculated using the asymptotic approximation to the test statistic distribution [38].
Global significance values are computed to account for the trial factors given by the search range. A large number of pseudo-experiments are generated assuming the background-only hypothesis and, for each pseudo-experiment, a maximum-likelihood fit is performed with the signal mass, width and rate as free parameters, within the search range. The corresponding p
0-value is computed and the global significance is estimated by comparing the minimum p
0-value observed in data to the distribution derived from pseudo-experiments.
The expected and observed 95% confidence level (CL) exclusion limits on the cross section times branch-
ing ratio to two photons are computed using a modified frequentist approach CL
s[39] with the asymptotic
approximation to the test statistic distribution [38]. Cross-checks with sampling distributions generated
using pseudo-experiments are performed for a few signal mass points. The largest di ff erences are of the
order of 10–30% on the cross-section limit for a high-mass, narrow resonance.
8 Results
8.1 Compatibility with the background-only hypothesis
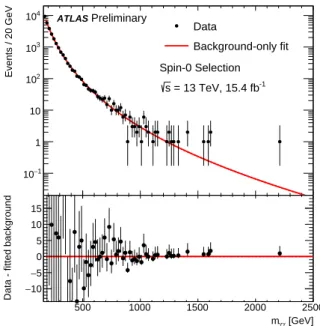
Figure 3 shows the diphoton invariant mass distribution together with the background-only fit, for events selected in the 2015 and in 2016 datasets.
500 1000 1500 2000 2500
Events / 20 GeV
−1
10 1 10 102
103
104 ATLASPreliminary
Spin-0 Selection = 13 TeV, 2015, 3.2 fb-1
s Data
Background-only fit
[GeV]
γ
mγ
500 1000 1500 2000 2500
Data - fitted background 10−
−5 0 5 10 15
(a)
500 1000 1500 2000 2500
Events / 20 GeV
−1
10 1 10 102
103
104 ATLASPreliminary
Spin-0 Selection = 13 TeV, 2016, 12.2 fb-1
s Data
Background-only fit
[GeV]
γ
mγ
500 1000 1500 2000 2500
Data - fitted background 10−
−5 0 5 10 15
(b)
Figure 3: Invariant-mass distribution of the selected diphoton candidates, with the background-only fit overlaid, for (a) 2015 data and (b) 2016 data. The difference between the data and this fit is shown in the bottom panel. The arrow shown in the lower panel indicates a values outside the range with more than one standard deviation. There is no data event withmγγ>2500 GeV.
The 2015 data have been reanalyzed with improved photon reconstruction algorithms. The significance of the largest excess above the background-only hypothesis decreased from 3.9 standard deviations of Ref. [1] to 3.4 standard deviations. The corresponding signal mass and width also changed, from a mass of 750 GeV and a relative width of 6% to a mass of 730 GeV and a relative width of 8%. These differences are mainly due to two events being affected by the new reconstruction algorithms used for the reprocessing of the 2015 data. In one event selected both by this analysis and the one of Ref. [1], one of the two photon candidates is at |η| = 1.53, where the improved calibration of photon candidates near the transition region of the electromagnetic calorimeter leads to a decrease of the diphoton invariant mass from 757 GeV to 722 GeV. In a second event that passed the selection in Ref. [1], one track previously associated to one of the two selected photon candidates, reconstructed as a converted photon, is not considered as originating from the photon conversion. The photon candidate thus fails the p
isoT< 0.05 requirement and the event does not pass the selection.
In the 2016 data set, no significant deviation from the background-only hypothesis is observed at the
value of the mass corresponding to the most significant excess in 2015 data. The compatibility between
assuming a signal mass and width determined from the smallest local p-value in the 2015 data. The compatibility between the signal cross sections extracted from the 2015 and 2016 datasets is at the level of 2.7 standard deviations, due to the absence of a significant excess in the 2016 dataset near 730 GeV.
The two datasets are then combined, and the invariant mass distribution of the events selected in both years is shown in Figure 4. Using this distribution, the compatibility with the background-only hypothesis is
500 1000 1500 2000 2500
Events / 20 GeV
−1
10 1 10 102
103
104 ATLASPreliminary
Spin-0 Selection = 13 TeV, 15.4 fb-1
s Data
Background-only fit
[GeV]
γ
mγ
500 1000 1500 2000 2500
Data - fitted background 10−
−5 0 5 10 15
Figure 4: Distribution of the diphoton invariant mass of the selected events, with the background-only fit. The difference between the data and this fit is shown in the bottom panel. The arrow shown in the lower panel indicates a values outside the range with more than one standard deviation. There is no data event withmγγ>2500 GeV.
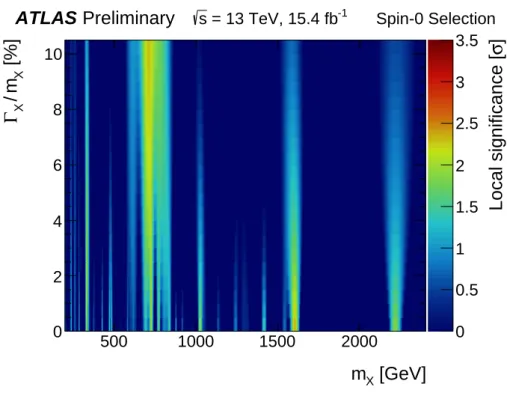
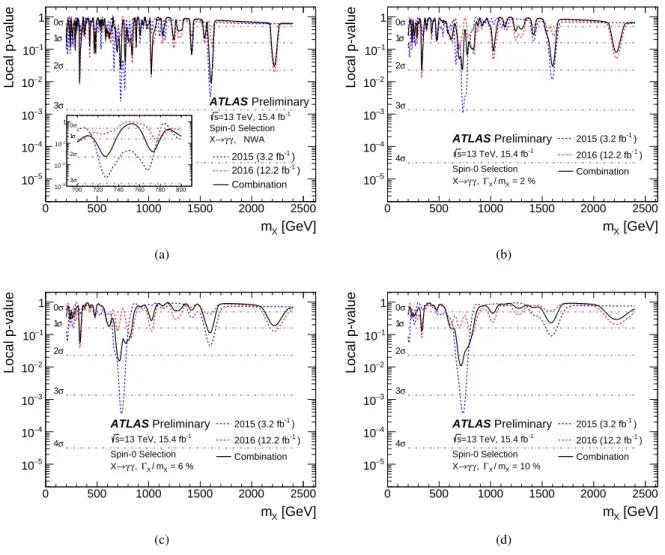
computed as a function of the hypothesized resonance mass and width, as shown in Figure 5. Figure 6 illustrates this local compatibility as a function of the assumed mass for a few values of the assumed resonance width, comparing the results observed with the 2015 dataset only, the 2016 dataset only and the combined dataset.
In the combined dataset, the largest deviation over the background-only hypothesis is observed at a mass of 1600 GeV for an assumed narrow width, corresponding to a local significance of 2.4 standard devi- ations. The corresponding global significance is smaller than one standard deviation. In the 700–800 GeV mass range the largest local significance is 2.3 standard deviations for a mass near 710 GeV and a relative width of 10%.
8.2 Cross-section limits
Limits on the cross section times branching ratio to diphoton are derived. The limits are interpreted in a nearly model-independent way in terms of the cross section within the fiducial acceptance defined in Section 4.3.
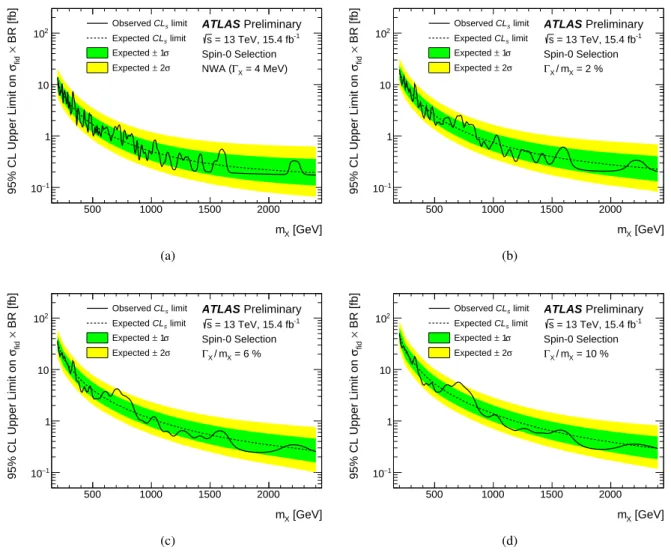
Figure 7 shows the limits on the signal fiducial cross section times branching ratio to two photons for a
spin-0 particle as a function of the assumed signal mass and for di ff erent values of the signal width. For
[GeV]
m
X500 1000 1500 2000
[%]
Xm/
XΓ
0 2 4 6 8 10
] σ Local significance [
0 0.5 1 1.5 2 2.5 3 3.5 ATLAS Preliminary s = 13 TeV, 15.4 fb
-1Spin-0 Selection
Figure 5: Compatibility, in terms of local significanceσ, with the background-only hypothesis as a function of the assumed signal mass and width for a spin-0 resonance.
a narrow decay width, the limits on the fiducial cross section times branching ratio range from 15 fb near
a mass of 200 GeV to 0.2 fb at 2400 GeV.
[GeV]
mX
0 500 1000 1500 2000 2500
Local p-value
−5
10
−4
10
−3
10
−2
10
−1
10 1
ATLAS Preliminary
=13 TeV, 15.4 fb-1
s
Spin-0 Selection γ, γ
→
X NWA
-1 ) 2015 (3.2 fb
-1 ) 2016 (12.2 fb Combination σ
0 σ 1
σ 2
σ 3
σ 4
700 720 740 760 780 800
−3
10
−2
10
−1
10 10σ
σ 1
σ 2
σ 3
σ 4
(a)
[GeV]
mX
0 500 1000 1500 2000 2500
Local p-value
−5
10
−4
10
−3
10
−2
10
−1
10 1
ATLAS Preliminary
=13 TeV, 15.4 fb-1
s
Spin-0 Selection γ, γ
→
X ΓX/mX = 2 %
-1 ) 2015 (3.2 fb
-1 ) 2016 (12.2 fb Combination σ
0 σ 1
σ 2
σ 3
σ 4
(b)
[GeV]
mX
0 500 1000 1500 2000 2500
Local p-value
−5
10
−4
10
−3
10
−2
10
−1
10 1
ATLAS Preliminary
=13 TeV, 15.4 fb-1
s
Spin-0 Selection γ, γ
→
X ΓX/mX = 6 %
-1 ) 2015 (3.2 fb
-1 ) 2016 (12.2 fb Combination σ
0 σ 1
σ 2
σ 3
σ 4
(c)
[GeV]
mX
0 500 1000 1500 2000 2500
Local p-value
−5
10
−4
10
−3
10
−2
10
−1
10 1
ATLAS Preliminary
=13 TeV, 15.4 fb-1
s
Spin-0 Selection γ, γ
→
X ΓX/mX = 10 %
-1 ) 2015 (3.2 fb
-1 ) 2016 (12.2 fb Combination σ
0 σ 1
σ 2
σ 3
σ 4
(d)
Figure 6: Compatibility with the background-only hypothesis as a function of the assumed signal mass for different values of the relative width ΓX/mX of a spin-0 resonance. In (a) a narrow-width signal, withΓX =4 MeV, is assumed.
[GeV]
mX
500 1000 1500 2000
BR [fb]×fidσ95% CL Upper Limit on 1−10
1 10
102 ATLAS Preliminary
= 13 TeV, 15.4 fb-1
s
= 4 MeV) ΓX
NWA ( Spin-0 Selection limit
CLs
Observed limit CLs
Expected σ
± 1 Expected
σ
± 2 Expected
(a)
[GeV]
mX
500 1000 1500 2000
BR [fb]×fidσ95% CL Upper Limit on 1−10
1 10
102 ATLAS Preliminary
= 13 TeV, 15.4 fb-1
s = 2 % mX X/ Γ
Spin-0 Selection limit
CLs
Observed limit CLs
Expected σ
± 1 Expected
σ
± 2 Expected
(b)
[GeV]
mX
500 1000 1500 2000
BR [fb]×fidσ95% CL Upper Limit on 1−10
1 10
102 ATLAS Preliminary
= 13 TeV, 15.4 fb-1
s = 6 % mX X/ Γ
Spin-0 Selection limit
CLs
Observed limit CLs
Expected σ
± 1 Expected
σ
± 2 Expected
(c)
[GeV]
mX
500 1000 1500 2000
BR [fb]×fidσ95% CL Upper Limit on 1−10
1 10
102 ATLAS Preliminary
= 13 TeV, 15.4 fb-1
s
= 10 % mX X/ Γ
Spin-0 Selection limit
CLs
Observed limit CLs
Expected σ
± 1 Expected
σ
± 2 Expected
(d)
Figure 7: Upper limits on the fiducial cross section times branching ratio to two photons at √
s = 13 TeV of a spin-0 particle as a function of its massmX, for different values of the decay width divided by the mass. In (a) a narrow-width signal, withΓX =4 MeV, is assumed.
9 Conclusion
Searches for new spin-0 resonances decaying into two photons in the ATLAS experiment at the LHC are presented. The pp collision data corresponding to an integrated luminosity of 15.4 fb
−1were recorded in 2015 and 2016 at a centre-of-mass energy of √
s = 13 TeV.
The data are consistent with the Standard Model background-only hypothesis, and 95% CL exclusion limits are derived on the production cross section times branching ratio to two photons as a function of the resonance mass and width. At the value of the signal mass and width where the largest deviation from the background-only hypothesis is observed in the reprocessed 2015 dataset, corresponding to mass of 730 GeV and a width of 60 GeV, the 2016 data are in agreement with the expected background at the one standard-deviation level. In the combined dataset, the largest local significance is 2.4 standard deviations for a mass near 1600 GeV and a narrow width. In the 700–800 GeV mass range the largest local significance is 2.3 standard deviations for a mass near 710 GeV and a relative width of 10%.
The global significance of these excesses is less than one standard deviation.
References
[1] ATLAS Collaboration,
Search for resonances in diphoton events at √
s = 13 TeV with the ATLAS detector, (2016), arXiv: 1606.03833 [hep-ex].
[2] CMS Collaboration, Search for resonant production of high-mass photon pairs in proton-proton collisions at √
s = 8 and 13 TeV, (2016), arXiv: 1606.04093 [hep-ex].
[3] T. Appelquist, A. Chodos and P. Freund, Modern Kaluza-Klein theories, vol. 65, Frontiers in Physics, Addison-Wesley, 1987.
[4] L. Randall and R. Sundrum, A Large mass hierarchy from a small extra dimension, Phys. Rev. Lett. 83 (1999) 3370, arXiv: hep-ph/9905221.
[5] A. Hill and J.J. van der Bij, Strongly interacting singlet - doublet Higgs model, Phys. Rev. D 36 (1987) 3463.
[6] M. J. G. Veltman and F. J. Yndurain, Radiative correction to WW scattering, Nucl. Phys. B 325 (1989) 1.
[7] T. Binoth and J.J. van der Bij, Influence of strongly coupled, hidden scalars on Higgs signals, Z. Physics. C 75 (1997) 17, arXiv: hep-ph/9608245.
[8] R. Schabinger and J. D. Wells, A minimal spontaneously broken hidden sector and its impact on Higgs boson physics at the CERN Large Hadron Collider, Phys. Rev. D 72 (2005) 093007, arXiv: hep-ph/0509209.
[9] B. Patt and F. Wilczek, Higgs-field portal into hidden sectors, (2006), arXiv: hep-ph/0605188.
[10] G. M. Pruna and T. Robens,
Higgs singlet extension parameter space in the light of the LHC discovery, Phys. Rev. D 88 (2013) 115012, arXiv: 1303.1150 [hep-ph].
[11] T. D. Lee, A theory of spontaneous T violation, Phys. Rev. D 8 (1973) 1226.
[12] ATLAS Collaboration, The ATLAS Experiment at the CERN Large Hadron Collider, JINST 3 (2008) S08003.
[13] ATLAS Collaboration, Improved luminosity determination in pp collisions at √
s = 7 TeV using the ATLAS detector at the LHC, Eur. Phys. J. C 73 (2013) 2518, arXiv: 1302.4393 [hep-ex].
[14] ATLAS Collaboration, The ATLAS simulation infrastructure, Eur. Phys. J. C 70 (2010) 823–874, arXiv: 1005.4568 [physics.ins-det].
[15] S. Agostinelli et al., GEANT4: A simulation toolkit, Nucl. Instrum. Meth. A 506 (2003) 250.
[16] T. Sjöstrand, S. Mrenna and P. Z. Skands, A Brief Introduction to PYTHIA 8.1, Comput. Phys. Commun. 178 (2008) 852–867, arXiv: 0710.3820 [hep-ph].
[17] ATLAS Collaboration, Measurement of the Z boson transverse momentum distribution in pp collisions at √
s = 7 TeV with the ATLAS detector, JHEP 1409 (2014) 145, arXiv: 1406.3660 [hep-ex] .
[18] J. Alwall et al, The automated computation of tree-level and next-to-leading order di ff erential
cross sections, and their matching to parton shower simulations, JHEP 1407 (2014) 079,
arXiv: 1405.0301 [hep-ph].
[19] P. Artoisenet et al, A framework for Higgs characterisation, JHEP 1311 (2013) 043, arXiv: 1306.6464 [hep-ph].
[20] R. D. Ball et al, Parton distributions for the LHC Run II, JHEP 1504 (2015) 040, arXiv: 1410.8849 [hep-ph].
[21] ATLAS Collaboration, ATLAS Pythia 8 tunes to 7 TeV data, ATL-PHYS-PUB-2014-021, 2014, url: http://cds.cern.ch/record/1966419.
[22] T. Gleisberg et al., Event generation with SHERPA 1.1, JHEP 0902 (2009) 007, arXiv: 0811.4622 [hep-ph].
[23] S. Schumann and F. Krauss,
A parton shower algorithm based on Catani-Seymour dipole factorisation, JHEP 0803 (2008) 038, arXiv: 0709.1027 [hep-ph].
[24] S. Höche et al., QCD matrix elements and truncated showers, JHEP 0905 (2009) 053, arXiv: 0903.1219 [hep-ph].
[25] H.-L. Lai et al., New parton distributions for collider physics, Phys. Rev. D 82 (2010) 074024, arXiv: 1007.2241 [hep-ph].
[26] S. Carrazza, S. Forte and J. Rojo, ‘Parton Distributions and Event Generators’,
Proceedings, 43rd International Symposium on Multiparticle Dynamics (ISMD 13), 2013 89–96, arXiv: 1311.5887 [hep-ph],
url : https://inspirehep.net/record/1266070/files/arXiv:1311.5887.pdf.
[27] ATLAS Collaboration, Measurement of the photon identification e ffi ciencies with the ATLAS detector using LHC Run 1 data, (2016), arXiv: 1606.01813 [hep-ex].
[28] ATLAS Collaboration, Photon identification in 2015 ATLAS data, ATL-PHYS-PUB-2016-014, 2016, url : http://cds.cern.ch/record/2203125.
[29] ATLAS Collaboration, Measurement of the inclusive isolated prompt photon cross section in pp collisions at √
s = 7 TeV with the ATLAS detector, Phys. Rev. D 83 (2011) 052005, arXiv: 1012.4389 [hep-ex].
[30] M. Cacciari, G. P. Salam and G. Soyez, The Catchment Area of Jets, JHEP 0804 (2008) 005, arXiv: 0802.1188 [hep-ph].
[31] M. Cacciari, G. P. Salam and S. Sapeta, On the characterisation of the underlying event, JHEP 2010 (2010) 065, arXiv: 0912.4926 [hep-ph].
[32] ATLAS Collaboration,
Electron and photon energy calibration with the ATLAS detector using LHC Run 1 data, Eur. Phys. J. C 74 (2014) 3071, arXiv: 1407.5063 [hep-ex].
[33] ATLAS Collaboration, Electron and photon energy calibration with the ATLAS detector using data collected in 2015 at √
s = 13 TeV, ATL-PHYS-PUB-2016-015, 2016, url : http://cds.cern.ch/record/2203514.
[34] ATLAS Collaboration, Measurement of isolated-photon pair production in pp collisions at
√ s = 7 TeV with the ATLAS detector, JHEP 1301 (2013) 086, arXiv: 1211.1913 [hep-ex].
[35] ATLAS Collaboration, Measurement of the isolated diphoton cross section in pp collisions at
√ s = 7 TeV with the ATLAS detector, Phys. Rev. D 85 (2012) 012003,
arXiv: 1107.0581 [hep-ex].
[36] T. Aaltonen et al.,
Search for new particles decaying into dijets in proton-antiproton collisions at √
s = 1.96 TeV, Phys. Rev. D 79 (2009) 112002, arXiv: 0812.4036 [hep-ex].
[37] ATLAS Collaboration, Measurement of Higgs boson production in the diphoton decay channel in pp collisions at center-of-mass energies of 7 and 8 TeV with the ATLAS detector,
Phys. Rev. D 90 (2014) 112015, arXiv: 1408.7084 [hep-ex].
[38] G. Cowan et al., Asymptotic formulae for likelihood-based tests of new physics, Eur. Phys. J. C 71 (2011) 1554, [Erratum: Eur. Phys. J.C73,2501(2013)], arXiv: 1007.1727 [physics.data-an].
[39] A. L. Read, Presentation of search results: The CL
stechnique, J. Phys. G 28 (2002) 2693–2704.
Appendix
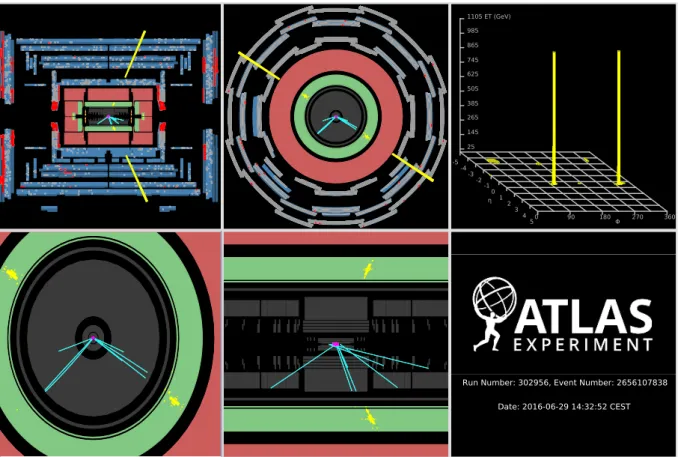
Figure 8 shows the event display of the candidate with the highest invariant mass observed in the 2016 data.
Figure 9 shows the observed 95% CL upper limits on the fiducial production cross section times branching ratio to two photons as a function of the resonance mass m
X, for a few values of the decay width divided by the mass, using the 2015, 2016 and combined data.
Figure 10 shows the expected and observed two-dimensional limits on the fiducial production cross sec- tion times branching ratio to two photons of a spin-0 resonance as a function of its mass m
Xand its decay width divided by its mass.
Table 1 gives the cross section limits for few values of the mass and width signal hypothesis.
Figure 8: Event display of the highest-invariant mass (mγγ =2.2 TeV) diphoton candidate selected in data. Only inner-detector tracks withET>5 GeV, calorimeter cells with energy deposits larger than 1 GeV and cells of the tile hadronic calorimeter with transverse energy above 3 GeV are shown. The leading photon candidate is reconstructed as unconverted and hasET =1.1 TeV,η =0.45,φ=−0.58,EisoT =5.2 GeV. The subleading photon candidate is reconstructed as converted and hasET=1.1 TeV,η=0.41,φ=2.56,EisoT =−1.0 GeV.
[GeV]
mX
500 1000 1500 2000
BR [fb]×fidσ95% CL Upper Limit on
−1
10 1 10 102
ATLAS Preliminary = 13 TeV, 15.4 fb-1
s
= 4 MeV) ΓX
NWA ( Spin-0 Selection limit
CLs
Observed
-1 ) 2015 (3.2 fb
-1 ) 2016 (12.2 fb Combination
(a)
[GeV]
mX
500 1000 1500 2000
BR [fb]×fidσ95% CL Upper Limit on
−1
10 1 10 102
ATLAS Preliminary = 13 TeV, 15.4 fb-1
s = 2 % mX X/ Γ
Spin-0 Selection limit
CLs
Observed
-1 ) 2015 (3.2 fb
-1 ) 2016 (12.2 fb Combination
(b)
[GeV]
mX
500 1000 1500 2000
BR [fb]×fidσ95% CL Upper Limit on
−1
10 1 10 102
ATLAS Preliminary = 13 TeV, 15.4 fb-1
s = 6 % mX X/ Γ
Spin-0 Selection limit
CLs
Observed
-1 ) 2015 (3.2 fb
-1 ) 2016 (12.2 fb Combination
(c)
[GeV]
mX
500 1000 1500 2000
BR [fb]×fidσ95% CL Upper Limit on
−1
10 1 10 102
ATLAS Preliminary = 13 TeV, 15.4 fb-1
s
= 10 % mX X/ Γ
Spin-0 Selection limit
CLs
Observed
-1 ) 2015 (3.2 fb
-1 ) 2016 (12.2 fb Combination
(d)
Figure 9: Observed 95% CL upper limits on the fiducial production cross section times branching ratio to two photons at√
s=13 TeV of a spin-0 resonance as a function of its massmX, for a few values of its width divided by its mass, using the 2015, 2016 and combined data.