A TLAS-CONF-2014-034 04 July 2014
ATLAS NOTE
ATLAS-CONF-2014-034
July 1, 2014
A measurement of the ratio of the production cross sections for W and Z bosons in association with jets with the ATLAS detector
The ATLAS Collaboration
Abstract
The ratio of the production cross sections for W and Z bosons in association with jets has been measured in proton–proton collisions at √
s = 7 TeV with the ATLAS experiment at the Large Hadron Collider. The measurement includes the entire 2011 data set, corresponding to an integrated luminosity of 4.6 fb
−1. Inclusive and differential cross-section ratios for massive vector bosons decaying to electrons and muons are measured in association with jets with transverse momentum p
T> 30 GeV and jet rapidity |y| < 4.4. The measurements are compared to next-to-leading-order perturbative QCD calculations and to predictions from different Monte Carlo generators implementing leading-order matrix elements supplemented by parton showers.
c
Copyright 2014 CERN for the benefit of the ATLAS Collaboration.
Reproduction of this article or parts of it is allowed as specified in the CC-BY-3.0 license.
1 Introduction
Precise measurements of the production of vector bosons in association with jets are important tests of quantum chromodynamics (QCD) and provide constraints on background processes to Higgs boson studies and to searches for new physics. The measurement of the ratio of W + jets to Z + jets
1cross sections, termed R
jets, directly probes the di ff erence between the kinematic distributions of the jet system recoiling against the W or Z bosons.
In comparison to separate W + jets and Z + jets measurements, the R
jetsmeasurement is a more pre- cise test of perturbative QCD (pQCD), since some experimental uncertainties and e ff ects from non- perturbative processes, such as hadronization and multi-parton interactions, are greatly reduced in the ratio. This allows precision comparisons with state-of-the-art Monte Carlo simulations and next-to- leading-order (NLO) perturbative QCD calculations to be made.
At low energies, the di ff erence in vector boson masses translates to a change in momentum transfer between incoming partons and thus different hadronic radiation patterns. In addition, the parton distri- bution functions of the proton imply di ff erent quark-gluon and quark-antiquark contributions to W + jets and Z + jets processes.
At very high energies, the vector boson mass difference is not large relative to the momentum transfer, so di ff erences between W + jets and Z + jets are expected to decrease, even though some di ff erences in the parton distribution functions (PDFs) remain. A precise measurement of R
jetscan therefore be used, in the context of searches for new particles or interactions beyond the Standard Model, to infer the W + jets contribution, given Z + jets production in the same phase space, or vice versa. The R
jetsmeasurement may also be sensitive to direct contributions from new particle production, if the new particles decay via W or Z bosons [1]. New physics is generally expected to appear in various topologies with high momentum jets or high jet multiplicities, highlighting the importance of studying QCD e ff ects in those regions of phase space.
The ATLAS collaboration performed the first measurement of R
jetsas a function of the jet transverse momentum in events with exactly one jet in proton–proton collisions at √
s = 7 TeV, using a data sample corresponding to an integrated luminosity of 33 pb
−1[2]. This result demonstrated that the precision obtained in such a measurement is sufficient to be sensitive to the QCD effects mentioned above. The CMS collaboration performed a R
jetsmeasurement of the jet multiplicity in vector boson production with up to four associated jets, based on a similar dataset corresponding to an integrated luminosity of 36 pb
−1in pp collisions collected at √
s = 7 TeV [3]. The results reported in this note are based on a dataset corresponding to an integrated luminosity of 4.6 fb
−1, collected with the ATLAS detector during the 2011
pp collision run of the LHC at √
s = 7 TeV. This dataset is over a hundred times larger than the one used in previously published results, allowing improved precision over a much larger region of phase space as well as the study of previously inaccessible differential distributions.
The R
jetsmeasurement is done for the electron and muon decay channels of the W and Z bosons for jets with transverse momentum p
T> 30 GeV and rapidity |y| < 4.4.
2The measurements of electron and muon channels are performed in slightly different phase spaces and combined in a common phase space defined in terms of the p
Tand pseudorapidity η of the leptons, the invariant mass of the Z boson, the angular separation between the two leptons
3of the Z boson decay, and the transverse mass
4of the W
1
In this note ,
Wmeans a
W+or
W−boson and
Zis defined as a
Zor
γ∗boson.
2
ATLAS uses a right-handed coordinate system with its origin at the nominal interaction point (IP) in the centre of the detector and the
z-axis along the beam pipe. Thex-axis points from the IP to the centre of the LHC ring, and they-axis pointsupward. Cylindrical coordinates (r,
φ) are used in the transverse plane,φbeing the azimuthal angle around the beam pipe. The pseudorapidity is defined in terms of the polar angle
θas
η=−ln tan(θ/2).3
Angular separations between particles or reconstructed objects are measured in
η−φspace using
∆R≡p(
∆φ)2+(
∆η)2.
4
The transverse mass of the
Wboson is reconstructed as
mT = q2p
`TpνT(1
−cos(φ
`−φν)) where
p`Tand
pνTare the
transverse momenta of the charged lepton and the neutrino respectively and
φ`and
φνtheir azimuthal directions.
Lepton p
Tand pseudorapidity η p
T> 25 GeV, |η| < 2.5 W transverse mass and neutrino p
Tm
T> 40 GeV, p
T> 25 GeV Z invariant mass and lepton–lepton angular separation 66 < m
``< 116 GeV, ∆ R
``> 0.2 Jet p
T, rapidity and jet–lepton angular separation p
T> 30 GeV, |y| < 4.4, ∆ R
j`> 0.5
Table 1: Particle-level phase space of the present R
jetsmeasurement.
boson, as presented in Table 1. The W and Z selections are based on the W + jets and Z + jets cross section measurements detailed in [4, 5], with a minor update in the Z selection to further reduce the uncertainty on the R
jetsmeasurement. For the results reported here, R
jetsis measured as a function of the inclusive and exclusive jet multiplicity up to four jets. An extensive set of di ff erential measurements is also presented, in which R
jetsis measured as a function of the transverse momentum and the rapidity of the leading jet, that is the one with largest transverse momentum, in events with at least one jet. R
jetsis also presented as a function of the transverse momentum and rapidity of the second and third leading jets in events with at least two or three jets, respectively. A set of di ff erential measurements as a function of di-jet observables in events with at least two jets is presented. The measurement of R
jetsas a function of the scalar p
Tsum of the jets (S
T) for different jet multiplicities is also reported. The results are compared to several Monte Carlo generators and with next-to-leading-order pQCD predictions corrected for non-perturbative effects.
The note is organized as follows. The experimental setup is described in Section 2. Section 3 provides details on the simulations used in the measurement, and Section 4 discusses the event selection. The estimation of background contributions is described in Section 5, and the procedure used to correct the measurements for detector effects is described in Section 6. The treatment of the systematic uncertainties is described in Section 7. Section 8 discusses the combination of the electron and muon results. Section 9 provides details on the NLO pQCD predictions. Finally, Section 10 discusses the results, and Section 11 presents the conclusions.
2 The ATLAS detector
The ATLAS detector [6] is a multi-purpose detector with a symmetric cylindrical geometry and nearly 4π coverage in solid angle. The collision point is surrounded by inner tracking devices followed by a superconducting solenoid providing a 2 T magnetic field, a calorimeter system, and a muon spectrom- eter. The inner tracker provides precision tracking of charged particles for pseudorapidities |η| < 2.5.
It consists of silicon pixel and microstrip detectors and a straw-tube transition radiation tracker. The calorimeter system has liquid argon (LAr) or scintillator tiles as active media. In the pseudorapid- ity region |η| < 3.2, high-granularity LAr electromagnetic (EM) sampling calorimeters are used. An iron / scintillator tile calorimeter provides hadronic coverage for |η| < 1.7. The endcap and forward re- gions, spanning 1.5 < |η| < 4.9, are instrumented with LAr calorimeters for both EM and hadronic measurements. The muon spectrometer consists of three large superconducting toroids each comprised of eight coils and a system of trigger chambers and precision tracking chambers that provide triggering and tracking capabilities in the ranges |η| < 2.4 and |η| < 2.7 respectively.
3 Monte Carlo simulation
Simulated event samples were used to correct the measured distributions for detector e ff ects and accep-
tance, to determine some background contributions and to correct theory calculations for non-perturbative
effects. Signal samples of W(→ `ν, ` = e, µ)+jets and Z(→ ``, ` = e, µ)+jets events were gener- ated with ALPGEN v2.13 [7], with up to five additional partons in the final state. It was interfaced to HERWIG v6.520 [8] for parton shower and fragmentation, with JIMMY v4.31 [9] for contribu- tions from multi-parton interactions and with PHOTOS [10] to calculate final state QED radiation. The CTEQ6L1 [11] PDFs were used with the AUET2-CTEQ6L1 tune [12]. Similar samples were produced with ALPGEN v2.14 interfaced to PYTHIA v6.425 [13] using the PERUGIA2011C [14] tune and PHO- TOS. They were used to estimate the uncertainties on non-perturbative corrections for parton-level NLO pQCD predictions. An additional set of signal samples was generated with SHERPA v1.4.1 [15, 16]
and CT10 PDFs [17]. Top quark pair production (t¯ t) was simulated with ALPGEN and HERWIG +JIMMY, in the same configuration as for the signal samples. Additional t¯ t samples were gener- ated with the POWHEG-BOX generator v1.0 [18], using the CT10 NLO PDFs [17] and interfaced to PYTHIA v6.425 [13]. These additional samples were reserved for the evaluation of the systematic un- certainties. Single top-quark production was modelled with A cer MC 3.8 [19] and MRST LO* PDF [20]
interfaced to PYTHIA. The diboson production processes W
+W
−, WZ, and ZZ were generated with HERWIG v6.510 and JIMMY v4.3 using the MRST LO* PDF [20] and the AUET2-LO* tune [12].
The generated samples were passed through the simulation of the ATLAS detector based on GEANT4 [21, 22] and through the related trigger simulation. The Monte Carlo samples were overlaid with additional inelastic pp scattering events generated with PYTHIA v6.425, following the distribution of the average number of pp interactions in the selected data.
All samples were normalised to the inclusive cross section calculated at the highest pQCD order available. The W/Z + jets signal samples were normalised to the next-to-next-to-leading order (NNLO) pQCD inclusive Drell-Yan predictions calculated with the FEWZ [23] program and the MSTW2008 NNLO PDFs [24]. The t¯ t samples were normalised to the cross section calculated at NNLO + NNLL in Refs. [25–30], and the diboson samples were normalised to cross sections calculated at NLO using MCFM [31] with the MSTW2008 PDF set.
The simulated events were reconstructed and analysed with the same analysis chain as the data.
Scale factors were applied to the simulated samples to correct the lepton trigger, reconstruction, and identification efficiencies to match those measured in data.
4 Event selection
The data samples considered in this note correspond to a total integrated luminosity of 4.6 fb
−1, with an uncertainty of 1.8% [32]. Table 2 summarises the kinematic requirements for leptons, W bosons, Z bosons, and jets. The selection criteria for W boson candidates were defined using the largest possi- ble coverage of the ATLAS detector for electrons, muons and jets. The selection criteria for Z boson candidates were modified with respect to those in Ref. [5], to be as similar as possible to the W boson se- lection in order to maximise the cancellation of uncertainties in the R
jetsmeasurement: triggers requiring at least one lepton were employed, the minimum lepton transverse momentum was raised from 20 GeV to 25 GeV, tighter criteria were used to identify electrons and slightly looser requirements were placed on the second leading lepton with respect to the leading one.
The data were collected using single electron or muon selections, employing the same trigger re- quirement for the W and Z data selections. Electron-channel events were selected using a trigger that required the presence of at least one electron candidate, formed by an energy cluster consistent with an electromagnetic shower in the calorimeter and associated to an inner detector track. Electron candidates were required to have a reconstructed transverse energy above 20 GeV or 22 GeV, depending on the trigger configuration of the di ff erent data periods. Muon-channel events were recorded using a trigger that required the presence of at least one muon candidate with transverse momentum above 18 GeV.
Lepton trigger thresholds were low enough to ensure that leptons with p
T> 25 GeV lie on the trigger
Electron selection Muon selection
Lepton p
Tp
T> 25 GeV p
T> 25 GeV
Lepton pseudorapidity |η| < 2.47 (excluding 1.37 < |η| < 1.52) |η| < 2.4 W → `ν event selection
Z veto exactly one selected lepton
Missing transverse momentum E
missT> 25 GeV Transverse mass m
T> 40 GeV
Z → `` event selection Multiplicity exactly two selected leptons
Charge opposite sign
Invariant mass 66 < m
``< 116 GeV
Separation ∆ R
``> 0.2
Jet selection Transverse momentum p
T> 30 GeV Jet rapidity | y| < 4.4 Jet–lepton angular separation ∆ R
`j> 0.5
Table 2: Kinematic event selection criteria for W(→ eν) + jets, W(→ µν) + jets, Z (→ ee) + jets, and
Z (→ µµ) + jets event samples.
efficiency plateau.
Events were required to have a primary vertex, defined as the vertex in the event with the highest p
2Tsum of all associated tracks, among vertices with at least three tracks.
Electrons were reconstructed by associating clusters of energy found in the electromagnetic calorime- ter to tracks reconstructed in the inner detector. Candidate electrons had to satisfy the “tight” quality requirements defined in Ref. [33], which include requirements on the calorimeter shower shape, track quality, and association of the track with the energy cluster found in the calorimeter. Electron candi- dates had to have p
T> 25 GeV and |η| < 2.47, where the transition region between barrel and endcap electromagnetic calorimeter sections at 1.37 < |η| < 1.52 was excluded.
Muons were reconstructed from track segments in the muon spectrometer that were associated to tracks in the inner detector [5], and were required to have p
T> 25 GeV and |η| < 2.4. To suppress particles from hadron decays, the leading muon had to be consistent with originating from the primary vertex by requiring |d
0/σ(d
0)| < 3.0, where d
0is the muon transverse impact parameter and σ(d
0) is its uncertainty.
In order to suppress background from multi-jet events where a jet is mis-identified as a lepton, the leading lepton was required to be isolated. An additional p
Tand η-dependent requirement on a combi- nation of calorimeter and track isolation variables was applied to the leading electron, in order to yield a constant e ffi ciency across di ff erent momentum ranges and detector regions, as detailed in Ref. [34]. The track-based isolation uses a cone size of ∆ R = 0.4 and the calorimeter-based isolation uses a cone size of ∆ R = 0.2. The actual isolation requirements range between 2.5 GeV and 4.5 GeV for the calorimeter- based isolation and between 2.0 GeV and 3.0 GeV for the track-based isolation. For muon candidates, the scalar sum of the transverse momenta of tracks within a cone ∆ R = 0.2 around the leading muon had to be less than 10% of its transverse momentum.
Reconstructed W candidates were required to have exactly one selected lepton. The missing trans- verse momentum E
missTin the event had to be greater than 25 GeV, and the transverse mass m
Thad to be greater than 40 GeV. The magnitude and azimuthal direction of E
Tmissare measured from the vector sum of the transverse momenta of calibrated physics objects and additional soft calorimeter deposits [35].
Reconstructed Z candidates were required to have exactly two selected leptons of the same flavour with opposite charge. Their invariant mass m
``had to be in the range 66 GeV ≤ m
``≤ 116 GeV and the leptons had to be separated by ∆ R
``> 0.2.
Jets were reconstructed using the anti-k
talgorithm [36] with a distance parameter R = 0.4 on topo- logical clusters of energy in the calorimeters [37]. Jets were required to have a transverse momentum above 30 GeV and a rapidity of |y| < 4.4. Jets within ∆ R = 0.5 of a selected lepton were removed. The energy and the direction of reconstructed jets were corrected to account for the point of origin, assumed to be the primary vertex, and for the bias introduced by the presence of additional pp interactions in the same bunch crossing (“pile-up”). The jet energy was then calibrated to account for the di ff erent response of the calorimeters to electrons and hadrons, for energy losses in un-instrumented regions by applying correction factors derived from simulations. A residual calibration derived from in-situ techniques was applied to the data to reduce di ff erences between data and simulations [38]. In order to reject jets from pile-up, a jet selection was applied based on the ratio between the scalar sum of the p
Tof the tracks originating from the primary vertex and associated to the jet to the sum of the p
Tof all tracks associated to the jet. Jets were selected if this ratio is above 0.75. This criterion was applied to jets within |η| < 2.4, just inside the inner tracker acceptance. Comparison between data and simulation for various data peri- ods confirmed that the residual impact of pile-up on the distribution of the jet observables in this analysis is well-modeled by the simulation.
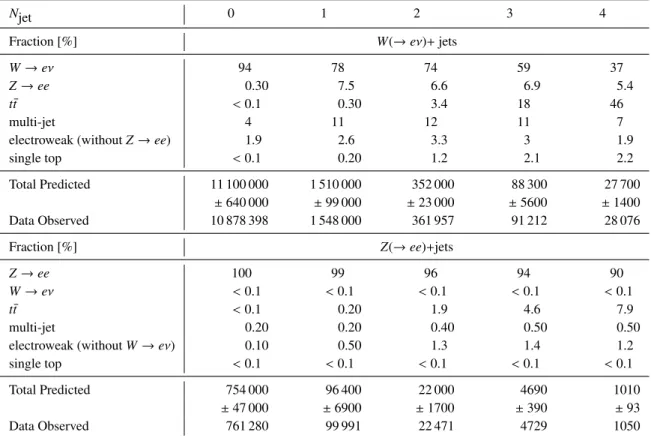
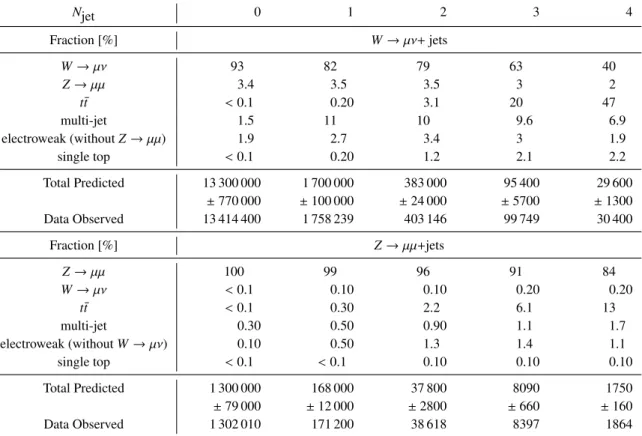
The numbers of W + jets and Z + jets candidate events in the electron and muon channels for each jet multiplicity are shown in Tables 3 and 4, together with the corresponding numbers of predicted events.
The expected fraction of predicted events from signal and each background source, determined as de-
scribed in the next section, is also shown.
5 Background estimation
Background processes to W and Z boson production associated with jets can be classified in three cate- gories. The first category, referred to as electroweak background, consists of diboson production, vector boson production with subsequent decay to τ-leptons, and “cross-talk” backgrounds, in which the signal W + jets (Z + jets) production appears as background in the Z + jets (W + jets) sample. These background contributions are relatively small (about 10% in the W + jets electron channel, about 6% in the W + jets muon channel, and about 1% in Z + jets, as shown in Tables 3 and 4) and were thus estimated using simulated event samples.
The second category consists of events where the leptons are produced in decays of top quarks.
The t¯ t component completely dominates the background contribution to W + jets events at high jet mul- tiplicities, amounting to approximately 20% of the W + ≥ 3 jets candidate sample and increasing to approximately 45% for events with four selected jets. The e ff ect is less dramatic in Z + jets events, where the t¯ t background contributes about 5% to the Z + ≥ 3 jets selection and about 10% to the Z + ≥ 4 jets selection. The background contribution from single top-quark production is about 2% of the sample in W + jets events for events with three or four jets, and smaller at lower jet multiplicities. This contribution is even smaller in Z + jets events. Contributions from t¯ t events to W + jets candidates with at least three jets, where this background dominates, were estimated with a data-driven method as described below in order to reduce the overall uncertainty. The t¯ t contributions to W + jets candidates for jet multiplic- ities below three and to Z + jets events and single top background contributions were estimated using simulated event samples.
The third category of background, referred to as multi-jet background, comes from events in which hadrons mimic the signature of an isolated lepton. In the electron channel this includes photon conver- sion processes, typically from the decay of neutral pions, narrow hadronic jets and real electrons from the decay of heavy flavour hadrons. In the muon channel, the multi-jet background is primarily composed of heavy flavour hadron decay processes. This background category dominates at low jet multiplicity in W + jets events, amounting to 11% of the selected sample in both electron and muon channels for events with one jet. Data-driven techniques were used to estimate this background contribution to both W + jets and Z + jets candidate events, as described below. The methods employed to estimate background con- tributions with data-driven techniques in this analysis are very similar between candidate events with W bosons and Z bosons and between electron and muon channels.
t¯ t background
The t¯ t background is the dominant background contribution to W + jets events with at least three jets, since each top quark predominantly decays as t → Wb. The size of the t¯ t contribution was estimated with a maximum-likelihood fit to the data.
The t¯ t template in this fit was derived from a top–quark enhanced data sample by requiring, in ad- dition to the selection criteria given in Table 2, at least one b-tagged jet in the event, as determined by the MV1 b-tagging algorithm of Ref. [39]. The chosen MV1 algorithm working point has a b-tagging e ffi ciency of 70%. This data sample is contaminated with W signal events, electroweak and multi-jet backgrounds, amounting to about 40% in events with three jets and 25% in events with four jets. The contribution from W signal events and electroweak background was estimated using simulation. The multi-jet contribution to the top-enriched sample was estimated using the multi-jet background estima- tion method as outlined in the last part of this section, but with an additional b-tagging requirement.
Potential biases on the t¯ t templates extracted from data were investigated using simulated t¯ t events.
Since b-tagging is only available for jets within |η| < 2.4 where information from the tracking detectors
exists, the b-tagging selection biases some of the kinematic distributions, most notably the jet rapidity distribution. To account for this, ALPGEN t¯ t simulations are used to correct for any residual bias on the differential distributions, where the maximum correction is 30%.
The number of t¯ t events was extracted by fitting a discriminant distribution to the sum of three templates: the top-enriched template after subtracting the contaminations discussed above, the multi-jet template (determined as described below) and the template obtained from simulation for the W + jets signal and the other background sources. The chosen discriminant was the transformed aplanarity, given by exp(−8 · A), where A is the aplanarity defined as 1.5 times the smallest eigenvalue of the normalised momentum tensor of the leptons and all the jets passing the selection [40]. This discriminant has been shown to provide the best separation between t¯ t and the W + jets signal. The fit to the transformed aplanarity distribution was done in each exclusive jet multiplicity equal to and above three in the range 0.0–0.85.
Since the top-enriched sample is a sub-sample of the signal sample, statistical correlation between the two samples is expected. Its size was estimated using pseudo-datasets by performing Poisson variations of the signal and top-enriched samples. To account for this correlation, the uncertainty on the fit was increased by 15% for events with three jets and about 30% for events with four jets.
Multi-jet background
The multi-jet background contribution to the W + jets selected events was estimated with a template fit method using a sample enriched in multi-jet events. The templates of the multi-jet background for the fit were extracted from data, by modifying the lepton isolation requirements in both electron and muon channels, in order to select non-isolated leptons. The templates of the signal, the t¯ t background, and the electroweak background were obtained from simulation. These templates were then normalised by a fit to the E
Tmissdistribution after all signal requirements other than the requirement on E
missThave been applied.
To select an electron-channel data sample enriched in multi-jet events, dedicated electron triggers based on loose requirements were used (as defined in Ref. [33]), along with additional triggers based on loose electron and jet selection criteria. The background template distributions were built from events for which the identification requirements of the nominal electron selection failed, in order to suppress signal contamination in the template. Candidate electrons were also required to be non-isolated in the calorimeter, i.e. were required to have an energy deposition in the calorimeter in a cone of ∆ R < 0.3 centered on their direction greater than 20% of their total transverse energy. This selection results in a data sample highly enriched in jets misidentified as electrons. As the luminosity increased during the course of 2011, the trigger selections were adjusted to cope with the increasing trigger rates. In order to build multi-jet template distributions that provide a good representation of the pile-up conditions of the selected data sample, these template distributions were extracted from two distinct data periods with high and low pile-up conditions. The background templates extracted from the two di ff erent data periods were fitted separately and then combined into an overall multi-jet estimate.
To select the multi-jet sample in the muon channel, muon candidates were required to be non-isolated.
The sum of transverse momenta of tracks in a cone ∆ R < 0.2 centered on the muon-candidate direction had to be between 10% and 50% of the muon transverse momentum. The contamination from W signal events, electroweak and top backgrounds to the multi-jet sample was subtracted using simulation. It amounts to 1.4% for events with one jet and 4.8% for events with four jets.
The number of multi-jet background events was obtained for each jet multiplicity in the electron
and muon channels by fitting the E
missTdistribution obtained from the W + jets data candidate events
(selected before the application of the E
Tmissrequirement) to the multi-jet template and a template of
signal, electroweak and t¯ t backgrounds derived from simulations. The fit range has been chosen to
ensure significant contributions from both templates, in order to guarantee fit stability under systematic
variations described in Section 7. The E
Tmissdistribution has been fitted in the range 15 to 80 GeV in the electron channel and in the range 15 to 70 GeV in the muon channel.
The multi-jet background contribution to the Z + jets selected candidates was estimated using a tem- plate fit method similar to the procedure used in the W + jets case. In the electron channel, the template distributions for the multi-jet background were constructed from a data sample collected with looser electron triggers than those used for the nominal Z → ee selection. Electrons were then required to pass the loose offline identification criteria (as defined in Ref. [33]) but fail the nominal criteria. In the muon channel, the multi-jet template distributions for the multi-jet background were obtained from the nomi- nal signal data sample, after relaxing the impact parameter significance requirement applied to Z → µµ events candidates, and selecting events for which the isolation criteria applied for the signal selection failed. The number of multi-jet background events was obtained for each exclusive jet multiplicity by fitting the di-lepton invariant mass distribution m
``in an extended range, 50 < m
``< 140 GeV, excluding the Z-peak region itself, after all other signal requirements have been applied. Due to statistical limita- tion for jet multiplicities greater than two jets, the normalisation factor obtained from the two-jet bin was consistently applied to higher jet multiplicity templates. Potential bias of this procedure was accounted for in the systematic uncertainty estimate.
The evaluation of the systematic uncertainties for each background source is explained in Section 7.
N
jet 0 1 2 3 4
Fraction [%]
W(→eν)+jets
W→eν
94 78 74 59 37
Z→ee
0.30 7.5 6.6 6.9 5.4
tt
¯
<0.1 0.30 3.4 18 46
multi-jet 4 11 12 11 7
electroweak (without
Z→ee)1.9 2.6 3.3 3 1.9
single top
<0.1 0.20 1.2 2.1 2.2
Total Predicted 11 100 000 1 510 000 352 000 88 300 27 700
±
640 000
±99 000
±23 000
±5600
±1400
Data Observed 10 878 398 1 548 000 361 957 91 212 28 076
Fraction [%]
Z(→ee)+jetsZ→ee
100 99 96 94 90
W→eν <
0.1
<0.1
<0.1
<0.1
<0.1
t¯t <
0.1 0.20 1.9 4.6 7.9
multi-jet 0.20 0.20 0.40 0.50 0.50
electroweak (without
W→eν)0.10 0.50 1.3 1.4 1.2
single top
<0.1
<0.1
<0.1
<0.1
<0.1
Total Predicted 754 000 96 400 22 000 4690 1010
±
47 000
±6900
±1700
±390
±93
Data Observed 761 280 99 991 22 471 4729 1050
Table 3: The approximate size of the signal and backgrounds, expressed as a fraction of the total number
of predicted events. They are derived from either data-driven estimates or simulations for exclusive jet
multiplicities for the W → eν selection (upper table) and for the selection Z → ee (lower table). The
total numbers of predicted and observed events are also shown.
N
jet 0 1 2 3 4
Fraction [%]
W→µν+jets
W→µν
93 82 79 63 40
Z→µµ
3.4 3.5 3.5 3 2
t¯t <
0.1 0.20 3.1 20 47
multi-jet 1.5 11 10 9.6 6.9
electroweak (without
Z→µµ)1.9 2.7 3.4 3 1.9
single top
<0.1 0.20 1.2 2.1 2.2
Total Predicted 13 300 000 1 700 000 383 000 95 400 29 600
±
770 000
±100 000
±24 000
±5700
±1300
Data Observed 13 414 400 1 758 239 403 146 99 749 30 400
Fraction [%]
Z→µµ+jets
Z→µµ
100 99 96 91 84
W→µν <
0.1 0.10 0.10 0.20 0.20
t¯t <
0.1 0.30 2.2 6.1 13
multi-jet 0.30 0.50 0.90 1.1 1.7
electroweak (without
W→µν)0.10 0.50 1.3 1.4 1.1
single top
<0.1
<0.1 0.10 0.10 0.10
Total Predicted 1 300 000 168 000 37 800 8090 1750
±
79 000
±12 000
±2800
±660
±160
Data Observed 1 302 010 171 200 38 618 8397 1864
Table 4: The approximate size of the signal and backgrounds, expressed as a fraction of the total number
of predicted events. They are derived from either data-driven estimates or simulations for exclusive jet
multiplicities for the W → µν selection (upper table) and for the selection Z → µµ (lower table). The
total numbers of predicted and observed events are also shown.
6 Corrections for detector e ff ects
The signal event yields were determined by subtracting the estimated background contributions from the data. After background subtraction, the resulting distributions were corrected for detector effects such that distributions at the particle level were obtained. The correction procedure based on simulated samples corrects for jet, W and Z selection e ffi ciency, resolution e ff ects and residual mis-calibrations.
While W + jets and Z + jets events have been separately unfolded before forming R
jets, the systematic uncertainties have been estimated on the ratio itself, as explained in the next section.
At particle level, the lepton kinematic variables in the Monte Carlo generated samples were computed using final state leptons from the boson decay and included the contributions from the photons radiated by the boson decay products within a cone of ∆ R = 0.1 around the direction of the final state leptons (referred to as “dressed” leptons). Particle-level jets were identified by applying the anti-k
talgorithm with R = 0.4 to all final-state particles with a lifetime longer than 30 ps, whether produced directly in the proton–proton collision or from the decay of particles with shorter lifetimes. Neutrinos, electrons, and muons from decays of the W and Z bosons, as well as collinear photons included in the “lepton dressing procedure” were excluded by the jet reconstruction algorithm. The phase-space requirements match the selection criteria defining the data candidate events, as presented in Table 2, in order to limit the dependence of the measurement results on theoretical assumptions.
The correction was implemented using an iterative Bayesian method of unfolding [41]. Simulated events are used to generate for each distribution a response matrix to account for bin-to-bin migration ef- fects between the reconstructed and particle level distributions. The Monte Carlo particle-level prediction is used as initial prior to determine a first estimation of the unfolded data distribution. For each further iteration the estimator for the unfolded distribution of the previous one is used as a new input prior. Bin sizes in each distribution were chosen to be a few times larger than the resolution of the corresponding variable. The ALPGEN W + jets and Z + jets samples provide a satisfactory description of distributions in data and were employed to perform the correction procedure. The number of iterations was optimised to find a balance between too many iterations, causing high statistical uncertainties associated with the unfolded spectra, and too few iterations, which increase the dependency on the Monte Carlo prior. The optimal number of iterations is typically between one and three, depending on the observable. Since the differences in the unfolded results are negligible over this range of iterations, two iterations have been consistently used for unfolding each observable.
7 Systematic uncertainties
One of the advantages of measuring R
jetsis that systematic uncertainties that are positively correlated between the numerator and denominator cancel at the level of their correlations (higher correlations result in larger cancellations). The impact on the ratio of a given source of uncertainty was estimated by simultaneously applying the systematic variation due to this source to both W + jets and Z + jets events and performing the full measurement chain with the systematic variations applied. This included re- estimation of the varied data-driven background distributions.
Since the uncertainties were found to be symmetric within the statistical fluctuations, the resulting systematic uncertainties on the R
jetsmeasurements were fully symmetrised by taking the average value of the upwards and downwards variations.
Uncertainty sources a ff ecting the R
jetsmeasurements can be assigned to one of the following cate-
gories: jet measurements, lepton measurements, missing transverse momentum measurement, unfolding
procedure, data-driven background estimates and simulation-based background estimates. These sources
of uncertainty feature significant correlations between W + jets and Z + jets processes, which have been
fully accounted for as explained above. The systematic uncertainties on the t¯ t and multi-jet background
estimates were considered to be uncorrelated between the W + jets and Z + jets selections. The uncertainty on the integrated luminosity was propagated through all of the background calculations and treated as correlated between W + jets and Z + jets so that it largely cancels in the ratio. The contributions from each of the sources mentioned above and the total systematic uncertainties were obtained by adding in quadrature the di ff erent components. The total uncertainty on R
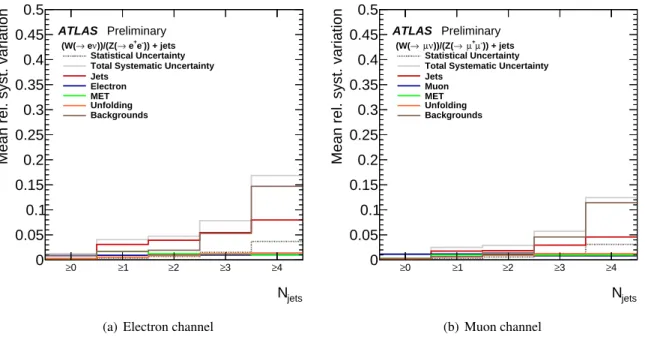
jetsas a function of the inclusive jet mul- tiplicity from 4% for N
jets≥ 1 to 17% for N
jets≥ 4 in the electron channel and from 3% for N
jets≥ 1 to 12% for N
jets≥ 4 in the muon channel. Figure 1 shows the breakdown of the systematic uncertaities of
N
jets≥0 ≥1 ≥2 ≥3 ≥4
Mean rel. syst. variation
0 0.05 0.1 0.15
0.2 0.25 0.3 0.35 0.4 0.45 0.5
)) + jets e-
e+
→ ))/(Z(
ν
→ e (W(
Statistical Uncertainty Total Systematic Uncertainty Jets
Electron MET Unfolding Backgrounds ATLAS Preliminary
(a) Electron channel
N
jets≥0 ≥1 ≥2 ≥3 ≥4
Mean rel. syst. variation
0 0.05 0.1 0.15 0.2 0.25 0.3 0.35 0.4 0.45 0.5
)) + jets µ-
µ+
→ ))/(Z(
ν µ
→ (W(
Statistical Uncertainty Total Systematic Uncertainty Jets
Muon MET Unfolding Backgrounds ATLAS Preliminary
(b) Muon channel
Figure 1: Relative statistical and systematic uncertainties on the R
jetsmeasurement in the (a) electron and (b) muon channels as a function of the inclusive jet multiplicity. The total systematic uncertainty is shown along with the di ff erent components of the systematic uncertainty.
the R
jetsmeasurement together with the statistical uncertainty as a function of inclusive jet multiplicity for the electron and muon channel respectively.
Jet related systematic uncertainties are dominated by the uncertainty on the jet energy scale (JES)
and resolution (JER). The JES uncertainty was derived via in-situ calibration techniques, such as the
transverse momentum balance in Z + jets, multi-jet and γ−jet events, for which a comparison between
data and simulation was performed [38]. The JER uncertainty was derived from a comparison of the
resolution measured in di-jet data events using the bisector method [37], and the same approach applied
to simulated di-jet events. The JER and JES uncertainties are highly correlated between W + jets and
Z + jets observables and are thus largely suppressed compared to the individual measurements. They
are nevertheless the dominant systematic uncertainties in the cases where there are one or two jets in the
events. The cancellation is not perfect because any changes in JES and JER were consistently propagated
to the E
missTmeasurement event-by-event. This causes larger associated migrations for the W selection
than for the Z selection. In addition, the level of background in the W + jets sample is larger, resulting
in a larger jet uncertainty compared to the Z + jets selection. The sum of JER and JES uncertainties
on the R
jetsmeasurement ranges from 3% to 8% in the electron channel and from 2% to 5% in the
muon channel as N
jetsranges from 1 to 4. The difference between the two channels is due to the fact
that the Z → ee background in the W → eν data sample is much larger than the respective Z → µµ
background in the W → µν sample, being about 7% for candidate events with one jet in the electron
channel compared to 3% in the muon channel. Z → ee background contaminates the W → eν sample
because one electron gets mis-identified as a jet, contributing to the JES and JER uncertainties. This contribution to the uncertainties does not cancel in R
jets.
The uncertainty on the electron and muon selections includes uncertainties on the electron energy or muon momentum scale and resolution, as well as uncertainties on the scale factors applied to the simulations in order to match the electron or muon trigger, reconstruction and identification e ffi ciencies to those in data. Any changes in lepton energy scale and resolution were consistently propagated to the E
missTmeasurement. The energy- or momentum-scale corrections of the leptons have been obtained from comparison of the Z-boson invariant mass distribution between data and simulations. The uncertainties on the scale factors have been derived from a comparison of tag-and-probe results in data and simula- tions [33, 42]. Each of these sources of uncertainty is relatively small on the R
jetsmeasurement (about 1% for N
jetsranging from 1 to 4 in both channels).
The uncertainties in E
missTdue to uncertainties in JES, JER, lepton energy scale and resolution were included in the values quoted above. A residual E
Tmissuncertainty accounts for uncertainties on the energy measurement of clusters in the calorimeters that are not associated with electrons or jets. It was determined via in-situ measurements and comparisons between data and simulation [43]. These systematic uncertainties affect only the numerator of the ratio because no E
missTcut was applied to Z + jets candidate events. The resulting uncertainty on the R
jetsmeasurement is about 1% for N
jetsranging from 1 to 4 in both channels.
The uncertainty on the unfolding has a component of statistical origin that comes from the limited number of events in each bin of the Monte Carlo inputs. This component was estimated from the root mean square of R
jetsmeasurements obtained from a large set of pseudo-data generated independently for the W + jets and Z + jets Monte Carlo samples used to unfold the data. The Monte Carlo modelling uncertainty on the unfolding procedure of the measurement was estimated using an alternative set of ALPGEN samples for which the nominal W + jets and Z + jets production has been modelled by di ff er- ent theoretical parameter values. The MLM matching procedure [44], employed to remove the double counting between partons generated from matrix element calculation and partons yielded by the parton shower, uses a matching cone of size R = 0.4 for matrix element partons of p
T> 20 GeV. To deter- mine how the choice of this cone size and the matching p
Tscale impacts the unfolded results, samples with variations of these parameters were used in the unfolding procedure. In addition, to account for the impact of changing the amount of radiation emitted from hard partons, ALPGEN Monte Carlo samples were generated with the renormalisation and factorisation scales set to half and twice their nominal value of
q
m
2V+ p
T2V, where V is the W or the Z boson depending on the sample. The systematic uncertainty is the sum in quadrature of the differences with respect to the R
jetsmeasurement obtained from the nominal samples. The overall uncertainty on the unfolding procedure ranges between 0.6% and 1.4% for N
jetsranging from 1 to 4.
For backgrounds estimated using simulation, the uncertainty on the cross section calculation was taken into account. The combined impact of these uncertainties on the R
jetsmeasurement is typically less than 1% for the di ff erent jet multiplicities.
For t¯ t predictions taken from the ALPGEN sample, the uncertainty on the cross section calculation is considered, but a shape uncertainty was also considered by comparing to the POWHEG-BOX t¯ t sample.
The largest contribution to the total uncertainty from the data-driven t¯ t estimate is from the statistical
uncertainty on the fit. The systematic uncertainty on the data-driven t¯ t estimate also covers uncertainties
on the contamination of the background template by signal events, on the choice of the fit range and other
small uncertainties. The latter include the uncertainties on the b-tagging e ffi ciencies and uncertainties on
the bias on the t¯ t distributions when applying the b-tagging. The uncertainty on the contribution from
W + heavy flavour events to the t¯ t template, modelled by ALPGEN Monte Carlo samples, was evaluated
by varying the W + c cross section and the combined W + cc and W + bb cross sections. The size
of the variations is 0.9 and 1.3 respectively. These factors were obtained from fits to the data in two
control regions, defined as one or two jets and at least one b-tagged jet. This uncertainty, which is 3%
of the number of t¯ t events for N
jets≥ 3, is largest at lower jet multiplicities where the contribution from W +heavy flavour is most significant. The fit range in transformed aplanarity was varied from the nominal upper limit of 0.85 to 0.83 and 0.87. The t¯ t uncertainty dominates for high jet multiplicity final states due to its increasing contribution which does not cancel in R
jets. It amounts to an uncertainty of 13% on the R
jetsmeasurement in the electron channel and to an uncertainty of 11% in the muon channel for events with at least four jets.
In the evaluation of the multi-jet background systematic uncertainties, various sources were taken into account. For the W +jets selection, the uncertainty on the shape of the template distributions of the multi-jet background was studied by varying the lepton isolation requirement and identification defini- tion. The nominal template fit range on E
missTwas also varied, within 10 GeV up and down from the nominal limits. The distributions of the signal template were alternatively modelled by SHERPA instead of ALPGEN and the difference was taken as uncertainty. The statistical uncertainty on the template nor- malisation factor from the fit was also included. Finally, to evaluate the uncertainty on the estimate of the multi-jet background to the Z + jets events, the fit ranges and the modelling of the signal and of the electroweak contamination were varied in the same way as for the W + jets events. The combined impact of these uncertainties on the R
jetsmeasurement varies between 2% and 6% in the electron channel and between 1% and 3% in the muon channel for N
jetsranging from 1 to 4.
8 Combination of electron and muon channels
In order to increase the precision on the W + jets to Z + jets di ff erential cross section ratio measurements the results obtained for each observable in the electron and the muon channels were statistically com- bined, accounting for correlations between the sources of systematic uncertainties a ff ecting each channel.
Since the electron and muon measurements have been performed in di ff erent fiducial regions, bin-by-bin correction factors, estimated using ALPGEN Monte Carlo samples, were applied to each measured dis- tribution to extrapolate the measurements to the common phase space defined in Table 1. The corrections on the R
jetsmeasurement are of the order of 6% in the electron channel and 1% in the muon channel.
The uncertainties on the acceptance corrections are below 0.5%, as determined by using SHERPA in- stead of ALPGEN. By comparing distributions computed at LO and NLO, it has been checked with the MCFM [45] program that NLO e ff ects on the extrapolation to the common phase space are negligible.
Before the combination was performed, the individual results of the two channels were compared to each other after extrapolation; the results are compatible within their respective uncertainties.
The method of combination used is an averaging procedure described in Refs. [46, 47]. Each dis-
tribution was combined separately by minimising a χ
2function which takes into account the results in
the extrapolated electron and muon channels and all systematic uncertainties on both channels. The
uncertainties on the modelling in the unfolding procedure, the luminosity, the backgrounds estimated
from simulation and all the systematic uncertainties of the data-driven t¯ t estimation have been treated
as correlated among bins and between channels. The lepton systematic uncertainties and the systematic
uncertainties on multi-jet backgrounds were assumed correlated between bins of a given distribution,
but independent between the two lepton channel measurements. The statistical uncertainties of the data,
the Monte Carlo statistical uncertainty of the unfolding procedure, the statistical uncertainty of the t¯ t fit
and the JER uncertainty were treated as uncorrelated among bins and channels. Finally the uncertainties
from the JES were treated as fully correlated between all bins and do not enter the combination proce-
dure. The JES uncertainty on the combined result was taken as the weighted average of the corresponding
uncertainties on the electron and muon measurements.
9 Theoretical predictions
The measured distributions of all the observables considered in the analysis are compared at particle level to various pQCD predictions in the phase space defined in Table 1.
Next-to-leading order (NLO) pQCD predictions were calculated with B lack H at+SHERPA [48–50]
at parton level for various parton multiplicities, from zero to four. In this calculation B lack H at is used for the computation of the virtual one-loop matrix elements, while SHERPA is used for the real emission part and the phase space integration. The fixed-order calculation is performed at parton level only, without radiation and hadronization e ff ects. Renormalisation and factorisation scales were evaluated at H
T/2, where H
Tis defined as the scalar sum of transverse momenta of all stable particles and partons in each event. The PDF set used was CT10 [17]. Partons were clustered to jets using the anti-k
talgorithm with R = 0.4.
The e ff ect of uncertainties on the prediction has been computed for R
jets, accounting for correlation between W + jets and Z + jets individual processes. The uncertainties on the theoretical predictions are significantly reduced in this procedure, with the statistical uncertainty on the samples often dominating.
Uncertainties on the renormalisation and the factorisation scales were evaluated by varying these scales independently to half and twice their nominal value. The PDF uncertainties were computed from the CT10 eigenvectors, derived with the Hessian method at 68% confidence level [17]. The combined e ff ect of the changes to R
jetsunder each of those PDF variations is used as the uncertainty on the predic- tions. In addition, the nominal value of the strong coupling constant α
s= 0.118, was varied by ±0.0012, and the impact of this variation was taken into account in the PDF uncertainty. All the uncertainty components mentioned above were then added in quadrature. The total systematic uncertainty on the prediction ranges from 0.3% to 1.8% for inclusive jet multiplicities ranging from one to four, and from 2% to 6% for leading jet p
Tranging from 30 to 700 GeV.
In order to compare the B lack H at+ SHERPA parton-level predictions with the measurements at par- ticle level, a set of non-perturbative corrections was applied to the predictions. Corrections for the un- derlying event (UE) were calculated using samples generated with ALPGEN +HERWIG +JIMMY. The ratio of samples where the UE has been switched on and o ff was evaluated in each bin of each distri- bution. Corrections for the hadronization of partons to jets were computed using similar samples by forming the ratio of distributions obtained using jets clustered from hadrons versus jets clustered from partons. In R
jets, the hadronization and UE corrections are quite small (typically 2% to 3% for the ex- clusive jet multiplicity) and in the opposite direction, such that the overall correction factor is close to unity. Additional ALPGEN +PYTHIA samples were used to estimate the uncertainties due to these non-perturbative corrections, that are typically well below 1%.
Finally, corrections for QED final state radiation were calculated as the ratio of cross sections de- rived from leptons before any final-state photon radiation to “dressed” leptons, using ALPGEN samples interfaced to PHOTOS. These corrections range between 1% and 2% for both the electron and the muon channel. Systematic uncertainties were derived by comparing with corrections obtained using SHERPA, which calculates final state QED radiation using the YFS method [51]. The differences between the predictions are typically well below 1%.
Tree-level multi-leg matrix element calculations matched to parton showering algorithms were ob-
tained from the ALPGEN and SHERPA generators. These calculations use different PDF sets, matching
procedures, parton shower evolution, and hadronization and multi-parton interaction modelling, as de-
tailed in Section 3. Only statistical uncertainties were considered for these predictions.
Njets
0 1 2 3 4
) jetsZ+Nσ)/( jetsW+Nσ(
8 10 12 14 16 18
ATLAS Preliminary jets, R=0.4, anti-kt
| < 4.4 > 30 GeV, |yj j
pT
)) + jets l-
l+
→ ))/(Z(
ν
→ l (W(
=7 TeV, 4.6 fb-1
s Data,
+SHERPA HAT
BLACK
ALPGEN+HERWIG SHERPA
Njets
0 1 2 3 4
NLO / Data 0.9
1
1.1 BLACKHAT+SHERPA
Njets
0 1 2 3 4
MC / Data 0.9
1
1.1 ALPGEN
Njets
0 1 2 3 4
MC / Data 0.9
1
1.1 SHERPA
Njets
≥0 ≥1 ≥2 ≥3 ≥4
) jetsZ+Nσ)/( jetsW+Nσ(
8 10 12 14 16 18
ATLAS Preliminary jets, R=0.4, anti-kt
| < 4.4 > 30 GeV, |yj j
pT
)) + jets l-
l+
→ ))/(Z(
ν
→ l (W(
=7 TeV, 4.6 fb-1
s Data,
+SHERPA HAT
BLACK
ALPGEN+HERWIG SHERPA
Njets
≥0 ≥1 ≥2 ≥3 ≥4
NLO / Data 0.9
1
1.1 BLACKHAT+SHERPA
Njets
≥0 ≥1 ≥2 ≥3 ≥4
MC / Data 0.9
1
1.1 ALPGEN
Njets
≥0 ≥1 ≥2 ≥3 ≥4
MC / Data 0.9
1
1.1 SHERPA
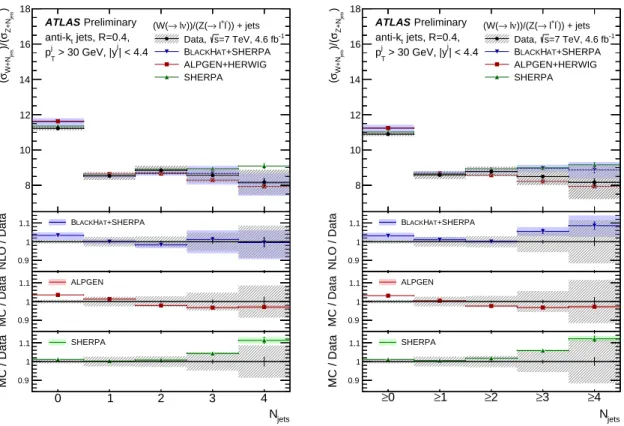
Figure 2: R
jetsas a function of exclusive jet multiplicity (left) and inclusive jet multiplicity (right).
The electron and muon channel measurements are combined as described in the text. Ratios of the B lack H at+SHERPA NLO calculation and the ALPGEN and SHERPA generators to the data are shown in the lower panels. Vertical error bars show the respective statistical uncertainties. The hatched error band shows statistical and systematic uncertainties added in quadrature for the data. The solid error bands show the statistical uncertainties for the ALPGEN and SHERPA predictions, and the combined statistical and theoretical uncertainties for the B lack H at+ SHERPA prediction.
10 Results and discussion
The theoretical predictions described in Section 9 are compared to the experimental data unfolded to particle level, as defined in Section 6. Individual ratios of the BlackHat+SHERPA, ALPGEN, and SHERPA predictions and unfolded data make it possible to disentangle the important features of each theoretical prediction. The R
jetsresults highlight the ability of these Monte Carlo programs to model the differences between Z + jets and W + jets processes.
Figure 2 shows R
jetsas a function of exclusive and inclusive jet multiplicity. The theoretical predic- tions describe the data. The SHERPA prediction is about 1σ of the experimental uncertainties greater than the measurement at high jet multiplicities, where the effects of hard QCD radiation are tested. The ALPGEN predictions agree with data, except in the inclusive (≥ 0 jet) measurement, where it deviates from the data by approximately 2σ of the the experimental uncertainties. B lack H at+ SHERPA is able to describe the data, within the theoretical uncertainties, even though it does not include all contributions for events with at least four jets.
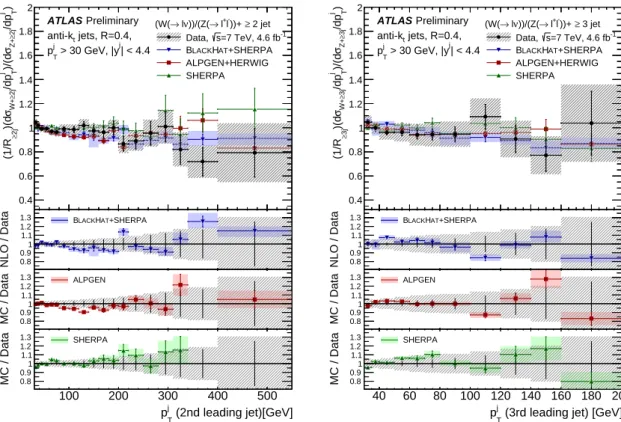
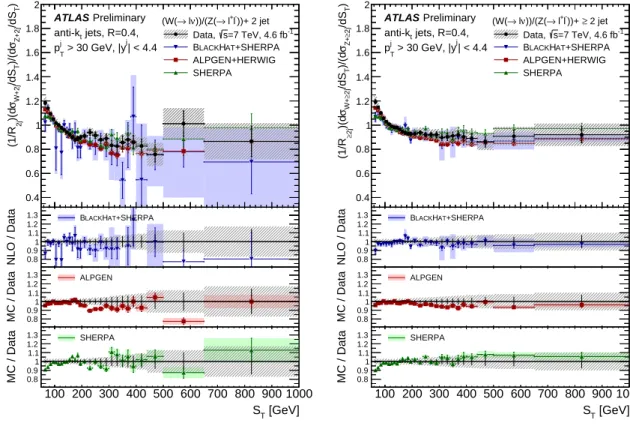
In the following figures, R
jetsis normalised to the ratio of the W and Z cross sections in the corre-
sponding jet multiplicity bin presented in Figure 2, so that the shapes of the distributions can be com-
pared. Figure 3 shows the R
jetsratio versus the leading jet p
Tfor N
jets= 1 and N
jets≥ 1. At low transverse
momentum ( p
T< 200 GeV), the R
jetsdistribution falls as the leading jet p
Tincreases, indicating that
(leading jet) [GeV]
j
pT
50 100 150 200 250 300 350 400 450
)j T/dpZ+1jσ)/(dj T/dpW+1jσ)(d 1j(1/R
0.4 0.6 0.8 1 1.2 1.4 1.6 1.8 2
ATLAS Preliminary jets, R=0.4, anti-kt
| < 4.4 > 30 GeV, |yj j
pT
))+ 1 jet l-
l+
→ ))/(Z(
ν
→ l (W(
=7 TeV, 4.6 fb-1
s Data,
+SHERPA HAT
BLACK
ALPGEN+HERWIG SHERPA
(leading jet) [GeV]
j pT
50 100 150 200 250 300 350 400 450
NLO / Data 0.8
0.9 1 1.1 1.2
1.3 BLACKHAT+SHERPA
(leading jet) [GeV]
j pT
50 100 150 200 250 300 350 400 450
MC / Data 0.8
0.9 1 1.1 1.2
1.3 ALPGEN
(leading jet) [GeV]
j
pT
50 100 150 200 250 300 350 400 450
MC / Data 0.8
0.9 1 1.1 1.2
1.3 SHERPA
(leading jet) [GeV]
j
pT
100 200 300 400 500 600 700
)j T/dp1j≥Z+σ)/(dj T/dp1j≥W+σ)(d 1j≥(1/R
0.4 0.6 0.8 1 1.2 1.4 1.6 1.8 2
ATLAS Preliminary jets, R=0.4, anti-kt
| < 4.4 > 30 GeV, |yj j
pT
1 jet
≥
-))+
+l
→ l ))/(Z(
ν
→ l (W(
=7 TeV, 4.6 fb-1
s Data,
+SHERPA HAT
BLACK
ALPGEN+HERWIG SHERPA
(leading jet) [GeV]
j pT
100 200 300 400 500 600 700
NLO / Data 0.8
0.9 1 1.1 1.2
1.3 BLACKHAT+SHERPA
(leading jet) [GeV]
j pT
100 200 300 400 500 600 700
MC / Data 0.8
0.9 1 1.1 1.2
1.3 ALPGEN
(leading jet) [GeV]
j
pT
100 200 300 400 500 600 700
MC / Data 0.8
0.9 1 1.1 1.2
1.3 SHERPA